TRON Weekly View - March 2023Hello Guys, Weekly Analysis is on the TRXUSDT Symbol in a 1H Time frame, I Hope it Will be Useful for You, Don't Forget to Like, Follow, Comment
TRXUSDT_26B410 trade ideas

TRXUSDTThe supports & resistances have been marked in the 1H TF and will wait for the market to reach any of our entries for long/short.

Tron ( TRZ) FlagWhat Is Tron?
Tron is a blockchain-based decentralized digital platform with its own cryptocurrency, called Tronix or TRX. Founded in 2017 by a Singapore non-profit organization, the Tron Foundation, Tron aims to host a global entertainment system for the cost-effective sharing of digital content.
Initially marketed primarily in Asia, Tron had now gone global. The platform had more than 50 million accounts as of August 2021.
1
Founded by Justin Sun, now its CEO, Tron has offices in Singapore and San Francisco. Born in 1990, Sun also is the CEO of BitTorrent, the file-sharing program.
Tron is a blockchain-based digital platform that primarily hosts entertainment applications.
It has its own in-house cryptocurrency, called Tronix or TRX.
TRX ranks 31st among cryptocurrencies in market capitalization.
LEVERAGE: X5

TRXUSD ❕ above the liquidityTRX trades above liquidity.
The asset has successfully held the support level.
Price will bounce after it fixes above the support level.

TRXUSDT - non trending marketThe price is moving sideways. We placed both Buy limit & Sell limit orders. When the first order is filled, the other order will be canceled.
Move your Stop Loss to the Entry Point when TP 1 get hit.

TRX/USDT Still Inside The Formation!Hey, guys ✌️
Next one on our watchlist is TRX coin. TRX coin has been bouncing from one side to another, where currently we are approaching that upper side of triangle formation! Waiting here for one last liquidation grab to upper zones after what we want to see a potential drop to happen. But we can't leave behind the hypothesis that price can breakout from that upper zone and result the price to go towards $0.077.
Stay alerted!
If you like ideas provided by our team you can show us your support by liking and commenting.
Yours Sincerely,
Swallow Team 🔱
Disclamer:
We are not financial advisors. The content that we share on this website are for educational purposes and are our own personal opinions.

Where Did Justin Sun's Net Worth Go?Formerly his public wallet had +1.1bn in it.
See: debank.com
It's now down to 177mm... If there is bad news this week, it's possible that we could see issues with the USDD reserves and a liquidity crunch to stabilize USDD.
I'm a little worried - saw some reports on Twitter saying that Sun has been deploying capital today and not sure why/what's up.
TRX has been going up, and is currently unable to break 0.061.
The 5m gap was already filled. This area is a visible line historically.
The other thing worrying me is that the Tron Dao Reserves site states that USDD is collateralized 150%, but when I check the actual reserve wallets, it seems to be including the TRX burn contracts. And those values are still overstated by about 200mm on the value collateralizing the 700mm USD in circulation.
So... Assume that Justin Sun has 177mm in his public wallet, that the Tron DAO Reserves may just only slightly over-collateralized, and what happens if a crypto ban hits, price drops 20 or 30% on TRX? I'm a little worried about this piece but it may be nothing. Just a curious look around on a sunday.

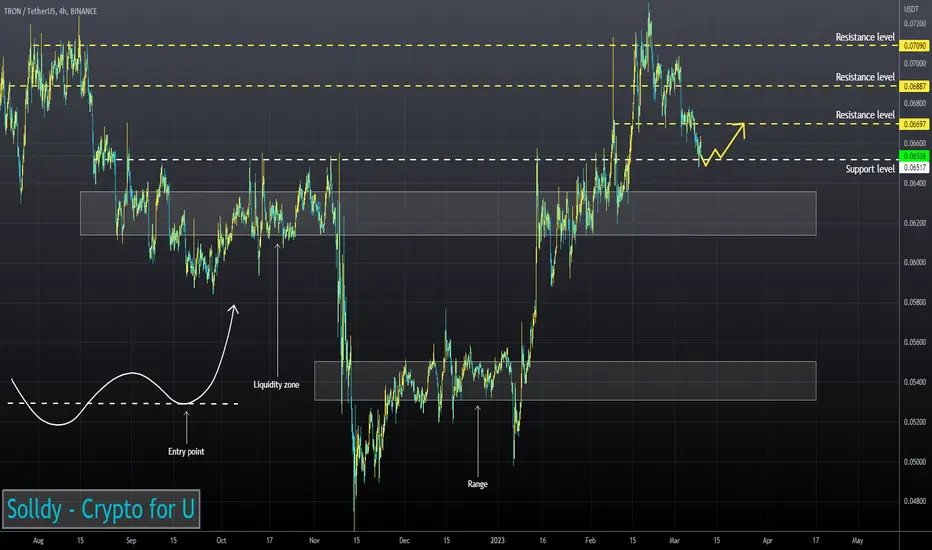
trxusdt (Tron) in 15M TimeFrametrxusdt (Tron) in 15M TimeFrame | As you can see, the flag pattern in this coin is quite clear, in my opinion, at this moment, the market maker is collecting coins and it will experience growth and growth again, just like the flag pole, this is a personal opinion and only for Your review will be shared


Trx in big troubleMassive red candle in there volume and a huge dunno gives us the energy to go to .04

TRXUSD: Trendline EntrySimple Trendline Trade Entry on Tron.
I usually look fore more but this feels like more of a simple situation and Tron usually goes for the simpler outcomes.

TRX minting is still coming (USDD)...Hello,
i believe the current uptrend in btc and alts isnt for too long.
i looked up for promising short setups in alts and came across TRX.
It seems to trade in a triangle which should break (up or) down soon.
Justin Sun still wants to enable the TRX burn and mint functions (the same as LUNA/UST), but there is currently no date for that.
Originaly they wanted to enable the TRX/USDD mechanism back in November but Justin Sun delayed it.
(He likely delayed it and made the date unknown so traders cant frontrun TRX and sell it off!)
USDD is a ponzi and its not even hard to tell, obviously 30%+ APY is a Ponzi.
When the USDD/TRX mint will get enabled then it is gameover for TRX.
TRX will likely go to like 0.0000001 just like LUNA did if the TRX mint gets turned on.
That plus the TA of the triangle makes this an excellent short target in my view.
TA + Fundamentals line up and these are usualy good setups.
My targets are very conservative interpretation of the triangle resistance, it may aswell sell off earlier. (will look for new short if so)
Im still using a tight stoploss and doing low leverage (and kinda hoping it isnt too tight, better pick ur own sl+entry)
Note: there´s also counterparty risk. I personaly dont trust Binance for example.
(Im using Kraken as its USA regulated but even then, who knows!)
Be careful and dont hold more then ur affordable to loose on any exchange.
That said, trade safe and please only invest what ur affordable to loose, as Crypto is a fraud ridden bubble (imo).

TRXUSD ❕ descending wedgeTRX is trading above liquidity.
The RSI chart is moving in the buy zone (1H and 30m TFs)
I believe the asset could bounce from the current support level.
✅TS ❕ TRXUSD: downtrend✅✅ TRX continues to move in a downtrend.
The asset will continue to decline. ✅
🚀 SELL scenario: short to 0.0639. 🚀
----------------------------------------------------------------------------
Remember, there is no place for luck in trading - only strategy!
Thanks for the likes and comments

TRON shortTRON broke trough the support level. Asset broke trough the ascending trendline. Bearish movement to support level at 0.0617 is possible.

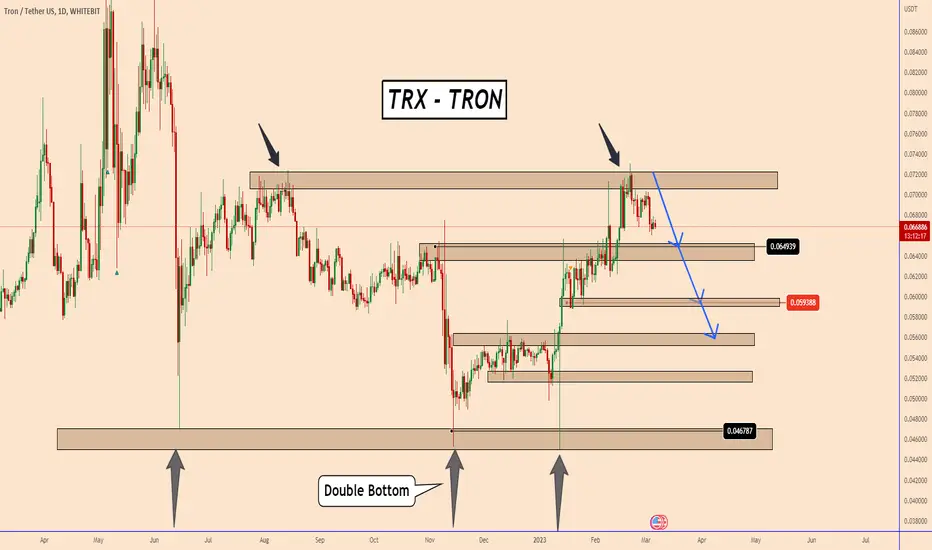
TRON (TRX): Price is Developing as ExpectedTRON (TRX): Price is Developing as Expected
During the previous week, I published this analysis with expectations
that the upper part of the structure was going to show strength.
As you may see price reacted very well on the daily chart it is showing
about a clear bearish rejection near the resistance zone.
Considering that the market is also facing insecurity related to the Silvergate
the price may move down even more.
Thank you and Good Luck!
TRX/USDT On The Lower Side Of PathHey, guys ✌️
TRX/USDT pair is next on our watchlist. With a nice sideways movement we see a price pushing towards that lower side of bar with third attempt to break that for a bigger bearish movement. Currently on third attempt we might see that final direction here which can result the price to move to either 0.064 or 0.07. Waiting for the good momentum here!
If you like ideas provided by our team you can show us your support by liking and commenting.
Yours Sincerely,
Swallow Team 🔱
Disclamer:
We are not financial advisors. The content that we share on this website are for educational purposes and are our own personal opinions.

TRX Possible ScenarioPrice can possibly act on the showed order blocks. Wait for other confluences before placing positions


trxit the candle closed under the red line we can open sell position with R/R2 but do not closed all position just 35 %

TRX USDTTRX USDT buy/long idea
update on my previous idea.
still waiting for the setup to playout.
Harmonic + SMC
details on chart

TRX
In the past, a triangle was formed that achieved a 7X and currently the same model is being formed with the goal of achieving at least a 5X.

TRX/USDT waiting for pullbackHey, guys ✌️
Next one we would like you to take a peek at is TRX coin. Currently trying for the fourth time to break that upper resistance we see the lack of volume behind it for now. Waiting here and watching closely as it might have a nice turnover!!
If you like ideas provided by our team you can show us your support by liking and commenting.
Yours Sincerely,
Swallow Team 🔱
Disclamer:
We are not financial advisors. The content that we share on this website are for educational purposes and are our own personal opinions.
