Contracting Bollinger Bands on the 1W chartHello?
Traders, welcome.
If you "Follow", you can always get new information quickly.
Please also click "Boost".
Have a good day.
Following yesterday, today we changed the background color of the chart.
Please leave a comment on which chart is more eye-catching, yesterday's background color or today's background color.
For your information, there is a significant difference between viewing a chart in real time and sharing a chart with a picture.
Therefore, I would be grateful if those who share and use my charts leave comments.
-------------------------------------
(TRXBTC 1W Chart)
The key is whether it can rise above 0.0000 0318 in order to release the upward force.
---------------------------------------
------------------------------------------
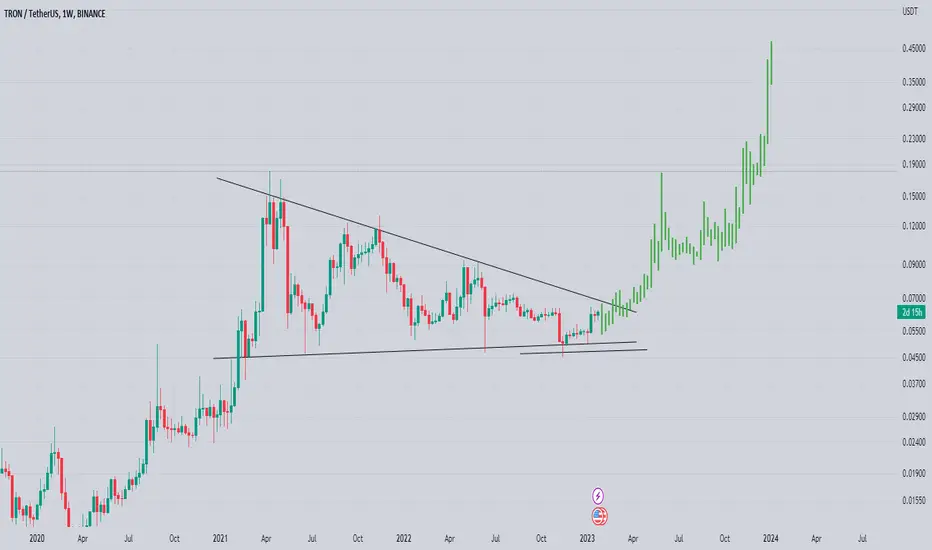
(TRXUSDT 1W chart)
The key is whether it can be supported at 0.06427.
In particular, as the Bollinger Bands are contracting, volatility is expected in the near future.
(1D chart)
It is important to be able to rise above the 0.06427-0.06532 section and be supported.
If not, you should check for support around 0.06004.
TRX is holding the price near the M-Signal on the 1M chart, so it can be clearly seen that the long-term trend is about to turn into an uptrend.
Therefore, as mentioned in the explanation of the 1W chart, it can be seen that the current position is located in a very important section.
If the mid- to long-term wiggle starts, there is a possibility of touching around 0.05358, so you should think about how to respond now.
-------------------------------------------------- -------------------------------------------
** All descriptions are for reference only and do not guarantee profit or loss in investment.
** If you share this chart, you can use the indicators normally.
** The MRHAB-T indicator includes indicators that indicate points of support and resistance.
** Check the formulas for the MS-Signal, HA-Low, and HA-High indicators at ().
(Short-term Stop Loss can be said to be a point where profit or loss can be preserved or additional entry can be made by split trading. This is a short-term investment perspective.)
---------------------------------
TRXUSDT_26B410 trade ideas

TRXUSDTAnalysis based on price action patterns and supply and demand levels
and breaking the downward trend line

✅TS ❕ TRXUSD: ascending wedge✅✅ TRX has formed an ascending wedge.
The price is testing the support level.
The reversal will begin after consolidation under the support level. ✅
🚀 SELL scenario: short to 0.0602. 🚀
----------------------------------------------------------------------------
Remember, there is no place for luck in trading - only strategy!
Thanks for the likes and comments

TRX/USDT pumping is near?Hi Dears
Do you heard about WOW TRADE strategy?
We have a higher time frame trendline line (weekly). We are near the demand in control zone of higher timeframe. We break the trendline and after that we have a pullback to the trendline, base that cause this breaking or break even zone.
After that the price will be in the moon.
And now we are watching this strategy for trx usdt.
I hope it works properly.
Sincerely
Hosein Poursaei

Tron TRX is breaking out! Explosive pump is likely.
As you can see, TRX is currently breaking out of the descending triangle on the daily/weekly timeframe, and an explosive pump is now likely!
The take-profit is at the top of the triangle, which is 0.18 USDT. I think it's possible to go higher, but we don't want to risk anything, because we could be in wave 5 from the Elliott Wave perspective. Triangles are typically formed as a 4th corrective wave.
This bull market that started in January is absolutely amazing, and I hope it will continue as long as it possibly can! We want to take as much profit as possible from this bull run.
Sending USDT via the TRX network (TRC20) is very popular among crypto people. Furthermore, Tron's value held up very well during the 2022 bear market. It's definitely a positive sign.
Now is the best time to buy TRX if you don't want to miss out on the upcoming pump! It will be huge!
This analysis is not a trade setup; there is no stop-loss, entry point, profit target, expected duration of the trade, risk-to-reward ratio, or timing. I post trade setups privately.
If we take a look at the previous price action from 2020 to 2021, there are no gaps that need to be filled. In other words, it's possible that we will never go back to these levels.
I'm not sure how you feel about it, but I'm already long in the futures market. 171% is a good profit, so be greedy!
Thank you, and for more ideas, hit "Like" and "Follow"!


TRX/USDTesting/tracking elliot wave theory. Please do not trade off idea without S/L. Not financial advice.
I had to draw some data in here that was not shown (white squiggly lines) Without full data on a chart, it's hard to count waves accurately. This chart is on the weekly timeframe.
I cannot predict time, however I am trying to with this chart. Future resistance and support lines are also predictions.
RR: 9
Possible upside: 480%
Possible downside: 53%

TRON Weekly View - February 2023Hello Guys, Weekly Analysis is on the TRON Symbol in a 4H Time frame, I Hope it Will be Useful for You, Don't Forget to Like, Follow, Comment

Trxusdt Getting Ready Forming Symmetrical Triangle In weekly Timeframe
Incase Of Breakout Expecting 500b to 600^ Bulish Move Keep Eyes On That
Place stoploss Below Blackline

TRXUSD: Daily VCPVCP: 4W 11/6 3T
The posted chart contains a VCP (volatility contraction pattern). The first label "W" stands for weekly and shows the duration of the entire consolidation. In the middle label, the percentage of contractions is indicated (for example, "15/4"), with 15 representing the -15% depth of the base and 4 representing -4% of the last contraction. The last part "T" represents the number of contractions. The light blue lines in the chart correspond to the contractions. A more detailed description can be found in Mark Minervini's books.
RS stands for relative strength and measures the strength of the stock compared to the overall market. The value range is 1-99 with 99 being the highest value. The rank was generated by fyntrade.

TRONUSDT (Daily) - Bullish breakoutHi Traders
TRONUSDT (Daily Timeframe)
The market is in an uptrend and we are waiting for an entry signal to go LONG above the 0.0659 resistance level. Only the downward break of 0.0587 would cancel the bullish scenario.
Trade details
Entry: 0.0659
Stop loss: 0.0587
Take profit 1: 0.0700
Take profit 2: 0.0770
Score: 8
Strategy: Bullish breakout

TRXUSDT will TRX USDT reach the key level at the price of 0.072 or even 0.12 ?
comparatively large sums have appeared in the footprint, after the liquidity stage for the sellers, that was my motivation to open this transaction

TRX Breaking Out the Triangle which is the 4th WaveTRX Breaking Out the Triangle which is the 4th Wave. Projection based on 0.618% fib extension.

✴️ TRON Giveaway Signal Plus Previous ChartLook at the candle two days ago... This is the strongest reversal signal ever.
If you see something like this, you just confirmed that it cannot go lower... As it did go extremely low in just one session and everything was bought back up.
The long lower candle 26-Jan-2023 TRXUSDT Daily.
For the full analysis see the previous chart.
TRXUSDT Dec. 21, 2022 | ✴️ How To Trade Cryptocurrencies | It Is Very Hard... Is It Not?
Namaste.


trx usdtThe higher time frame is showing a good support zone now just wait for a retest hopefully it will happen

🔥TRON IS GOING TO BREAK THE 2-YEAR TRIANGLE: PUMP SOON?🚀🔥Hi friends! First of all, take a look at the chart. See how the whales accumulate their positions: sl hunting and volume confirmation? This is a perfect example of how they work.
📊 MY TRADING PLAN FOR TRX:
1. squeeze to the trendline
2. sl hunting below the POC area ($0.06-0.064)
3. bullish BTC
🚩 I think that this squeeze to the global trendline will be successful and TRX will break it with PUMP. This will be the best scenario,
✅ MY TARGETS FOR TRX:
🔥 $0.072 - the key level
🔥 $0.092 - the key level
🔥 $0.12 - the local high and key level
Traders, will TRX become the top gainer of the bull market? According to this triangle pattern, the target is at least +290%. Write your thoughts in the comments!
💻Friends, press the "boost"🚀 button, write comments and share with your friends - it will be the best THANK YOU.
P.S. Personally, I open an entry if the price shows it according to my strategy.
Always do your analysis before making a trade.

#TRX/USDT [TRON]: Descending_ChannelWe've detected a Falling Wedge pattern on the $TRX/USDT chart. This pattern is a bullish indication and could indicate a potential trend reversal. We may consider buying at the current price zone and targetting higher level.

TRON Weekly View - JANUARY 2023Hello Guys, Weekly Analysis is on the TRON Symbol in a 4H Time frame, I Hope it Will be Useful for You, Don't Forget to Like, Follow, Comment


