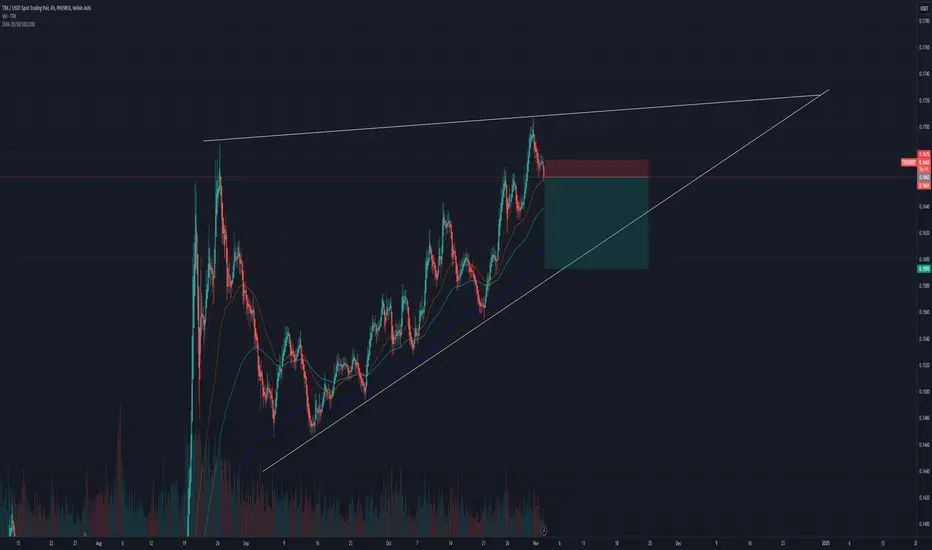
Lingrid | TRXUSDT strong BULLISH Trending MARKETThe price perfectly fulfilled my last idea. It hit the target level. BINANCE:TRXUSDT is displaying a strong bullish trend, as evidenced by its consistent formation of higher lows and higher highs. On the daily timeframe, the market has retraced after reaching new all-time highs. There's a possibility that the price might pull back toward the support level, dipping below the psychological round number at 0.200. I anticipate that the market could form a correction toward the lower border of the channel before continuing its upward movement. This correction might provide an opportunity for buyers to enter, with the potential for the price to retest the recent higher high level afterwards. My goal is resistance zone around 0.2200
Traders, if you liked this idea or if you have your own opinion about it, write in the comments. I will be glad 👩💻
TRXUSDT_26B410 trade ideas

TRON | TRX TRX Suddenly Jumps 10%, but Why?
The price of TRON is $0.084 today with a 24hour trading volume of 777 million dollar. This represents a 10% price increase in the last 24 hours.
TRON founder Justin Sun made it known on Twitter that TRON has expanded its reach by going live on the Ethereum blockchain by leveraging the BitTorrent bridge. "TRX is now fully accessible within the Ethereum ecosystem," the TRON founder added.
Onchain analytics highlights that crypto is seeing a bullish end to the week. This comes as the majority of crypto assets are trading in green at press time after earlier declines in the week.
TRX has been on a steady rise since March 22 after its price hit lows of $0.055. The move gained immense traction on June 2 as TRX exploded from lows of $0.074 to reach highs of $0.084
I opened long position at 0.049 and going to take huge profit right now.we can have pullback at 0.087 so no fomo. trade with strategy

"TRX Triumphs: Why Now’s the Time to Ride the Wave"TRON, a blockchain platform supporting decentralized applications and smart contracts, has recently reached a multi-year high of $0.1914 before consolidating at $0.1796. Recent price surges, alongside strong on-chain activity with over 271 million accounts and consistent transaction volume, reflect its growing Web3 dominance. The network’s deflationary measures, including a recent burn of 11.8 million TRX, and increasing adoption of meme coins on its platform further solidify its bullish trajectory. TRON's resilience in a volatile crypto market makes it a promising opportunity for strategic investors

trx/usdtHello,
This is an analysis of trx/usdt .
This analysis is brought to you by the FXonbit Traders Team

TRX: Retracement Level On MonitoringAfter the previous uptrend Fibonacci have been SUCCESSFUL.
Let's see how this one for monitoring futher of the downtrend.

TRX Start For RaisingIf TRX breakout Red Line (Dynamic Resistance) Ready For Raising To First Static Resistance

Lingrid | TRXUSDT pulled Back after reaching All-Time HighThe price perfectly fulfilled my last idea. It hit the target level. BINANCE:TRXUSDT has pulled back toward the support level after forming an all-time high level. The price is currently near a key swap zone, where it has previously bounced multiple times, highlighting its significance. On the weekly timeframe, we can observe a large bullish candle, suggesting that it would be healthy for the price to revisit one-third of the previous week's candle or the psychological level at 0.1900. Nevertheless, I expect the price to pull back slightly before continuing its bullish movement. My goal is resistance zone around 0.2070
Traders, if you liked this idea or if you have your own opinion about it, write in the comments. I will be glad 👩💻

TRX Bullish 20% UPlet's keep it simple..
we have up-trend + Nice bullish Triangle
selling at Multiple resistance at 0.1970/0.20 (20%)
stoploss 4h close bellow 0.1560
BINANCE:TRXUSDT

TRON: It's been a while we see this.This is the current configuration trend of TRON.
Look at the Fibonacci Expansion level.
We would want to see it stays above 0.382 level to achieve its potential.

Alikze »» TRX | Wave 3 or C bullish scenarioIn time 2W, after an ascending wave and a double correction at the bottom of the channel, after successfully exiting the concentration, it is moving towards the specified targets. This upward wave is due to the structure in wave 3, whose micro waves will be presented in the next updates. But this upward move will have the ability to reach at least $0.58 and $1.2 in the long term. If no candlestick penetrates below 0.5177, this analysis will be valid for the specified purposes.
🟩Sup:0.097
⛳️Tp 1:0.177
⛳️ Tp2 : 0.58413
⛳️ Tp3 :1.23008
»»»«««»»»«««»»»«««
Please support this idea with a LIKE and COMMENT if you find it useful and Click "Follow" on our profile if you'd like these trade ideas delivered straight to your email in the future.
Thanks for your continued support.
Sincerely.❤️

2.2 RR tradePrice may never come down to the indicated entry. If it does though, the entry range indicated should at least give some profit even if it doesn't hit the indicated target.

TRX (Tron) Project | Key Zones For Re-Entry / ExitTron has beaten it's ATH amongst the Risk On Sentiment of Markets post Trump Election.
It's always ideal to exit at ATH's if possible, as beyond here you cannot put an exact $ amount or % Chance of X Price.
Also may see larger profit taking and drops, allowing you to take re-longs lower.

Here I buy Tron at $0.17Now I'm moving to Tron right now
Buy orders starting at $0.17
I think I'm triggering a Tron supply shock now.
And that's how it is. Simple and objective. I don't complicate trade. I simplify it.
If you're thinking I must share indicators, fibs and moving averages, you must be new.
.
Action takers are money makers.
Charting is for the ones that want to predict the future and I don't like to predict the future cause is like flipping a coin 50/50.
I rather take a shortcut and create the future.

Lingrid | TRXUSDT pullback and CONTINUATION of the BULLISH trendThe price perfectly fulfilled my last idea. It hit the target level. BINANCE:TRXUSDT has been showing a bullish trend, consistently making higher lows and higher highs. Recently, the price pulled back from the resistance zone but found support at the psychological level of 0.1600. After that, the market dipped below the previous week's low to grab liquidity before continuing its upward movement. Given these factors, I believe the market may reach the recent resistance zone again. My goal is resistance zone around 0.1676
Traders, if you liked this idea or if you have your own opinion about it, write in the comments. I will be glad 👩💻

TRXUSDT Approaching Key ResistanceTRX has shown impressive strength, gradually increasing by approximately 260% over the past two years. The price has steadily climbed from its lows, forming a strong uptrend, and is now nearing a critical resistance zone at its previous all-time high (ATH).
If TRX manages to break above this key resistance, it could signal a bullish continuation, opening the path for further upward momentum. A successful breakout would likely attract additional buying interest, potentially leading TRX to explore new highs.
Regards
Hexa

TRX Price Action in Fibo 618Thesis:
- Uptrend Continuation
- Price Action in 618
- Total transaction surged in Tron network
- Binance provides swap alert in Tron
- Tron has been integrated with Chainlink data feed

TRXUSDT SHORT 15M TF🚀The Atom Signals Trading View Indicator is a sophisticated tool designed for traders seeking to enhance their market analysis and trading strategies. Developed with the intention of providing clear and actionable signals, this indicator leverages a blend of technical analysis techniques to identify potential entry and exit points in the market. It aims to simplify the decision-making process by offering visual cues and alerts, which can be particularly valuable for both novice and experienced traders.🤖
🚀Key features of the Atom Signals Indicator include its adaptability to various trading styles—whether you're a day trader, swing trader, or long-term investor. By incorporating elements like trend detection, momentum analysis, and support/resistance levels, it provides a comprehensive overview of market conditions. This versatility makes it a useful addition to any trader's toolkit, regardless of the asset class they are focusing on, be it stocks, forex, cryptocurrencies, or commodities.🤖
🚀With its user-friendly interface on Trading View, the Atom Signals Indicator is accessible to traders of all experience levels. It not only aids in identifying trading opportunities but also assists in managing risk by highlighting potential reversals or consolidations. Whether you're looking to fine-tune your strategy or gain a fresh perspective on market movements, the Atom Signals Trading View Indicator offers a valuable resource for informed decision-making in the fast-paced world of trading.🤖
Based on the indicator we predict as shown in the charts.
You can check the indicator. You can DM for more info.
🚀Good Luck!

Shorting TronI think there's a good chance it comes down to support just under 16 cents and possibly quite a bit lower depending on how to market looks at the close today and tomorrow morning. Tight stop loss, high probability. TRX is lagging behind the other alt corrections.

Tron: New High & Double-Top (Full Trade-Numbers SHORT Incl.)TRXUSDT (Tron) just produced a new high and double-top. This is one of the pairs that offers the best risk reward ratio because it trades so close near the All-Time High, near resistance.
Current price action is ultra-bearish.
There are many signals we can look at but let's keep it simple.
Notice the high bearish volume on 21-August, this is the main bearish signal and predicts that the top is in and a major crash follows next. The crash can take days, weeks or months to happen but this is the next major move.
Notice there are no huge green volume bars. If TRXUSDT were trading at bottom prices and ready to grow, you would see a very strong green volume bar before the rise, the inverse of what we are seeing now.
We have an active short from August 22 and it is still valid, I will share it below for your convenience:
This is just a friendly warning/reminder.
Remember that leveraged trading is for experts only and carries high risk. Do your own research.
I am rooting for your continued expansion.
I am hoping that you can achieve your financial goals and achieve personal success.
You deserve the best.
Thank you for reading.
Namaste.

Tron Glorious SHORT Opportunity | 3-6X (300% BD-Pot.)My dear friends, here I find an amazing chart setup for a glorious SHORT on Tron (TRXUSDT).
This setup becomes stronger and more appealing because of the recent final upward push. These types of moves coming out of nowhere can signal the end, the last hooray, so to speak, of a bullish trend.
There is a very strong bearish divergence since February with both, the MACD and RSI.
These leveraged chart setups are for experts only so I will leave out all of the small details.
If you cannot accept the fact that some trades fail, then this might not be for you. Grown ups and all sort of intelligent, mature people; adults, clearly know and understand that there is risk involved in all types of undertakings.
We are doing higher lev. but publicly we err on the low side.
I hope that you find this information useful.
Remember that leveraged trading is high risk and recommended only for experts. Mistakes can lead to full liquidation of your position and money lost. Even doing things correctly can lead to losses and this is normal when trading or in any venture in life.
Trading tend to produce many winning as well as many losing trades. It doesn't matter the result of a single trade or even a trading session or period, what matters is the end result.
Only non-traders would become really excited and insulting just because a failed chart setup/analysis. Decent human beings understand that sometimes things don't go our way. All the greatest traders in the world are aware that the true, real, big profits are earned in just a few simple trades. One can make many mistakes, it can be trading or even in life, and still end up a success.
This is not financial advice.
Patience is key.
Perseverance, a good mental attitude and determination are needed for long- and short-term success.
You are divine and you are allowed to make mistakes. There is nothing wrong with it and it only reflects your human nature.
We learn from those mistakes to grow... If we fail, we can back bigger, better and stronger for more.
A winner is the person that never gives up.
Namaste.

TRX/USDT - Potential Short Setup🔍 TRX/USDT - Potential Short Setup 📉
Timeframe: 4H
Current Price: 0.1662 USDT
Trade Type: Short
Chart Analysis: As we analyze the TRX/USDT chart, we can observe a developing ascending wedge pattern. The price has been moving upwards, testing the upper trendline, which suggests a potential reversal.
Resistance Level: The recent high at around 0.1670 has acted as a key resistance, where we see price stalling.
Support Level: A strong support area is visible around 0.1650. If this level breaks, we could see a sharper decline.
Trade Setup:
Entry Point: Consider entering short near the resistance level (0.1670).
Stop Loss: Set above the recent high, around 0.1680 to manage risk.
Take Profit: Targeting the support level at 0.1600 to secure profits as we anticipate a pullback.
Volume Analysis:
Notice the increase in volume during the recent price action, which typically supports a potential reversal.
Conclusion: The confluence of the ascending wedge and resistance level presents a favorable short opportunity. As always, ensure to manage your risk appropriately.
Happy Trading!
TRON Partners With Chainlink to Strengthen Its DeFi EcosystemTRON ( AMEX:TRX ) has made a strategic move by joining forces with Chainlink SCALE, effectively making Chainlink Data Feeds the official oracle provider for TRON’s decentralized finance (DeFi) ecosystem. This collaboration marks a significant upgrade to TRON’s blockchain infrastructure, introducing high-quality and decentralized oracle solutions to TRON’s $6.5 billion total value locked (TVL) in DeFi.
TRON DAO Partners with Chainlink SCALE
In a strategic shift, TRON DAO recently announced its partnership with Chainlink, one of the most recognized decentralized computing platforms globally. The integration enables TRON to harness Chainlink’s industry-leading oracles, which will replace WINkLink as the primary oracle solution for TRON's ecosystem. With Chainlink Data Feeds securing more than $6.5 billion in TVL within TRON’s DeFi applications—such as JustLend and JustStable—the partnership promises to enhance security, precision, and reliability in TRON’s DeFi sector.
According to TRON’s founder, Justin Sun, joining Chainlink SCALE will ensure that TRON’s DeFi environment has dependable data, a foundational necessity for the expansion of DeFi applications on the network. This new system allows developers on TRON to access high-quality pricing and market data, contributing to a more robust and scalable decentralized economy.
Driving the Next Generation of DeFi on TRON
The adoption of Chainlink Data Feeds on TRON means more than just a technical upgrade. It represents a pathway to expand TRON’s ecosystem while offering enhanced stability, increased scalability, and reduced operational costs for early-stage DeFi applications. Chainlink SCALE introduces a model where TRON initially covers certain gas fees for using Chainlink’s oracles, fostering DeFi growth until the ecosystem matures and user fees can sustain these costs independently.
Thodoris Karakostas, head of blockchain partnerships at Chainlink Labs, voiced his enthusiasm, noting that Chainlink’s high security and reliable on-chain market data provide TRON developers with the tools needed to create the next generation of DeFi applications. This integration, he emphasized, will bolster TRON’s foundation for a decentralized internet—a vision at the core of TRON DAO’s mission.
TRON’s Commitment to Growth and Innovation
In addition to the Chainlink partnership, Justin Sun recently commented on TRON's growing ecosystem and the anticipated rise of memecoins on the platform. He highlighted the community’s role in supporting these developments and expressed confidence in a new growth phase if AMEX:TRX surpasses its previous peak, potentially triggering a wave of FOMO-driven interest in TRON’s DeFi and memecoin markets.
This commitment to innovation signals a brighter future for TRON as a hub of decentralized finance, and Chainlink’s proven track record in supporting high-volume transactions and delivering reliable data positions TRON advantageously.
Technical Analysis
Currently, AMEX:TRX is trading within an overbought channel with an RSI of 77, reflecting its strong demand following the Chainlink partnership announcement. This movement aligns with previous trends observed in AMEX:TRX ’s price behavior, where periods of bearish momentum were often followed by bullish reversals. This pattern indicates TRX’s resilience and suggests potential for sustained price growth, especially with heightened interest from institutional investors and developers exploring TRON’s DeFi space.
From a technical standpoint, AMEX:TRX offers a relatively stable investment opportunity, appealing to traders looking for a balance between growth and moderate risk. The blockchain’s notable transaction speed and scalability, combined with its new oracle integration, are factors that solidify its position as one of the most secure and reliable assets within the DeFi landscape.
The Strategic Implications for Investors
With Chainlink Data Feeds now part of TRON’s foundational infrastructure, the TRON network is positioned to enhance its appeal for DeFi developers and investors alike. The partnership not only promises to make TRON’s DeFi ecosystem more resilient and scalable but also strengthens its ecosystem’s security—vital as TRON seeks to decentralize the internet through blockchain technology and decentralized applications (dApps).
The long-term implications are clear: TRON’s partnership with Chainlink represents a new era for its DeFi ecosystem. As the TRON DAO continues to expand, AMEX:TRX stands poised to benefit from increased market confidence and user adoption. For investors, this development presents an attractive opportunity to capitalize on TRON’s expanding ecosystem and DeFi potential.
In summary, the TRON-Chainlink collaboration marks a transformative milestone in TRON’s roadmap. With enhanced infrastructure, reduced operational costs, and a renewed commitment to scalability, AMEX:TRX solidifies its role as a key player in the decentralized finance sector. For investors, TRON’s commitment to innovation and growth signals a robust opportunity, particularly in the evolving DeFi space.

TRONUSDT CHARTLooks like TRON is aiming to grab the liquidity on the highlighted region. But the momentum is not strong enough so we may see a correction after a new ATH
