spot TRXIn the crypto market, after each liquidity and receiving it
Spot buying becomes very important. You can buy in two stages of the current price and in the specified prices
TRXUST trade ideas

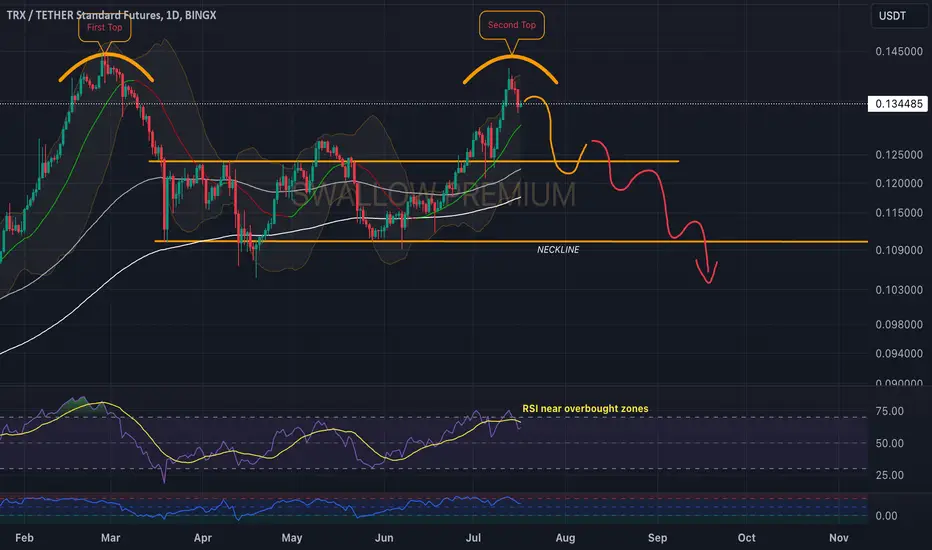
Tron (TRX): Possible Zone of Rejection!Tron might see some kind of downward movement here after getting that nice small rejection from the second top zone.
As of now, we are expecting a further movement to lower zones but we might see some struggle near 200 EMA (which has been a very strong trend holder so far), so keep an eye on that zone for sure!
Swallow Team
TRX SELL LIMIT Hi dear traders
After the sharpie price movement, the price now needs correction.
We can open short position with capital management.
Let's see what happens
This is not financial advice ( DYOR )
Good luck 👍

Is TRXUSDT About to Skyrocket? Potential Bullish Move Ahead!Yello Paradisers! Have you noticed how #TRXUSDT is following the symmetrical triangle trajectory? This indicates a high probability of a bullish move!
💎TRXUSDT has consistently followed this pattern. Currently, a bullish double bottom pattern is forming at the support zone around $0.11050. If the price sustains its momentum, there's a great chance it will make a bullish move above the supply area.
💎Watch for the price to sustain momentum here for a bullish breakout at support $0.11050. If the price fails to hold momentum and breaks below the ascending support, we anticipate a bullish rebound from the lower support level at $0.10759.
💎Should TRXUSDT break below the strong support at $0.10759, it would invalidate the bullish outlook, leading to a significant price drop.
If you want to be consistently profitable, you need to be extremely patient and always wait only for the best, highest-probability trading opportunities. Stay focused, patient, and disciplined, Paradisers.
MyCryptoParadise
iFeel the success🌴

TRXUSDT.PTRXUSDT.P is in bearish trend
Bearish divergence also shown in RSI.
Potentially printing LLH and LL.
we sell at CMP

TRX TronTron has shown to be a very strong and supported blockchain with clear V shape recovery from out of bear right into bull phase.

TRX → be sure! buy it!hello guys...
I think TRX will be bullish for these reasons:
1- it made a quasimodo pattern!
2- it is on the flip area!
3- It somehow reacted to the bottom line of the channel!
the target will be $0.133 and $0.19.
___________________________
✓✓✓ always do your research.
❒❒❒ If you have any questions, you can write them in the comments below, and I will answer them.
❤︎ ❤︎ ❤︎And please don't forget to support this idea with your likes and comment

Tron Break the Channel boundariesAfter 1 week for respecting the channel boundaries, with the upper boundary acting as resistance and the lower boundary acting as support, The price has recently broken below the lower boundary of the ascending channel, suggesting a potential trend reversal
Target as in the chart

TRX (TRON): Overbought at ResistanceTrade setup : Price is in an Uptrend. It made Higher Lows (see blue trendline) and broke back above 200-day MA ($0.12) to signal trend reversal to uptrend. It's now approaching $0.145 resistance and getting overbought (RSI > 75), hence, we could see some profit taking in this area. Now we look for the right entry opportunity in Uptrend. We wait for price to either 1) break above $0.145 to signal continuation of uptrend, or 2) pull back near $0.12 support for another swing trade entry in Uptrend with +20% upside potential back to $0.145.
Pattern : Price is Overbought at Resistance. This trading strategy finds assets that are overbought (RSI > 70) and are near a resistance area, which means there's a high probability that price will get rejected and pull back near-term. Overbought conditions are typically reached when RSI hits 70 or more. Learn this trading strategy in Lesson 5.
Trend : Short-term trend is Strong Up, Medium-term trend is Strong Up and Long-term trend is Strong Up.
Momentum is Bullish (MACD Line crossed above MACD Signal Line) ABOVE days ago. Price is Overbought currently, based on RSI-14 levels (RSI > 70).
Support and Resistance : Nearest Support Zone is $0.11, then $0.10. Nearest Resistance Zone is $0.145.

TRON Abra purchased Valkyrie’s crypto trustsTrading platform Abra reportedly purchased Valkyrie’s private crypto trusts in May 2024, ahead of a settlement between the crypto trading platform and 25 state financial regulators in the United States.
According to Bloomberg, Abra took over Valkyrie’s Tron
TRXUSD
and Zilliqa trusts, which saw previous sales of $50 million and $21.3 million, respectively. In addition to Tron and Zilliqa, Abra purchased several other unnamed digital asset trusts from Valkyrie.
Marissa Kim, Abra's head of asset management, also told the financial outlet that the trading platform could list the trusts on public exchanges, should market demand grow for the investment vehicles.

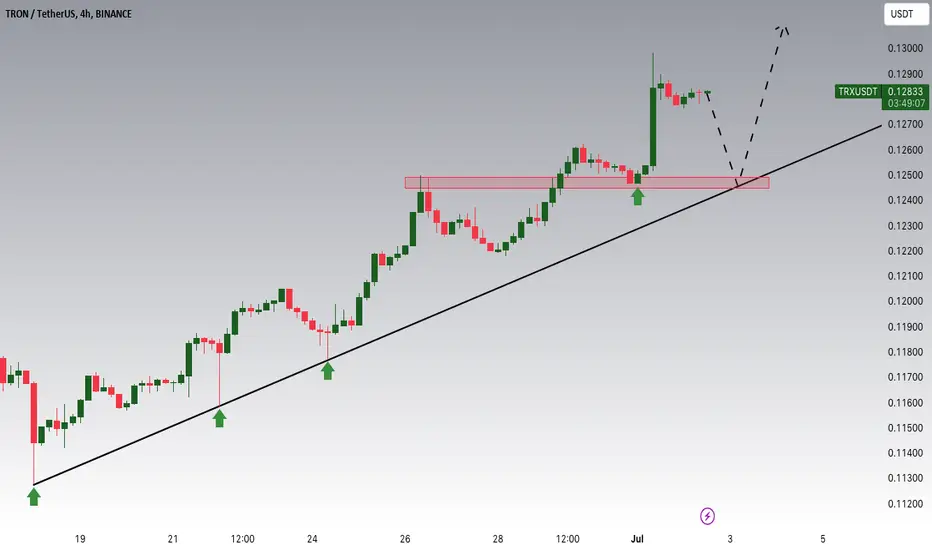
Lingrid | TRXUSDT Bullish MOMENTUM. Long OPPORTUNITYBINANCE:TRXUSDT is moving upward with confidence, consistently making new highs and closing above them. The price has recently broken out and closed above the previous high, and while it hasn't yet reached the upper border of the channel, its bullish momentum is expected to lead to further upside extension. In my view, the market is likely to experience a correction against the trend soon, as it has reached the strong resistance at 0.13000. This correction will present an opportunity to go long. I expect the market to pull back following the level breakout and then continue trending upwards. My target is resistance zone at 0.13450
Traders, if you liked this idea or if you have your own opinion about it, write in the comments. I will be glad 👩💻

TRX - good for shortExpecting double top here. Then correction. The price of TRX is very high right now. There is a lot of room for price drop. Of course I can be wrong here but Im oppening the short right now. Regards.


Tron (TRX): Possible Rejection From Resistance!Tron is back at the major resistance zone in a 4-hour timeframe, where we have been seeing some decent rejections each time we have reached this zone.
We will be waiting out a weakness point here, which would mark the start of movement to 100 EMA.
Swallow Team

Tron 10X SHORT | Huge BD-Pot (400%+)This will be one of the epic shorts of the year... I will save it for my record book.
The details can be seen on the chart; TRXUSDT is about to crash.
➖ A bullish wave that started after a major low November 2022, ended late February 2024.
As we all know, after a strong bullish phase, a strong correction follows.
After a weak bullish phase, a weak correction follows.
Tron grew nicely, very stable, and thus we can expect a very fast, unstable and strong crash.
It should be very steep based on what the chart is showing.
The recovery... Well, we will look at the recovery after the crash so let's focus on the down-wave for now.
We have several positions/entry-points for this pair.
The leverage we use depends on our capital, our trading style, risk tolerance, etc.
We use low-leverage.
👉 We do not recommend leveraged trading. This is for experts only.
We are going "big" on this one because it is really close to the event.
If the event was far off, we would start with 2-3X. As it gets closer, we would continue to add with low lev. As the event gets even closer, we add more but with higher lev. and finally, we hit it with force because there is no going back once the whales decide that, time is up.
The whales have decided... Time's up.
Prepare for the down-wave.
Disclaimer:
This is not financial advice.
I am only sharing my knowledge based on many years of experience.
To be honest, I don't really know what "financial advice" is... I read the charts for your learning and for entertainment purposes only.
If you read these trade ideas that I share, you can learn to read charts and be entertained.
If you lose or make money, that is up to you because there is no money involved in what I do. I am a writer and I thank you for your amazing and continued support.
Now, with that said... Let's see how Tron will move next...
Will my interpretation of the chart be correct or wrong?
I am just translating what is coming from the chart.
The chart is saying down... Now we wait; we will see how it goes.
Namaste.

Trx Trx broke the neckline of head & soldier pattern in the 1hrs time frame .
Put the sl below the neckline .
#nfa #dyor
Note - 🚨 May be btc crash due to negative things, be careful

Tron (TRX): Might Fall Hard Soon!We are working with Tron coin in a 4-hour timeframe, where we see an interesting pattern of BOS and a sharp trend.
As we see a good bullish ladder here, we also see some weakness kicking in (by looking at candlestick movement).
We are looking here for that red zone to be reached and then a nice downward movement to occur.
Swallow Team

TRON Breakout And Potential RetraceHey Traders, in today's trading session we are monitroing TRXUSDT for a selling opportunity around 0.12600 zone, TRX was trading in an uptrend and successfully managed to break it out. Currently is in a correction phase in which it is approaching the retrace area at 0.12600 support and resistance area.
Trade safe, Joe.

I Cannot Short This !!! situation+next targets.Hi.
BINANCE:TRXUSDT
TRX is in an ascending triangle which means the price is about to do a good bullish movement. The price can increase as much as the measured price movement ( AB=CD ) .
The break out needed for increasing further has not happened but it should happen pretty soon.
✨Traders, if you liked this idea or have your opinion on it, write in the comments, We will be glad.
_ _ _ _ __ _ _ _ _ _ _ _ _ _ _ _ _ _ _ _ _ _ _ _ _ _ _ _ _ _ _ _
✅Thank you, and for more ideas, hit ❤️Like❤️ and 🌟Follow🌟!
⚠️Things can change...
The markets are always changing and even with all these signals, the market changes tend to be strong and fast!!

TRX About To Complete A Bearish BAT PatternTRX About To Complete A Bearish BAT Pattern
On the daily chart, TRX is rising and indicates the possibility of completing a Bearish Harmonic BAT Pattern.
Considering that the price is about to test all-time highs again, the chances that TRX price can decline once the pattern will be completed.
📺You may watch the video for further details📺
Thank you and Good Luck!
❤️PS: Please support with a like or comment if you find this analysis useful for your trading day❤️

Is #TRXUSDT Set for a Bullish Breakout? Don’t Miss This Key MoveYello, Paradisers! Have you been tracking #TRXUSDT lately? It’s showing some strong signals that could lead to a major bullish continuation. Let’s dive into the details!
💎After a careful analysis of #TRON's price action, we’ve observed a promising pattern. For a long time, NASDAQ:TRON has been adhering to a descending trendline. Recently, it has successfully retested this descending resistance, indicating a potential bullish move. If #TRX breaks above the $0.11806 resistance and sustains its momentum, we could see a significant bullish continuation.
💎Due to previous strong bearish pressure, there’s an imbalance in the price. It’s likely that the price might revisit this level to fill the imbalance. If #TRX fails to initiate an upward movement from the retest level, we should look for a bullish rebound from the lower support at $0.11507. However, if the price breaks below the $0.11507 support, this could invalidate the bullish setup and lead to further declines.
Stay disciplined and focused on your trading strategy. If you master these principles, you will already be ahead of most traders.
MyCryptoParadise
iFeel the success🌴

Tron is approaching a significant Support areaHey Traders, in today's trading session we are monitoring TRXUSDT for a buying opportunity around 0.12500 zone, Tron is trading in an uptrend and currently is in a correction phase in which it is approaching the trend at 0.12500 support and resistance area.
Trade safe, Joe.
TRXUSDT Price UpdateHello everyone, I’m Cryptorphic.
For the past seven years, I’ve been sharing insightful charts and analysis.
Follow me for:
~ Unbiased analyses on trending altcoins.
~ Identifying altcoins with 10x-50x potential.
~ Futures trade setups.
~ Daily updates on Bitcoin and Ethereum.
~ High time frame (HTF) market bottom and top calls.
~ Short-term market movements.
~ Charts supported by critical fundamentals.
Now, let’s dive into this chart analysis:
TRX broke above the symmetrical triangle pattern 5 days ago and has not yet been retested. The $0.1274 level holds strong resistance for TRX.
For a successful rally toward Resistance 2 ($0.1431), TRX must break above Resistance 1. Failing to do so would likely result in a rejection down to the lower support level at $0.1148.
The range between $0.1148 and $0.1185 can be considered the best entry for TRX.
Invalidation Point: A breakdown and close below the lower supporting trendline.
DYOR. NFA.
Please hit the like button to support my content and share your thoughts in the comment section. Feel free to request any chart analysis you’d like to see!
Thank you!
#PEACE
