trxusdtPay attention that the condition of this movement is that the trend line is broken with good strength and the price stabilizes above the first pink area, that is, it closes in the daily time or a few candles in the four-hour time.
TRXUST trade ideas

TRXUSD ❕ liquidity zoneTron is trading in the liquidity zone.
Price is testing 50EMA as support (4H TF)
I expect price to rise while holding in the liquidity zone.


TRX | DECRYPTERS | TRON | JUSTIN SUN HI people welcome to Team Decrypters
TRX is the native cryptocurrency of the TRON network and is used to facilitate transactions on the network, as well as to pay for the creation and execution of smart contracts.
we are expecting move to the upsdie Soon in tron so we are buyers in TRX

TRXUSDT using trigger on 8hr and 20 min Trigger .62704 Was testing my trigger out on a 8hr and came across this crypto,. The move is beautiful and is ready to pop. Lots of pop potential. Still waiting on the Volume to spike above avg to set off my trigger. If it does it could be a nice run. I also Lined this up with the same trigger on a 20 min.... fractal large and small time frames lining up what else could you want.
by iCantw84it
01/20/23

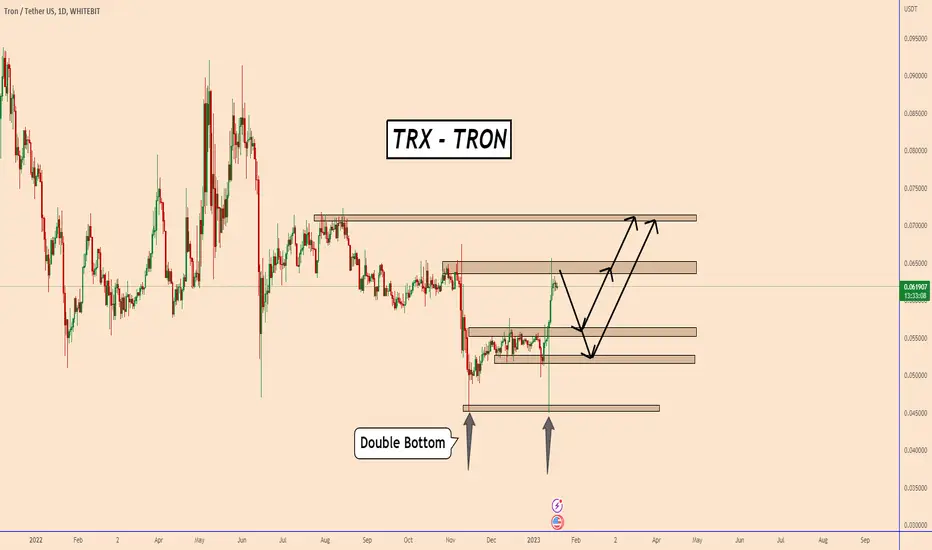
TRXUSDT Ready For Takeoff!TRXUSDT Technical analysis update
If the price breaks above the resistance line then we can expect a good up move in Tron.
Buy zone: Below $0.062
Stop loss: $0.054
Take Profit 1: $0.068
Take Profit 2: $0.077
Take Profit 3: $0.092
Take Profit 4: $0.115
Always keep stop loss
Thanks
Hexa

TRXUSD ❕ correctionTRX trades under liquidity.
Trading volumes remain low.
Price in overbought RSI zone (1H and 30m TFs)
Asset tests 200EMA as resistance (30m TF)
I expect the continuation of the correction after fixing under the liquidity zone.

TRXUSDT Analysis -20 JANUARY 2023Hello Guys, Today's Analysis is on the TRXUSDT Symbol in a 1H Time frame, I Hope it Will be Useful for You, Don't Forget to Like, Follow, Comment

TRXUSDT - Short by Supertrend, ADX & MA 1/20/20231. ADX INDICATOR: 1h & 4h timeframe have a strong strength for open trade.
- ADX smoothing: 14.
- DI length: 14.
- ADX STRONG > 25.
2. SUPERTREND INDICATOR:
- Short trend when closes candle is below the red line.
3. MOVING AVERAGE INDICATOR:50
- Short trend when closes candle is below MA line.
4. - SELL/SHORT: reject to Supertrend at current timeframe.

TRX: Overbought at ResistanceTRON (TRX) technical analysis:
Trade setup : Price rebounded from $0.05 support and rallied hard above 200-day moving average, down trendline, and reached $0.065 horizontal resistance. However, it’s overbought (RSI > 70) and likely to pull back before resuming uptrend.
Trend : Uptrend on Short- and Medium-Term basis and Downtrend on Long-Term basis.
Momentum is Bullish ( MACD Line is above MACD Signal Line and RSI is above 55).
Support and Resistance : Nearest Support Zone is $0.058 (previous resistance), then $0.050. The nearest Resistance Zone is $0.065, then $0.070.

TRON: Price Should Begin The Correction SoonTRON: Price Should Begin The Correction Soon
As we can see the price stopped the bullish move for the time being
after the crypto optimism.
Was this move too optimistic?
it could be too optimistic, however, the market wants to trade as it was
in silence for a long period of time.
However, testing these areas at a time when the crypto market is not solid
yet is a bit risky for us to anticipate the next bullish wave.
We have to wait again...what comes fast...most of the time goes away faster.
Thank you and Good Luck!
TRXUdttrx break Triangle and now can start rally but you need watch BTC First
i set after new move targets and supports
GL
EntryPoint:
0.06149
0.05864
0.05562
Supports:
0.05129
0.04726
0.04210
Resisttance:
0.06290
Targets:
0.06750
0.07467
0.08485
mid time:
0.09986
0.10872
0.12277
HODL:
0.15433
0.18162
0.22346

#TRXUSDT#LQRUSDT#BITCOIN#LaqiraProtocol Break the EMA200Price break the EMA 200 and now support for the price
minor support $0.06
important resistance $0.07

Who wants to 10X their capital with TRX ?hello guys...
as you can see on the TRX chart, it has formed a descending triangle on an upward trend, 3 times touched the bottom line and 4 times the top line touched, wining upward movement so far :))
but be patient until the top line breaks up after that you can get a long position until $0.29 and if you are so greedy hold it until $0.69.
if the price breaks up the bottom line, get a short position.
note: if the price breaks up from the end of the pattern makes it invalid.
always do your own research.
If you have any questions, you can write them in the comments below, and I will answer them.
And please don't forget to support this idea with your likes and comments.


Tron is a low-risk investment, but better than gold and TetherI think that Tron is one of the least risky currencies in the market, which maintained its stronghold and did not experience a large drop, and now I believe that in the weekly analysis, Tron can be considered as a safe and more profitable investment than gold and gold.
For the medium term and of course the long term
Good luck

TRX/USDT-1W-BINANCEThis is not a financial advice. Always do your own research and always put stoploss in your trade (SL) :) If you want more detailed info
how to study and read charts or just need help with some coin, just write to me here a comment, i will try to answer to everybody...
i can help you :) all for free, don't worry, BE HAPPY!

TRX - Tron is Ready to Breakout of a 2 Year Bullish Pennant!You will be hard-pressed to find a more bullish USD alt chart out there. Tron has a beautiful bullish continuation structure here on the daily that has been forming since the COVID crash in March of 2020. This massive pennant the price action has bouncing within is almost 2 years in the making. I think the breakout here could be huge. The price action is currently repeating the same exit pattern it had back in 2021. If Tron breaks out, buckle your seat belts and HODL on tight! I'm long here.

TRX/USDT :: which one ?TRX/USDT :::
The price may be able to reach the 0.06 range again, but in which direction will it break the triangle ?!

TRX is about to crash like LUNA !I think TRX is about to send to zero. Currently there is start of fud on huobi on twitter. Huobi token isn't listed almost nowhere so can't really be shorted, but : Huobi ceo, Justin Sun, is also ceo of TRX. TRX's stablecoin USDD is depeged for +2 months and TRX price action is suggesting a big move soon. I think this will make us a new luna very soon. I was watching this for a while, just waited a trigger event and I think it's soon

TRX/USDT Might go for breakdownHey traders ✌️
Next one we would like to talk about is going to be TRX/USDT pair. Well we are looking this one on 1hr scale with bearish outcome as we are waiting for that breakdown from this small trend that has formed. So let's wait out for that CPI data to be released an see what we will get here
If you like ideas provided by our team you can show us your support by liking and commenting.
Yours Sincerely,
Swallow Team 🔱
Disclamer:
We are not financial advisors. The content that we share on this website are for educational purposes and are our own personal opinions.

Tron TRX chances of a sell-offTRX is a collateral in the stablecoin USDD, that keeps depegging!!!
This week I predict another selloff in the stock and crypto market after the CPI report on January 12.
My price targets for Tron TRX are:
TRX/USDT short
Entry Range: $0.052 - 0.055
Price Target 1: $0.049
Price Target 2: $0.045
Price Target 3: $0.030
Stop Loss: $0.062

TRXUSDTLet's see if we backtest the 0.04950 area down to the 0.04790 area.
TRXUSDT Futures Setup:
Entry: 0.05190-0.05170 ✅
TP1: 0.04970-0.04920
TP2: 0.04790-0.04740
TP3: Open TP
Note: Always use SL to avoid Liquidation.
Disclaimer: Trade at your own risk.
