TRX : Price Just Tested A Very Strong Weekly Support ZoneTRX: Price Just Tested A Very Strong Weekly Support Zone
After the price moved down like all the cryptocurrencies now we can see a small
pause from the previous week.
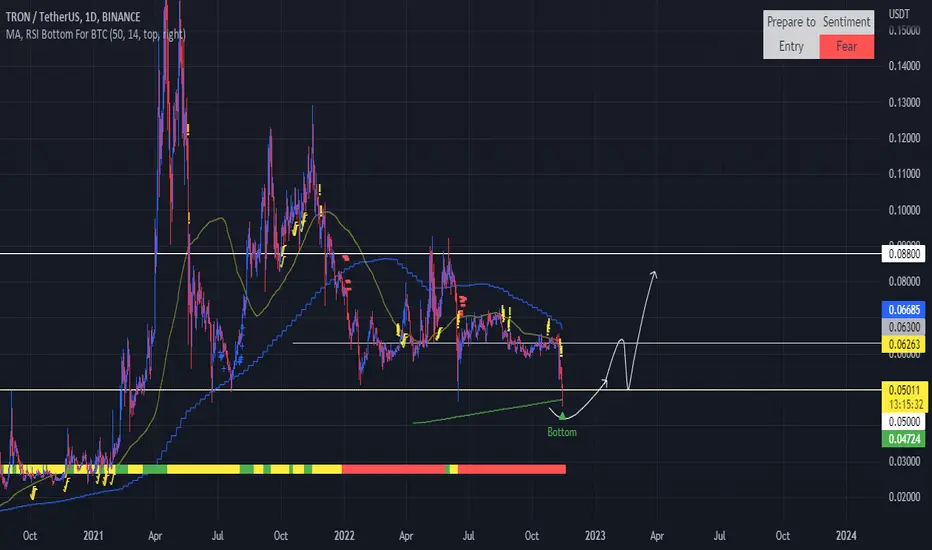
The support area near 0.046500 is pushing the price up again.
I am looking for the price to rise further during the coming weeks considering
that 0.046500 didn't let the price decrease more.
Targets:
🎯 0.058441
🎯 0.065252
🎯 0.070451
Thank you and Good Luck!
TRXUST trade ideas

TRXUSD LONGPossible upward movement of the pair. Price is currently in a lower bound trading zone with significant volume making stops and holding rejections at the bottom of the price near the 55 period EMA , essential in my strategy for analysis of potential trend continuations. Indicators like Squeeze Momentum and the MACD histogram have turned bullish after their red valley; accompanied by the loss of bearish strength indicated by the ADX rebounding towards the EMA . The MACD lines would be giving a possible buy signal soon. I think you could go looking for the previous high price zone when you see indications of a bounce move higher on the 4-hour chart. In 1 hour timeframes we see that it has broken the bearish structure, forming higher lows than the previous ones.
If you are going to take my opinion into account, please respect the projection time, this is extremely important. If it is not fulfilled in the foreseen time and makes a range, it will be better to close the operation in case it is possible.

TRX/USDTTRX/USDT
Finally the 0.06 support was lost and now it can fall more strongly.
The targets are clear in the picture.

double X vortexgreat balls of crossing vortexes .
MA cross isnt accurate by itself and tends to flip flop too much untill the asset makes a price break. The vo4tex just vap8day4s it that way not to buy too soon or sell too soon and go back the other way.
Tue two vortexes idea is so you can input two separate time variables. Which seems to makeit pretty dang accurate.Double vortexes along with the MA Cross seems to be about 95% accurate and the other 5% it adjists for it pretty quickly. The other 5% is only when trading pair volume is low or large gap between buy and sell trades.. i have tested it and used it and fine tuned it over the past 8 months for my manual trades. It also does well on any timeframe with my settings. I just need to now make it live and automated.
Its very simple to use and read(if your not color blind, that is)
Just pick and timeframe depending on how long you plan on sitting
there or how often you plan on checking it to make a trade every min, 5,15,30min,1hr,2,4,8hr,1day,or once a week.,.
Then just wait for the green lines to cross the red lines
Dont make a trade untill both charts
green lines cross up above red lines to buy.
Or
both green lines cross down below red lines to sell.
(advice: dont make trade when vortex lines at thier peak.unless you have some inside info or a good hunch to do otherwise.)
Good luck
if anyone out there like to use this, and can possibly help me.I would be extremely grateful.
I would like to figure out how to make visible cross when green line on one vortex crosses the red line of the other vortex.
After that i could use some help making that into an alert when both charrts green lines have crossed up and only after both have crossed the red lines down as the other alert.
Thank you for reading ,Enjoy ,;^j d°_•°b ¶<% ¶^& 8>D ({|})

TRXUSDT Bullish short-term but still limited.*** ***
For this particular analysis on Tron we are using the TRXUSDT symbol on the OKX exchange .
*** ***
The idea is on the 1D time-frame where TRX has been trading within the Support Zone of the Bear Cycle (0.04460 - 0.05100) ever since the FTX crash. On the bright side it appears that it has found Support and since June 22, every time (4 times in total) it has done so within this Zone, it rebounded aggressively. The obvious limitation is the Lower Highs trend-line that started on the November 15 2021 High, which even though it broke on Nov 05, the price quickly fell below it again, remaining the strongest Resistance right now. Interestingly enough, this is where the 1D MA50 (blue trend-line) is at the moment.
The 1D MA200 (orange trend-line) has been intact since August 18 and after that, the key to a strong rally is the 0.07250 Symmetrical Resistance which has multiple rejections under its belt since January 17 2022.
A bullish signal is the fact that the 1D RSI hit and rebounded within its 23.50 - 30.00 Support Zone, which every time it got hit, initiated a strong rally. As a result, even though a short-term rebound is possible if the market conditions help, it is still limited to the 1D MA50 and the November 15 Lower Highs trend-line. In order for us to call a confirmed buy extension on TRXUSDT , we want to see a candle closing above the 1D MA200 or preferably the 0.07250 Symmetrical Resistance, which can then target with high probabilities the upper Fibonacci levels towards the 0.0930 Resistance that was previously a Double Top (May 09 and June 01 2022).
-------------------------------------------------------------------------------
** Please LIKE 👍, SUBSCRIBE ✅, SHARE 🙌 and COMMENT ✍ if you enjoy this idea! Also share your ideas and charts in the comments section below! This is best way to keep it relevant, support me, keep the content here free and allow the idea to reach as many people as possible. **
-------------------------------------------------------------------------------
You may also TELL ME 🙋♀️🙋♂️ in the comments section which symbol you want me to analyze next and on which time-frame. The one with the most posts will be published tomorrow! 👏🎁
-------------------------------------------------------------------------------
👇 👇 👇 👇 👇 👇
💸💸💸💸💸💸
👇 👇 👇 👇 👇 👇

🔥 TRX: 1.5 Year Bearish Triangle For Patient TradersOver the course of the last ~1.5 years, TRX has been forming a massive bearish triangle pattern. Bearish triangles classically break bearish, so that's what we're going to look at today.
Be aware that this is a trade for the patient trader. Wait for the break of the lowest purple support before scouting an entry.
Since the support has been holding for so long, a break of said support can lead to a massive sell-off because of all the stop-losses below it. Targets in blue.

TRXUSD ❕ trying to break a liquidity zonePrice and RSI formed a hidden bullish divergence (4H TF)
RSI chart is in a buy zone (1H and 30m TFs)
TRX has broken up 200EMA at 30m Timeframe.
I expect price growth after the asset fixes above the liquidity zone.

Tron TRX - 51% crash very soon!
It's a great opportunity to short TRX on the futures market. You can short TRX on almost all exchanges. So it's very positive!
The technical analysis of Tron looks very bearish. Descending triangles are likely to breakdown with a 60% pullback rate (retest) before continuing lower.
The uptrend from 2020 to 2021 looks like a three-wave structure. It's not looking good to me. It's not going to be a surprise if TRX crashes even harder than 51%. I want to see a strong impulse wave, but this is not an impulse wave.
This chart indicates that more blood is coming for the crypto market. It's possible!
I expected a strong reaction from the POC of the previous triangle and also from the 0.618 LOG FIB. These levels are ideal for profit taking or a short-term long position.
If you hold TRX, then it can be your last chance to sell it for a pretty good price. Even a 90 percent crash is possible, believe it or not.
But I have to admit that TRX is holding its value pretty well. Unfortunately, the price is compressed in this triangle, and a huge, massive red dildo can be printed very soon!
For more ideas, hit "Like" and "Follow"!


TrxUsdtTron rdy for break Triangle
can break this triangle big move can happen
remember Tron cant pump like others but remember this blockchain usfull
all watch ETH but u know more transaction on this blockchain after more years and low fee
so this can save
u can sy this cant reech u but cant say like luna or FTT destroyed
GL
EntryPoint:
0.04904
0.04348
Supports:
0.03855
0.03249
0.02611
Resistances:
0.05691
0.05765
Targets:
0.06696
0.07558
0.08531
Mid Time:
0.10136
0.12624
HODL:
0.16687
0.19300
0.23792
GL

TRX/USDT for the next few weeksTRX bearish perspective at 1W TF. Good opportunity to short but trade with caution :)

Trading opportunity for TRXUSDTBased on technical factors there is a Long position in :
📊 TRXUSDT
🔵 Long Now 0.05065
🧯 Stop loss 0.04459
🏹 Target 1 0.05725
🏹 Target 2 0.06330
🏹 Target 3 0.07230
💸RISK : 1%
We hope it is profitable for you ❤️
Please support our activity with your likes👍 and comments📝


TRXUSDT Bearish?Pretty bearish right now, but i think this will be a good bottom price for TRX ($0.05)
I'm thinking there will be a deviation below, and then back above $0.05.
First target will be $0.063.
Will CL if clean break below $0.05.
Trade safely.
TRXIdea: The price dropped to the lower border of the descending triangle. Watch for a possible breakout of the lower boundary of the pattern amid negative news around USDD and problems on Huobi wallets

The journey to ATHHi traders good day, TRX is now at the most strongest support on its weekly time frame. I consider this as the beginning towards a new ATH maybe in a few years to come.

TRONmageddon- not much to say, with BTC confirming a downside breakout it is more than likely all alts follow
- unlike some, TRX hasn´t fallen too much so there is still time to position yourself short as the R:R is still favourable, SL slightly above the neckline of the descending triangle makes sense
- looking for at least a 50% drop


TRXUSDT: Price Action Supply and DemandHello friends. According to the Chart of TRXUSDT I expected the price touch again the determined price and so continued downtrend path.

TRON to save the dat for FTX?i suppose that will be enough toxic debt to nuke the price over 50%. whatever the catalyst still will see .03 for trx in the near future and most likely the lower levels before any signs of significant turnaound. ggs

Justin Sun gonna suck these nuts dryTLDR TRX goes down, withdrawals from FTX will only commence via TRX, so that means people sell TRX for USDT on real exchanges which crash prices down 50% ideally and 75% for max pain.

TRX might be the next FTT and LUNA I just noticed that USDD depeg, this doesn't sound good for TRON holders, hence there's every tendency of seeing TRX drop drastically just as FTT. So be on a look out for the breakout before reacting . First stop will be 0.0233 and the second could be 0.013 or below as LUNA did 🤔

TRX. An obvious descending triangle.Usually, when the price falls lower, demand increases, which pushes the price higher. But this does not apply to the descending triangle. Because when the price drops lower, there is no buying pressure. Instead, sellers are willing to sell at even lower prices (which is why we get a series of lower highs). Also below the support level stop orders are grouped by many traders who buy from the support level. The more traders do this, the more stops are formed. And as the market moves from one area of liquidity to another, the price is likely to break through the support level, and when these stops are hit, it will further increase the selling pressure.
