USD/TRY LONG Setup by baris3Nice trick by goverment. They want to put pressure on companies by making them sell their dollars. But this will only postpone the collapse of Lira.
Target is 18+ for USD/TRY pair. This will be 3th wave (elliott). Current correction can not go down more than here 15.80
My target is 21-22 for USD/TRY pair. Fundamentally flawed economy will not persevere.
TRYUSD trade ideas

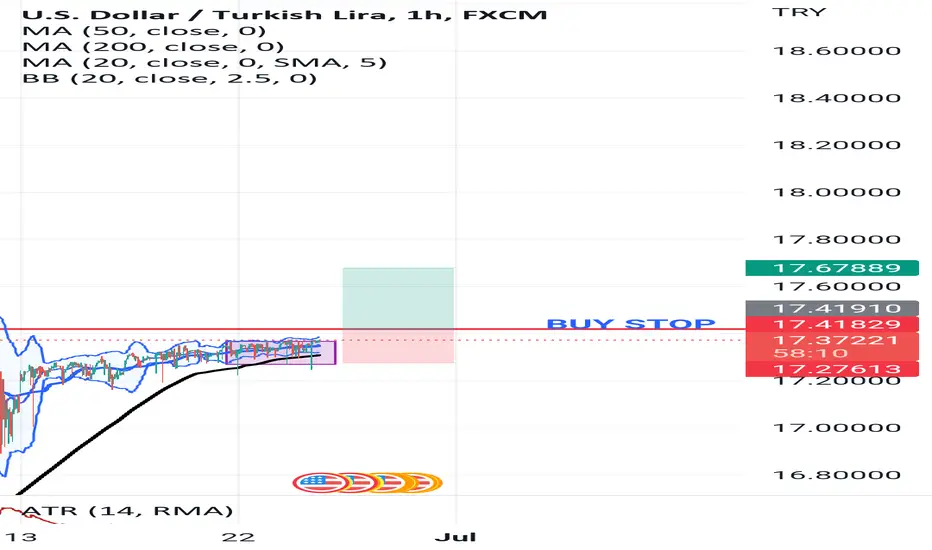
USDTRY buy stop order. There is a volatility contraction on 4H and 1H chart. Im expecting that price will break up soon. Im suggesting to set buy stop order at green line. Please do not copy this trade a do not publish under your name. Im not a signal service but I do my best to make you some money. Check my previous ideas. Wish you good luck.
Jamie Gun2Head - Selling USDTRYTrade Idea: USDTRY
Reasoning: Selling resistance, nice risk reward
Entry Level: 17.3623
Take Profit Level: 17.3012
Stop Loss: 17.3778
Risk/Reward: 3.94:1
Disclaimer – Signal Centre. Please be reminded – you alone are responsible for your trading – both gains and losses. There is a very high degree of risk involved in trading. The technical analysis , like all indicators, strategies, columns, articles and other features accessible on/though this site is for informational purposes only and should not be construed as investment advice by you. Your use of the technical analysis , as would also your use of all mentioned indicators, strategies, columns, articles and all other features, is entirely at your own risk and it is your sole responsibility to evaluate the accuracy, completeness and usefulness (including suitability) of the information. You should assess the risk of any trade with your financial adviser and make your own independent decision(s) regarding any tradable products which may be the subject matter of the technical analysis or any of the said indicators, strategies, columns, articles and all other

Turkish Lira (USDTRY)Economy keeps crashing in the hands of "strong man" Erdogan, who has fired every Head of Turkish Central Bank who tried to stop him fulfill his own Turkish Dream of hyperinflation in which business is no longer possible as the cost of imports and commodities rises daily. Erdogan's genius policy in a world where growth and investment is stalling is to keep slashing interest rates in the hope of stimulating investment in Turkey's economy... oh and getting his loyal supporters to hand out dollar bills in loyal neighbourhoods so that the people can burn them in front of TV cameras.
This country of 85 million has no economic policy at all anymore. It is a total basket case and failed state in the making. Get out!
----------------------------------------------------------------------------------------------------------------------------------------------------------------------
You maniacs! You blew it up! Ah, damn you! God damn you all to hell! --- Taylor

Turkish Bubble, how it formed and why it will keep deflatingThe Turkish Bubble. How it formed and why it will probably keep deflating for years to come.
In short, Turkey was motivated to modernize its economy in the wake of Greece's adoption of the Euro which solved Greece's inflation problem overnight. Turkey proceeded to revalue its currency essentially by removing six zeros from its banknotes. It also made a pledge not to print money but to pursue growth via foreign investment. This took advantage of cheap money in Europe and North America that was eager for medium risk with high reward investment opportunities. The economy grew rapidly with much new construction and many new tech and service industries being developed. Of course as time goes on investments become more risky and less rewarding. This was embodied in the person of Erdogan who steered Turkey away from social and political alignment with Europe and started to pursue unorthodox economic policies based on Islamic doctrine. At the same time, foreign investment in Turkey began to dry up as local businesses began to default on debts. This weakness was seized upon by the market that proceeded to short the Lira until the massive selloff in December 2021, which marked a multi-decade capitulation.
Turkey has now spent all of its foreign reserves propping up its currency. In addition, the Erdogan government has promised to compensate Turkish citizens who decide to keep their savings in Lira. This can only be paid for if the government breaks its promise on issuing bonds and, since they would be essentially worthless right now, only the Turkish central bank will buy them. This is how we print money out of nothing. Brrrrrrrrr
To recap, the Turkish Bubble was made possible by currency manipulation and cheap foreign money. The raising of interests rates in Europe and North America, as well as the printing of money by the Turkish government, means that the bubble cannot be sustained going forwards. It will take a long time, but the inflation of the 1990s will one day return to Turkey.

USD/TRY
In long-term view, the pair is heavily overbought and inflation is very high
It does not mean the market condition can continuously drive it upwards.
TP areas are signed white flags. And supports are black flags.
*Please share your opinion on it, write in the comments. Dont forget some cheers bravo. "
Teşekkürler.

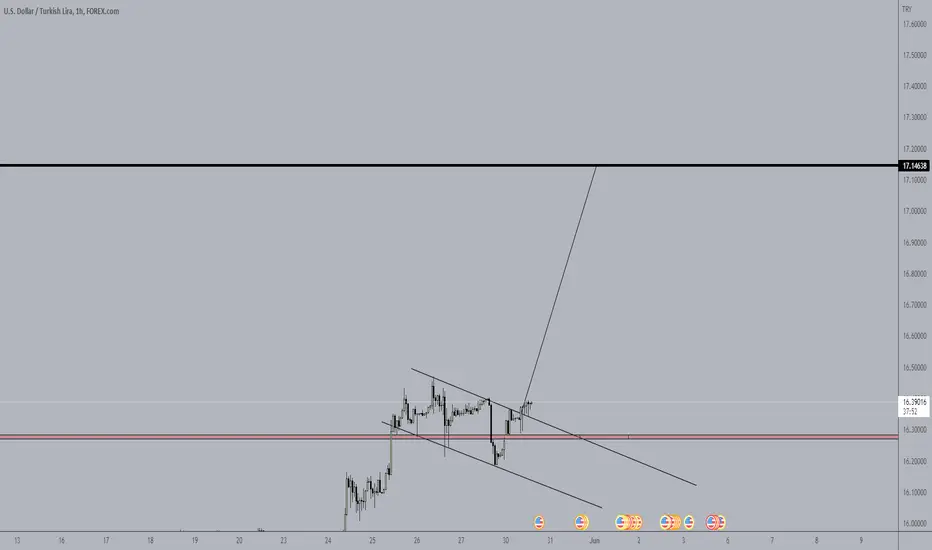
Jamie Gun2Head idea - Selling USDTRY???Trade Idea: Trading the range for USDTRY
Reasoning: Selling at resistance level - targeting support level
Entry Level: 17.2892
Take Profit Level: 17.1847
Stop Loss: 17.3214
Risk/Reward: 3.25:1
Disclaimer – Signal Centre. Please be reminded – you alone are responsible for your trading – both gains and losses. There is a very high degree of risk involved in trading. The technical analysis , like all indicators, strategies, columns, articles and other features accessible on/though this site is for informational purposes only and should not be construed as investment advice by you. Your use of the technical analysis , as would also your use of all mentioned indicators, strategies, columns, articles and all other features, is entirely at your own risk and it is your sole responsibility to evaluate the accuracy, completeness and usefulness (including suitability) of the information. You should assess the risk of any trade with your financial adviser and make your own independent decision(s) regarding any tradable products which may be the subject matter of the technical analysis or any of the said indicators, strategies, columns, articles and all other features.

USDTRY-MT SELL strategyIt is way overdone for all time frames, and especially weekly and monthly chart.
I have not changed my view, but as mentioned many times, the time it will correct may be only 4-9 months time.
The short period coming 1-2 months I suspect we see recover 12.50-12.75, whilst long term 10.50-9.00.
I know this conflicts with many people's ideas, and some comparison I receive, clearly shows that not all are in the market trading. Some have good fundamental idea of the pair, and that is appreciated of course. Technically we will see it correct and the pressure should be relieved. My view is SELL current 17.20-17.50 and add again above 18.50. Very low leverages, and for those in need to cover TRY 6-9 months best to do this gradually now.

USDTRY, Correction then Growth. Update Hello traders and arkadaslarim, Everything is clear on the chart for you like always. So monitor the price's action in the circle. After breakout the resistance zone and fixation, we can buy and for lower risk after pullback.
Good luck.
If you like the idea, do not forget to support with a like and follow me for next analysis :)
Write your comment and opinion below to me

USD/TRY's dramatic intervened drop is stablising around 11.0000The USD/TRY pair extended its dramatic turnaround from a record high touched earlier this week and continued losing ground through the mid-European session on Thursday. This marked the fourth successive day of a negative move and dragged spot prices to a six-week low, around the 10.20 region in the last hour. The pair, however, found some support at lower levels and quickly bounced back above the 11.00 round-figure mark.
The Turkish lira's recent strong gains came after the government announced extraordinary measures on Monday, which include the introduction of a new program to protect savings from currency fluctuations. Adding to this, President Recep Tayyip Erdogan said the government and the Central Bank of the Republic of Turkey (CBRT) would guarantee certain local currency deposits against losses from FX depreciation.
Erdoğan also reassured that citizens would not have to convert lira savings into foreign exchange due to volatility and emphasized that Turkey is committed to the free market economy. The President further underlined that Turkey is adamant about its new economic model and stuck to his unconventional policy to use lower interest rates to combat inflation.
Nevertheless, the lira remains on track to record its best weekly gains ever, of around 40% and seemed rather unaffected by a modest pickup in US dollar demand. That said, extremely overstretched conditions prompted some short-covering amid relatively thin liquidity ahead of the year-end holiday season.
- USD/TRY remained under intense selling pressure for the fourth successive day on Thursday.
- The recent measures announced by the Turkish government continued lending support to the lira.
- Extremely overstretched conditions prompted intraday short-covering move amid thin liquidity.
>Dollar Edges Lower as Confidence Over Omicron Supports High Yielders
The dollar traded marginally lower early in the European session Thursday, near a one-week low, amid growing optimism for the global economic outlook despite the surge of Omicron-variant Covid cases.
At 2:50 AM ET (0750 GMT), the Dollar Index, which tracks the greenback against a basket of six other currencies, fell 0.1% to 96.043, having earlier fallen to 96.018 for the first time since Dec. 17.
USD/JPY rose 0.1% to 114.19, with the yen, another safe haven, slipping despite Japan upgrading earlier Thursday its growth projections for the next fiscal year starting in April.
The growth projection was raised to 3.2% for fiscal 2022 from a forecast 2.2% real GDP growth seen at a mid-year review in July. This would be the fastest growth since fiscal 2010.
EUR/USD rose 0.1% to 1.1338, adding to its overnight advance, GBP/USD climbed 0.1% to 1.3354, while the risk-sensitive AUD/USD rose 0.1% to 0.7218, after Wednesday’s surge of almost 1%.
Risk sentiment has improved as the week has progressed, helped by a couple of studies suggesting that patients with the Omicron variant face a lower risk of hospitalization and severe disease compared with the Delta variant, the previously dominant strain.
Also helping was the release of positive U.S. economic data on Wednesday, with GDP growing 2.3% quarter-on-quarter in the third quarter and existing home sales rising 1.9% in November. However, it was U.S. consumer confidence improving more than expected in December despite the resurgence in Covid-19 infections which had the biggest impact.
“Expectations about short-term growth prospects improved, setting the stage for continued growth in early 2022. The proportion of consumers planning to purchase homes, automobiles, major appliances, and vacations over the next six months all increased,” said a Conference Board spokeswoman.
The economic data slate is packed Thursday, including initial jobless claims, new home sales, durable goods orders, and the PCE price index. It also includes personal income and spending, as well as the University of Michigan consumer sentiment and expectations indexes.
Elsewhere, USD/TRY dropped 1.8% to 11.8270, with the lira continuing to rebound after President Recep Tayyip Erdogan said Wednesday that measures to protect the Turkish lira bank deposits from depreciation amid a currency crisis have achieved their goal.
That said, the currency is still about 40% down so far this year after a series of interest rate cuts, engineered by the president, despite inflation soaring over 20%.
Elsewhere, the Russian ruble rose to its highest level in over a month ahead of President Vladimir Putin's annual press conference, against a backdrop of continued tension on the Ukrainian border, where over 100,000 Russian troops have massed. Analysts will want to see whether Putin repeats to a more general audience the hawkish comments that he made to his defense chiefs earlier in the week.
>USD/TRY's dramatic intervened drop is stablising around 12.0000
USD/TRY is stabilising following three consecutive days of falling prices that have wiped out the November rally. At the time of writing, USD/TRY is trading at 12.0354 and in between an 11.9655 and 12.0828 range so far.
President Recep Tayyip Erdoğan ordered the Turkish central bank to start reducing interest rates earlier in the year which led to the currency falling around 50% since September. Inflation rose 21.31% in November compared to the same period last year. On a monthly basis inflation rose 3.51% compared to October. The president insisted on four interest rate cuts over the four months despite surging inflation and the market responded in kind.
However, on Monday 20 December the TRY weakened significantly when President Erdoğan said in a televised speech that he will continue cutting interest rates after rates were cut by 100 basis points. This took the rate to -6%, the lowest in the world and the TRY to the weakest level since the 1980s. However, there was a dramatic comeback in the currency when the government announced a series of measures to support the currency on Monday.
Amongst other measures, including direct FX forward contracts from the central bank for companies heading overseas business, Erdoğan explained that the government will protect lira deposits by making up for the losses incurred. TRY has rallied, and the plan is working, so far. However, if the president is intent on cutting rates in an inflationary environment, then the lira will be left vulnerable to further weakness.
Technicals are futile under such fundamental drivers and wild price action as this, but nevertheless, if there is to be stability, then the range are between 11.0000 - 14.0000 .
- BUYING PRESSURE PRICE 10.2000 - 11.3000
- Our option for #USDTRY is TO WAIT FOR BUYERS DECISION PRICE ACTION WITH A CONFIRMATION.
- Economy BUBBLE has happened or is close to !!
- The outlook and the overall trend for the pair is BULLISH.
Prev. Close 12.0373
Bid 11.3001
Day's Range 10.2329 - 12.3582
Open 16.4798
Ask 11.494752
wk Range 6.8882 - 18.36741
Year Change 57.36%
It’s important to keep in mind that cryptocurrency markets are extremely volatile, making it difficult to accurately predict what a coin’s price will be in a few hours or a few days and even harder to give long-term estimates. As such, analysts and online forecasting sites can get their predictions wrong. We recommend that you always do your own research and consider the latest market trends, news, technical and fundamental analysis , and expert opinion before making any investment decisions. Be patient and look long term wisely and never invest more than you can afford to lose.
Trading & Investing both are the master of RISK.
Please comment, like and follow if it was helpful for you.
Thank you for your time.
Have a profitable day.
| Review and analysis by Samadi.Finance |

USD/TRY Targeting above 20.0000 | Q2 Q3Economists look for further sharp Turkish lira depreciation. They forecast the USD/TRY above the 20.00 level in the second quarter of the year.
𝐓𝐡𝐞 𝐧𝐢𝐠𝐡𝐭𝐦𝐚𝐫𝐞 𝐚𝐟𝐭𝐞𝐫 𝐂𝐡𝐫𝐢𝐬𝐭𝐦𝐚𝐬:
“We think that USD/TRY will rise to 16.25 by end-Q1 and breach well over 20 in Q2. However, this is when we expect the CBRT to start tightening, which should help bring the pair down to around 19 by end-Q2.”
“𝐓𝐡𝐞 𝐥𝐢𝐫𝐚 𝐜𝐚𝐧 𝐜𝐨𝐧𝐭𝐢𝐧𝐮𝐞 𝐚𝐩𝐩𝐫𝐞𝐜𝐢𝐚𝐭𝐢𝐧𝐠 𝐢𝐧 𝐚 𝐠𝐫𝐚𝐝𝐮𝐚𝐥 𝐦𝐚𝐧𝐧𝐞𝐫 𝐭𝐡𝐫𝐨𝐮𝐠𝐡𝐨𝐮𝐭 𝐭𝐡𝐞 𝐫𝐞𝐬𝐭 𝐨𝐟 𝟐𝟎𝟐𝟐 𝐚𝐬𝐬𝐮𝐦𝐢𝐧𝐠 𝐧𝐨 𝐟𝐮𝐫𝐭𝐡𝐞𝐫 𝐩𝐨𝐥𝐢𝐜𝐲 𝐦𝐢𝐬𝐬𝐭𝐞𝐩𝐬.”
“𝐅𝐫𝐨𝐦 𝟐𝟎𝟐𝟑 𝐨𝐧𝐰𝐚𝐫𝐝𝐬, 𝐡𝐨𝐰𝐞𝐯𝐞𝐫, 𝐩𝐨𝐥𝐢𝐜𝐲 𝐦𝐢𝐬𝐭𝐚𝐤𝐞𝐬 𝐚𝐫𝐞 𝐲𝐞𝐭 𝐚𝐠𝐚𝐢𝐧 𝐥𝐢𝐤𝐞𝐥𝐲 𝐭𝐨 𝐬𝐞𝐭 𝐓𝐑𝐘 𝐨𝐧 𝐚 𝐰𝐞𝐚𝐤𝐞𝐧𝐢𝐧𝐠 𝐭𝐫𝐚𝐣𝐞𝐜𝐭𝐨𝐫𝐲.”
The Turkish lira halted its depreciation in levels just below the 14.00 mark vs. the US dollar at the end of the week, all amidst a narrow trading range in USD/TRY.
USD/TRY remains poised for extra gains:
USD/TRY seems to have met quite a decent barrier near 14.00 the figure on Friday, although it managed to record new highs for the year, nonetheless.
In the meantime, 𝐭𝐡𝐞 𝐥𝐢𝐫𝐚 𝐫𝐞𝐦𝐚𝐢𝐧𝐬 𝐮𝐧𝐝𝐞𝐫 𝐬𝐜𝐫𝐮𝐭𝐢𝐧𝐲 𝐚𝐦𝐢𝐝𝐬𝐭 𝐭𝐡𝐞 𝐜𝐮𝐫𝐫𝐞𝐧𝐭 𝐟𝐞𝐞𝐛𝐥𝐞 𝐨𝐮𝐭𝐥𝐨𝐨𝐤, 𝐰𝐡𝐢𝐜𝐡 𝐡𝐚𝐬 𝐛𝐞𝐞𝐧 𝐞𝐱𝐚𝐜𝐞𝐫𝐛𝐚𝐭𝐞𝐝 𝐚𝐟𝐭𝐞𝐫 𝐢𝐧𝐟𝐥𝐚𝐭𝐢𝐨𝐧 𝐟𝐢𝐠𝐮𝐫𝐞𝐬 𝐫𝐞𝐜𝐨𝐫𝐝𝐞𝐝 𝐚 𝟏𝟗-𝐲𝐞𝐚𝐫 𝐩𝐞𝐚𝐤 𝐛𝐞𝐲𝐨𝐧𝐝 𝟑𝟔% 𝐢𝐧 𝐭𝐡𝐞 𝐲𝐞𝐚𝐫 𝐭𝐨 𝐃𝐞𝐜𝐞𝐦𝐛𝐞𝐫 (𝐌𝐨𝐧𝐝𝐚𝐲).
From the Turkish cash markets, yields of the 5y and 10y bonds reverse the recent multi-session weakness and resume the upside to past the 24% mark and just above 23%, respectively. The recent decline in yields have been promoted by purchases of government debt by the Turkish central bank (CBRT) according to latest news.
What to look for around TRY:
The lira resumed the downtrend while market participants continue to digest the recent inflation figures and the government scheme to protect deposits in the domestic currency. The reluctance of the CBRT to change the (collision?) course and the omnipresent political pressure to favour lower interest rates in the current context of rampant inflation and (very) negative real interest rates are forecast to keep the lira under intense pressure for the time being, That said, another visit to the all-time high north of the 18.00 mark in USD/TRY should not be ruled out just yet.
Eminent issues on the back boiler:
Progress (or lack of it) of the new scheme oriented to support the lira. Constant government pressure on the CBRT vs. bank’s credibility/independence. Bouts of geopolitical concerns. Much-needed structural reforms. Growth outlook vs. progress of the coronavirus pandemic. Potential assistance from the IMF in case another currency crisis re-emerges. Presidential elections in 2023.
𝐔𝐒𝐃/𝐓𝐑𝐘 𝐤𝐞𝐲 𝐥𝐞𝐯𝐞𝐥𝐬:
So far, the pair is losing 0.24% at 13.7871 and a drop below 12.7523 (weekly low Jan.3) would pave the way for a test of 11.9694 (55-day SMA) and finally 10.2027 (monthly low Dec.23). On the other hand, the next up barrier lines up at 13.8967 (YTD high Jan.3) followed by 18.2582 (all-time high Dec.20) and then 19.0000 (round level).
𝐓𝐞𝐜𝐡𝐧𝐢𝐜𝐚𝐥𝐬 𝐚𝐫𝐞 𝐟𝐮𝐭𝐢𝐥𝐞 𝐮𝐧𝐝𝐞𝐫 𝐬𝐮𝐜𝐡 𝐟𝐮𝐧𝐝𝐚𝐦𝐞𝐧𝐭𝐚𝐥 𝐝𝐫𝐢𝐯𝐞𝐫𝐬 𝐚𝐧𝐝 𝐰𝐢𝐥𝐝 𝐩𝐫𝐢𝐜𝐞 𝐚𝐜𝐭𝐢𝐨𝐧 𝐚𝐬 𝐭𝐡𝐢𝐬, 𝐛𝐮𝐭 𝐧𝐞𝐯𝐞𝐫𝐭𝐡𝐞𝐥𝐞𝐬𝐬, 𝐢𝐟 𝐭𝐡𝐞𝐫𝐞 𝐢𝐬 𝐭𝐨 𝐛𝐞 𝐬𝐭𝐚𝐛𝐢𝐥𝐢𝐭𝐲, 𝐭𝐡𝐞𝐧 𝐭𝐡𝐞 𝐫𝐚𝐧𝐠𝐞 𝐚𝐫𝐞 𝐛𝐞𝐭𝐰𝐞𝐞𝐧 𝟏𝟏.𝟎𝟎𝟎𝟎 - 𝟏𝟔.𝟎𝟎𝟎𝟎
- BUYING PRESSURE PRICE 10.2000/11.3000
- Our option for #USDTRY is TO WAIT FOR BUYERS DECISION PRICE ACTION WITH A SECOND CONFIRMATION.
- Economy BUBBLE has happened or is close to !!
- The outlook and the overall trend for the pair is SO BULLISH .
- 𝗜𝘁’𝘀 𝗶𝗺𝗽𝗼𝗿𝘁𝗮𝗻𝘁 to keep in mind that cryptocurrency markets are extremely volatile, making it difficult to accurately predict what a coin’s price will be in a few hours or a few days and even harder to give long-term estimates. As such, analysts and online forecasting sites can get their predictions wrong. We recommend that you always do your own research and consider the latest market trends, news, technical and fundamental analysis , and expert opinion before making any investment decisions. Be patient and look long term wisely and never invest more than you can afford to lose.
Trading & Investing both are the master of RISK.
Please comment, like and follow if it was helpful for you.
Thank you for your time.
Have a profitable day.
| Review and analysis by Samadi.Finance |

USD / TRY An analysis alone does not reflect the facts. It is not investment advice.
If the ABCDE Pattern seen here exceeds the 17.15 resistance, it is 18.38. If it exceeds the 18.36 resistance, at 19.51, the short-term echoylation period begins. We put the point between 21.74 - 23.41 and the retreat begins.
When we examine the other economic factor, we see that the value of DOLLAR / TL is at least 20₺. We are on Telegram for more. ww3turkcehaber

USD/TRYIndicator show on HT Oversold area. SELL USD/TRY and possible rebuy area 10-11.
*Please share your opinion on it, write in the comments. Dont forget some cheers bravo. "
Teşekkürler.

USDTRY-LTSELLThe pair is well over extended and well, many disagreements on my posts. That is fine, as in the end of the day we are all responsible for our positions.
For now, no change in long-term view, and including weekly chart view, that the pair is heavily overbought, and yes inflation is very high, and one should consider the pair as a managed float, does not mean the market condition can continuously drive it upwards. For now SELL current (or add) @ 16.60-16.75 and will update when again. The profit order for medium-term 13.75 for now. The long-term 10.50-9.7500 for now.

USDTRY - The LiraHere we go again!
I see more downside for the Lira, tough times indeed.
Notice the breakout of a wedge pattern.
That is my thesis. Good luck out there guys.
1% Risk 4:1 RR

Bearish Time is coming for USD/TRYThere is 4h RSI bearish divergence.
I think this region is local top.
Next station is 13,5 for 3 months.
DXY is top, USD/EUR top,
Now DXY should decline.

USDTRY Elliott WaveThe risk of correction can be taken into account at this stage. The first potential trigger zone for ending the 5th wave, and also the chart the symetries in the chart can make it possible. Please do your own research. This is for educational purposes.

Although it is perceived as felony; it will likely beAlthough it is perceived as felony; it will likely be like that and hit another record
USDTRY-SELL Long-TermNo change in view.
Also this chart is directed towards those that have keen interest in the pair for a long-term basis. To clarify, when we look at a month chart, it means that our objectives are for the coming 6-8 months, and sometimes shorter time-period.
The last time when we had a RSI of 85.00 on monthly chart, the higher of USDTRY was 18.27, and everyone was saying we will go 20.00 above. The chart already was over bought once crossing 80.0 RSI which started above 12.00-13.00. So the RSI increased from 80.0 to 85.0 and that is where we got an overnight drop to 10.50 below. From there it was anticipated we should see back up to 14.00, and we traded for a while around that level drifting very slow or not at all.
Last week we started seeing 16.00 handle and that is where we are now. To cut the long story, a long-term SHORT would be short since 13.50-14.50 and adding above 16.50 once again. After we add again 17.50-18.00.
It is still possible to see higher and re-test 18.27 and the RSI will likely be somewhere 92.0-93.00. Overall, whether RSI is 85.0 or 91.0 for a monthly chart it means we see a collapse to lower levels. This is for some difficult to believe, and well fundamentally they are right, but market is LONG and one day or week the correction will happen, same as it did last December 2021. People have forgotten that already. Good luck everyone.

USDTRY-SELL++No change in view.
Because many people are commenting on the charts for USDTRY, for those I specially address this chart today.
The short-term picture, which means a time-frame anywhere between 5-14 days, the pair is overbought, and should correct slightly towards 14.68 now. The overbought status is quite severe (even though we have seen higher). It does not mean we go down today, and even it could move higher coming days, but the process is to be SHORT small and add on an increase of the pair. the next SELL after 16.39 is 17.25. In the end it is management of the leverage to ensure you can withstand the storm.
In a separate chart I will show a long-term chart and provide some clarifications.

USDTRY - Bullish Bias RemainsAs for now, Turkish Lira is still ABOVE 2021´s Close (Black Line) and Came back to Restest it.
Hence the Bullish Bias Remains. If price starts going up it will end at yearly R3.
If price breaks below yearly S1 (what I find unlikely) the yearly downtrend will be to S3.
For Educational Purposes Only.

16.29- 16.68 would be a nice resistance zone ( i hope) 16.29- 16.68 would be a nice resistance zone ( i hope) . I dont why but i dont like when turkish lira loses value against dollar.

USDTRY-SELL++No change in short-term view. The overbought situation is severe on daily chart, and weekly lesser. The monthly extreme, but we have seen little higher.
For now we remain SELL current @ 16.30-16.50 and add again 16.75-17.00. The profit objective is 14.37 for now.
