ABX trade ideas

Gold (Barrick) before rising 92%.Gold (Barrick) before rising 92%. The exchange rate appears to be moving in an accumulation area. Technically, the figure shows that the correction lower levels doubled in percentage (yellow rectangle). It can also be seen that the fractal rising wave sequence (green rectangle) also doubles. Conclusion. We have an accumulation phase, we have a doubling correction and we have a doubling wave sequence. The next wave sequence may be a rising wave again, three times its original size. As a result, the target price for further rise of the exchange rate is 33.50usd

Market Review - Monday, 27 January 2020MCD, GOLD, BMY, ETR, AZN, BHP, BMY, CAG, CI, CL, DTE, GWW, HUM, K, L, NKE, RIO, Y, TJX

GOLDEN CROSS - 50 DAY MA CROSSING 100 DAY MA - BULLISHWe do not play gold stocks. So here's a tip for everyone.
Today, Barrick popped up on one of the scans we run.
On the daily chart, the 50 Day MA is crossing up and over the 100 Day MA.
PMO, MACD, RSI and Stochastic are all BULLISH - (In an uptrend)
For anyone interested, here you go!
Best of luck with your trades!

B barnes group inc D1 short into resistance 25%barnes group inc daily chart review by projectsyndicate
short into strong overhead resistance at 71.50
target for bears is mirror level at 54.00
25% downside.
for bulls. look to buy later.
near mirror level1 and level2
good luck.
DS.

Market Review - Monday, 13 January 2020ETR, BMY, MCD, GOLD, AZN, CAG, CPB, KR, L, LMT, NEM, NOC, Y, RTN

Market Review - Monday, 06 January 2020AEP, AZN, AZO, BHP, BMY, CAG, CPB, CVS, ES, ETR, GPC, HRL, HUM, K, KMB, MMC, OMC, RIO, SO, SYY, TGT, TSN, VMC, WEC

GOLD LONG METALS UP 2020GOLD IS A METAL AND ALL SIGNS AND PREDICTIONS ARE THE GOLD AND OTHER METALS WILL GO UP IN 2020. STRONG BUY SIGNALS, GREEN CANDLES
BE CAREFUL EARNINGS FEB 14

GOLD $GOLD Trend Line Practice Been seeing lots of stuff on Twitter bout Gold GDX metals. I like the metals. Easy focus list. Metals Commodity. Etc. Obviously not studying my online training material if you happen to see this. Highly doubtful but will hit the material tomorrow. Happy New Year. Feeling much better!
NYSE:GOLD

$GOLD formerly #ABX fib and bullish DW$GOLD ending a descending wedge. Quite tight, but you can see a completed five waves, and we are right on a 61.8% fib, or a closer 50% fib. I suggest waiting for one more touch of the 61.8% with a stop under the other one for a 7.8:1 trade.
I wish they would remove that ticker GOLD it plays hell with the CFD market. I thought when Randgold was bought it would disappear.


Is Gold Quietly Gearing up for a Run? Technicals Say Yes!One of the best ways to forecast Gold is looking at the senior stocks. Why? Senior stocks are the most highly short interest stocks in the precious metal sector and they never consistently rise until a Gold run is near.
I believe what we are seeing now is the "true" bull run for Gold in-the-making, and eventually Silver and Platinum will follow (Platinum will be the slowest of the 3). Gold bottomed at 1450, and in my opinion, is exactly where Gold should have been. The US-China trade war from much of 2019 is what pushed Gold exceptionally higher as a result of extreme uncertainty.
While the "deal" serves little purpose and will do nothing to revive economic numbers anywhere in the world, what it has done is essentially confirmed a bit of a "lets start over" type of mentality because Trump had the option of giving-in or escalating the trade war and allowing the market to plummet. Obviously, he chose the former.
In reality, Gold will quietly begin to run up - moreso in 2020. While most people will continue to short Gold as they think a USA/China trade deal will send it plummeting, the reality is, most logical investors know what we will see is a likely continuation of a blow-off top for the remaining of December, with a likely short in Q1 2020.
Contrary to popular belief, yields rising at this point no longer will push precious metals down. This was relevant during the height of the USA/China trade-war, however, yields will inevitably rise whenever the next recession occurs as investors lose faith in governmental treasuries.
Moreover, Powell stated rates will remain unchanged in 2020. As usual, the Federal Reserves job is to remain artificially optimistic and 'lie' to the public to mitigate any fear. In reality, Powell will likely cut 2 or 3 times in 2020 with, in my opinion, the first cut coming in March or April of 2020, a second late in the summer, and potentially a third later in 2020 depending on the probability of Trump winning or losing and how the market prices in uncertainty. Remember, central banks do not forecast recessions. They react to them.
The time to slowly add precious metals is now as by the time 2020 comes, you may have timed yourself out of the market.
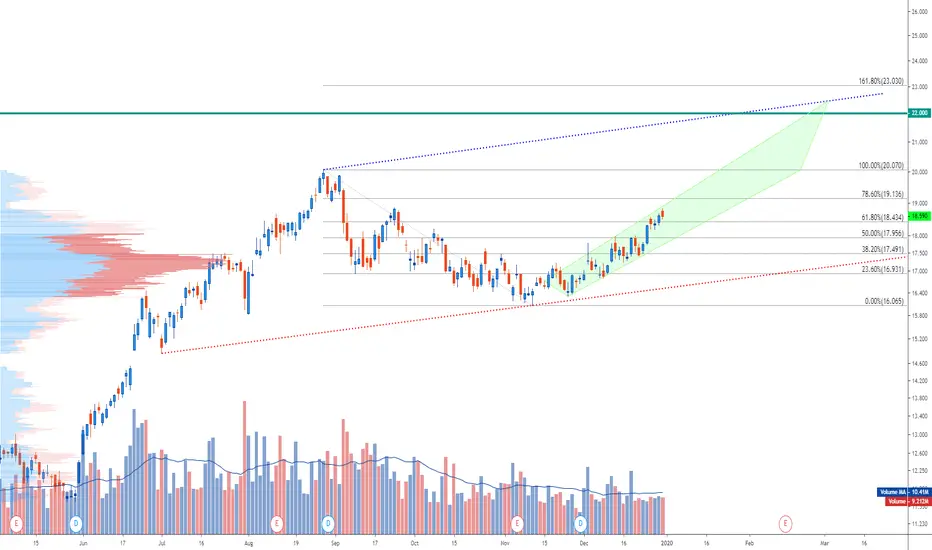
Expect Barrick to continue to push higher off the 180 sinusoidal pivot set back in early November.
- zSplit


BARRICK LONGS PT2Here we have a better view of what's taking place in the channel, it successfully retested the trendline of the previous downtrend, this year and continued to make strides upward. The new channel I have marked up shows that it has not broken any rules in the Elliot Wave principle.

BARRICK LONGSAs the fears of a global economic slowdown reach further in the hearts of hedge funds, banks and other financial instituitions it only make sense to gauge how these emotions fare on one of the largest mining companies in the world. After hitting record lows in 2015, it has steadily fought back. It has formed a higher low which gives us some indication that a higher high may follow.


Do you see a rising wedge or an ascending triangle forming? Note: All of what I claim below is simply the way I perceive the market. I am not certain nor do I suggest you take my advice without first taking into consideration what I have said. Whatever you do, be critical of what everyone claims. Those who claim certainty in the market tend to get hurt the most.
Observations:
It seems like it is developing two different patterns. The first being a rising wedge, which is considered a bearish sign. The second being an ascending triangle, which can be considered a bullish sign.
Notice how I have highlighted the resistance zone with a grey rectangular box. I did this to highlight all of the areas where price action bounced off of (or reversed). It will take a great deal of buying to get above this zone.
If price does break above this grey zone, I think that a further move up will ensue. At the very least, to touch the top of that rising wedge I've drawn out.
But if it breaks below trendline (B), I expect some strong selling off will follow.
I personally believe that the price will continue to consolidate within the ascending triangle I've drawn above. It will take a lot of fighting to break through each extreme edge, especially the resistance zone (A). Therefore, it is suggested to watch carefully when price does reach these two extremes.


GOLD LONG I realize the Gold family has been a sea saw. GOLD has a buy signal, green candles and I have been making some money on it. It is
much cheaper than the rest of the "gold family".

GOLD expecting an uptrendThis trade is for the options traders out there. We have a breakout of the falling wedge and the rsi is coming out of oversold. Expecting bearish sentiment on the S&P in the near term and gold to perform well in the meantime. I will be accumulating March 20 20 18$ calls which are currently priced at .78-.79. I will be holding these calls through the market correction until GOLD starts giving sell signals.
