AMD LongKey Technical Insights:
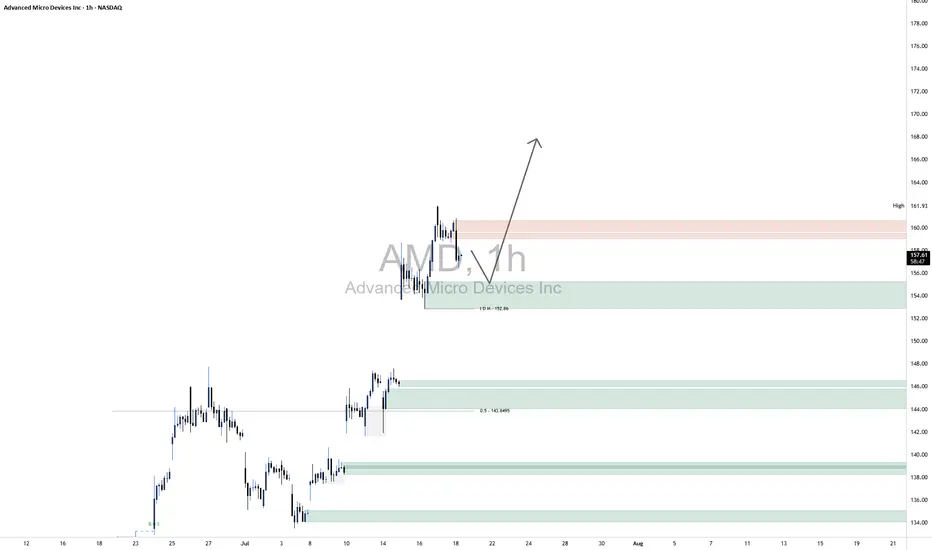
Clean Rejection from Demand Zone:
Price recently tapped into a well-defined demand zone (highlighted green) around $152–$155.
The immediate bounce suggests that buyers stepped in with strength, likely absorbing sell-side liquidity.
Liquidity Grab Below Short-Term Lows:
Before the move up, price dipped just enough to trigger stops below recent lows, clearing out weak hands.
This kind of liquidity sweep is often used by smart money to build long positions before a directional push.
Current Price Action:
Price is consolidating just below a minor supply zone around $159–162.
This pause is constructive: it signals that momentum may be building for a breakout higher.
Upside Outlook (Based on Your Arrow)
Your arrow points to a bullish breakout — and that aligns well with current price structure.
Once supply near $161 is absorbed, price has a clear path to push toward the mid-160s and beyond.
The current higher-timeframe trend supports continuation, and any short-term dip into the $155–156 range may offer re-entry opportunities.
AMD trade ideas
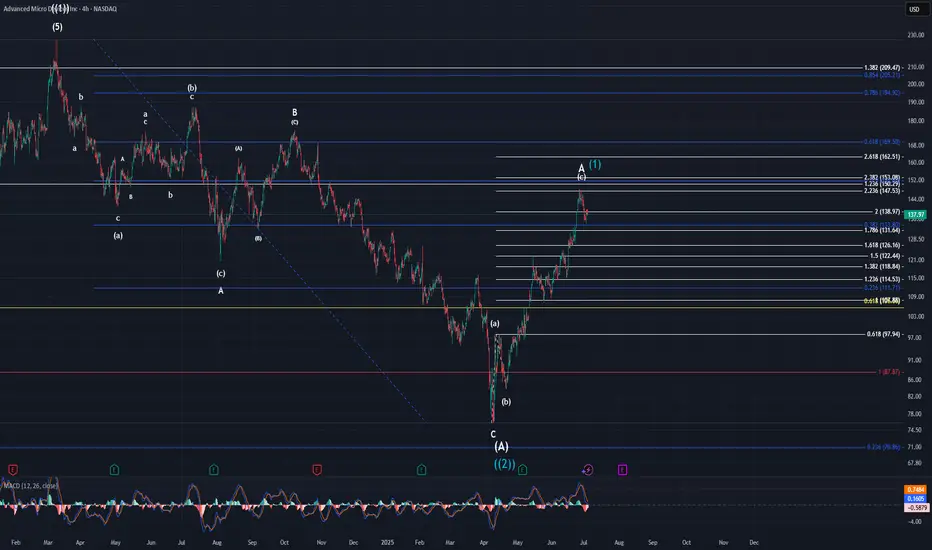
AMD Overview & Elliott Wave CycleAMD recently reported strong Q2 2025 results, with growth driven by Data Center and AI segments, notably thanks to the Instinct MI300 chip family. Revenue rose +15% YoY, with a significant boost from AI-related demand. Future projects include next-gen GPUs, AI platforms, deeper cloud integration, and investments in 3nm architectures.
From a technical perspective, AMD appears to be in a primary Elliott Wave cycle, which may have begun around October 2022. Such cycles typically last between 3 and 10 years. This insight comes from years of study, hands-on practice, and applied quantitative models,not guesswork.
If you found this interesting, share it with others: spreading thoughtful analysis matters.

The AMD Long Heist – Ready to Rob the Bulls?!🚨 AMD Stock Vault Heist: Bullish Breakout Plan with Thief Trading Style! 📈💰
🌟 Greetings, Wealth Raiders & Market Mavericks! 🌟
Hello, Ciao, Salaam, Bonjour, and Hola to all you savvy traders! Ready to crack the AMD Stock Vault (Advanced Micro Devices Inc.) with our 🔥 Thief Trading Style 🔥? This high-energy strategy blends technical precision with fundamental firepower to execute the ultimate market heist. Let’s dive into the plan, lock in profits, and escape the high-risk resistance zone like pros! 🏆💸
📝 The Heist Plan: AMD Bullish Breakout Strategy
Our chart lays out a long-entry blueprint designed to capitalize on AMD’s bullish momentum. The goal? Swipe the profits and exit before the bears take control at the resistance zone. This is a high-reward, high-risk setup, so stay sharp! ⚠️
📈 Entry: Crack the Vault!
Timing: Strike when the vault is open! Place buy limit orders on pullbacks within a 15 or 30-minute timeframe targeting the most recent swing low or high.
Tactic: Use a Dollar Cost Averaging (DCA) or layering strategy to stack multiple entries for optimal positioning.
Pro Tip: Look for bullish confirmation (e.g., candlestick patterns or volume spikes) to ensure you’re entering with momentum. 🚀
🛑 Stop Loss: Secure the Getaway!
Place your stop loss below the nearest swing low on the 3-hour timeframe (around $148.00 for day/swing trades).
Adjust based on your risk tolerance, lot size, and number of layered entries.
Why? This protects your capital from sudden reversals while giving the trade room to breathe. 🛡️
🎯 Target: Cash Out Big!
Aim for $179.00, a key resistance zone where bears may counterattack.
Watch for signs of overbought conditions or consolidation near this level—be ready to take profits and treat yourself! 💪🎉
💡 Why AMD? The Fundamental Fuel ⛽
AMD’s bullish surge is powered by:
Tech Sector Momentum: Strong demand for semiconductors and AI-driven chips.
COT Report Insights: Institutional buying pressure (check latest Friday COT data, UTC+1). 📅
Macro Tailwinds: Favorable economic conditions and positive sentiment in tech indices.
Geopolitical Stability: No major disruptions impacting tech supply chains.
Intermarket Edge: Monitor NASDAQ 100 and semiconductor ETFs for correlated moves. 📊
For a deeper dive, review:
Macroeconomic trends
Sentiment analysis
Index-specific correlations
Future price projections (overall outlook score: Bullish). 🌎
⚠️ Trading Alert: Navigate News & Volatility 📰
News releases can shake up the market like a rogue alarm system! To stay safe:
Avoid new trades during major news events (e.g., earnings or Fed announcements).
Use trailing stop-loss orders to lock in profits and protect open positions.
Stay agile—monitor real-time updates to adjust your strategy. 🚨
📌 Risk Disclaimer
This analysis is for educational purposes only and not personalized investment advice. Always conduct your own research, assess your risk tolerance, and align your trades with your financial goals. Markets move fast—stay informed and adaptable! 📚
💥 Boost the Heist! 💥
Love this Thief Trading Style? Smash the Boost Button to supercharge our robbery squad! 💪 Every like and share fuels our mission to conquer the markets with ease. Join the team, steal the profits, and let’s make money rain! 🌧️💰
Stay tuned for the next heist plan, you legendary traders! 🤑🐱👤🚀

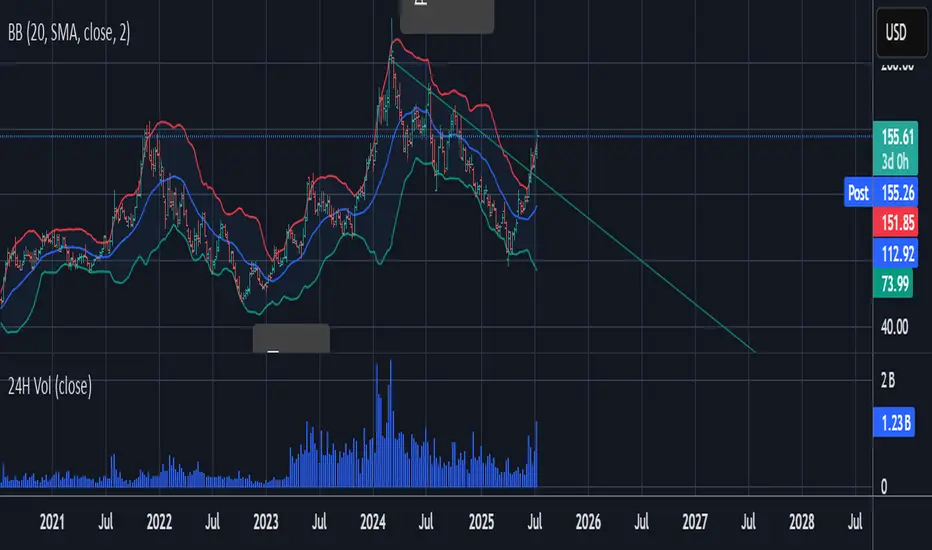
AMD in cross section of 2 important levelsAMD is at the crosssection of 2 important
trend lines
1. from Jun22 lows to sep23 lows and Aug 24 lows,
breaking down in Dec24.
2. The channel from Mar24.
I hope the price comes down to 133 levels.

AMD is a strong buyAs mentioned, NVIDIA is overbought RSI over and other indicators. Put your bets on AMD.
7/15 AMD short AMD just reached a major resistance level and is expected to pull back toward the $135 area. While it may not signal a full trend reversal, a retracement from today’s high is likely.
If the 7/15 candle forms a red shooting star, it would provide further confirmation.
May the trend be with you.

Advanced Micro Devices | AMD | Long at $126.00Advanced Micro Devices NASDAQ:AMD may be the sleeping giant in the semiconductor / AI space. While all eyes on NVidia NASDAQ:NVDA , earnings for NASDAQ:AMD grew by 800% over the past year... and are now forecast to grow 40% per year. Any other company would be soaring right now (like NVidia), but that company is getting all the attention. And, to me, this means opportunity for the future. The cashflow is likely to grow tremendously for
NASDAQ:AMD into 2027 and beyond, which may inevitably reward investors with dividends.
From a technical analysis perspective, NASDAQ:AMD just entered my historical simple moving average zone. This area (currently $108-$126) is where I will be gathering shares. Something tremendous would have to change regarding the fundamentals of this company (like a scandal) for the overall thesis to change. There may be some near-term price pains as NVidia gets all the focus, but to meet demand in the semiconductor and AI space, NASDAQ:AMD is poised to fulfill that roll in the future.
Target #1 = $158.00
Target #2 = $175.00
Target #3 = $188.00
Target #4 = $205.00

Safe Entry Zone AMDPrice Rejected From Resistance.
Safe Entry Green Zone.
Target after that 162$ price level.
Note: 1- Potentional of Strong Buying Zone:
We have two scenarios must happen at The Mentioned Zone:
Scenarios One: strong buying volume with reversal Candle.
Scenarios Two: Fake Break-Out of The Buying Zone.
Both indicate buyers stepping in strongly. NEVER Join in unless one showed up.
2- How to Buy Stock (safe way):
On 1H TF when Marubozu/Doji Candle show up which indicate strong buyers stepping-in.
Buy on 0.5 Fibo Level of the Marubozu/Doji Candle, because price will always and always re-test the
Take Care & Watch OUT !
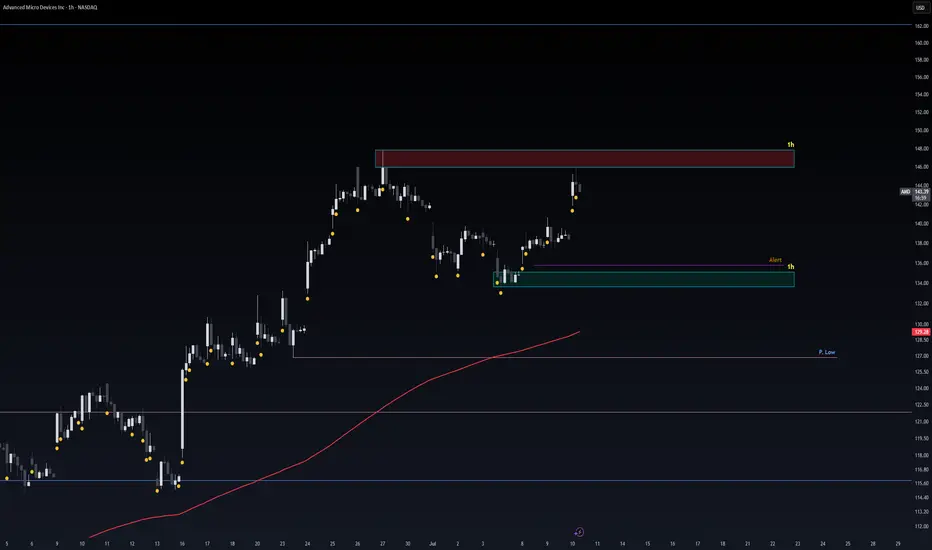
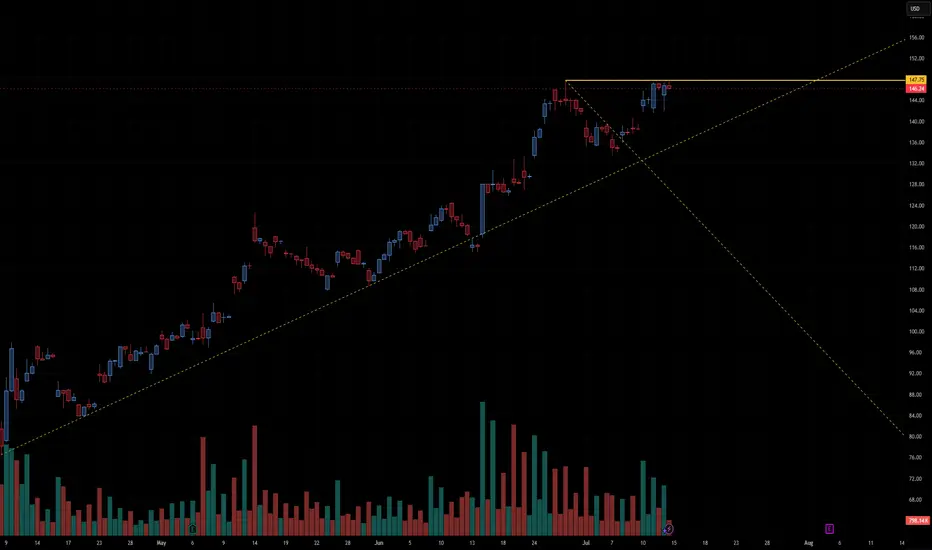
AMD preparing to break out or fail at resistance🔍 Chart Structure & Key Levels
Horizontal Resistance:
The stock is repeatedly testing the $147.75 level, which is acting as a horizontal resistance (shown in orange). Price has stalled here for several sessions, creating a tight range just below resistance—a common precursor to breakouts.
Ascending Trendline Support:
A long-term upward trendline (dashed yellow) supports the current move. Price has respected this line multiple times, showing a strong bullish structure over the past few months.
Volume Analysis:
Volume has decreased during the recent consolidation near the highs, which is typical before a breakout. However, we want to see a volume spike on a confirmed breakout above $147.75 to validate strength.
Symmetrical Triangle / Coil:
There's a tightening pattern forming between the rising trendline and the flat resistance, indicating price compression. This type of structure is often resolved with a large directional move.
✅ Bullish Scenario
A confirmed breakout above $147.75 with volume expansion could trigger a strong upward move.
Price could quickly target the psychological level near $150, and potentially beyond to $155+, based on the height of the prior impulse wave.
⚠️ Bearish Breakdown Scenario
If price fails to break above $147.75 and breaks the ascending trendline, a pullback to $140 or $135 becomes likely.
A breakdown would invalidate the current bullish structure and signal a potential short-term reversal.
🧠 Summary
This chart is in a bullish consolidation with a coiled setup just under major resistance. A breakout above $147.75 is the critical level to watch for upside continuation. Traders should monitor volume and candlestick confirmation before entering positions.
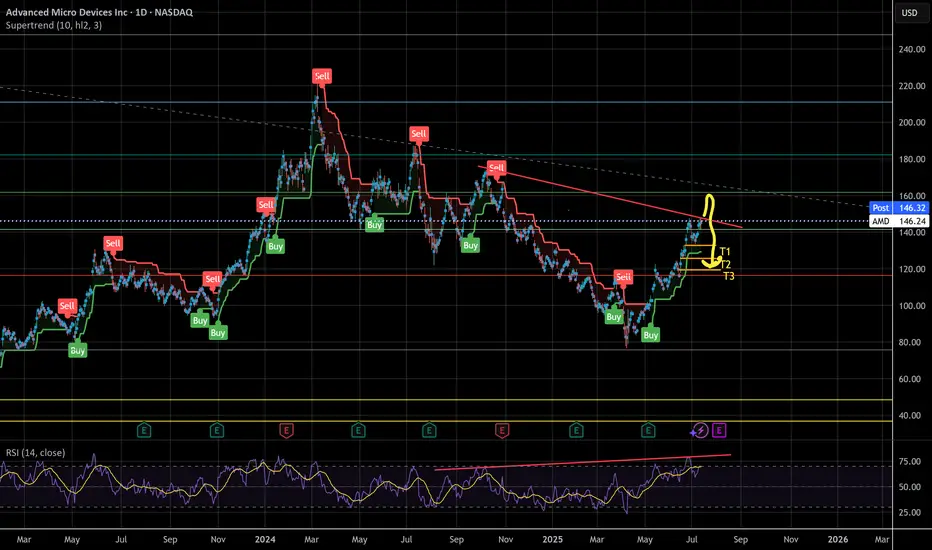
Must go down to go upI think AMD needs to cool off before it continues further, possibly tapping $160 first before a serious correction. Targets are listed at the strong support ending at $120. RSI printing bearish divergence on multiple time frames
Look at the red line, look at the direction of price. It's still a downtrend.
Stocks SPOT ACCOUNT: AMD stocks buy trade with take profitStocks SPOT ACCOUNT: NASDAQ:AMD stocks my buy trade with take profit.
This is my SPOT Accounts for Stocks Portfolio.
Trade shows my Buying and Take Profit Level.
Spot account doesn't need SL because its stocks buying account.

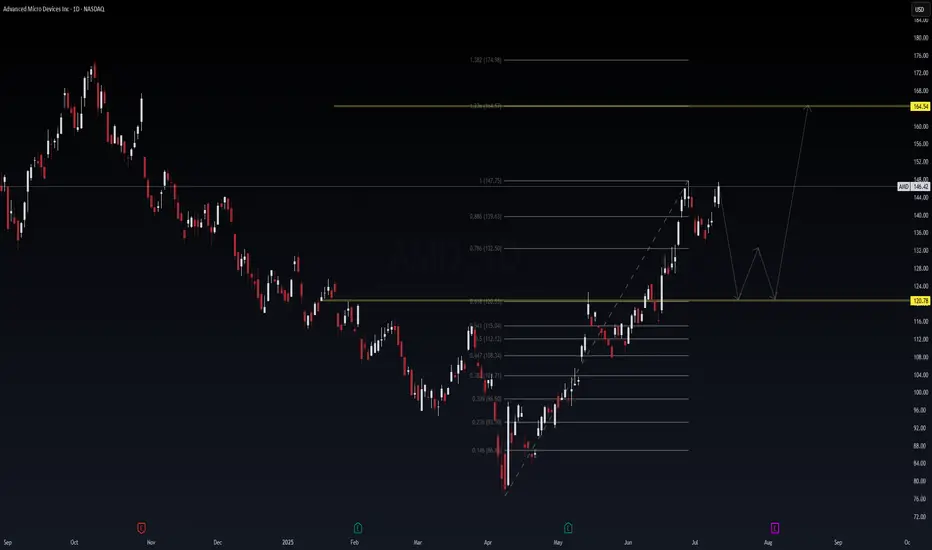
Trading Thesis: Silicon Whiplash – AMD Coiling for a Re-Launch🧠 Trading Thesis: “Silicon Whiplash – AMD Coiling for a Re-Launch to $164+?”
📉 Ticker: NASDAQ:AMD
🗓️ Timeframe: Daily (1D)
📍 Current Price: $144.42
📈 Fibonacci Expansion Target: $164.54 (1.236 extension), $174.98 (1.382 extension)
📉 Support Zone: $120.78
🔭 Play Duration: 2–4 weeks (event-based structure)
🔍 WaverVanir Thesis
Advanced Micro Devices ( NASDAQ:AMD ) is presenting a high-conviction pullback-to-launchpad setup.
After reaching the $147.75 resistance (1.0 Fib extension), AMD has begun carving out a potential W-pattern reaccumulation that could send it to $164.54+. This setup aligns with AI infrastructure momentum and strong GPU/CPU roadmap tailwinds into Q3.
⚡ Catalyst Radar
🚀 MI300 AI GPU Rollout: Recent guidance confirms massive momentum in AMD's data center AI segment, expected to double in Q3. MI300X is gaining traction in the hyperscaler race (vs. NVDA).
💰 AI Arms Race: AMD is aggressively capturing GPU demand in sovereign AI, defense compute, and private AI stack builders (OpenAI, Anthropic, Meta).
📅 Earnings Catalyst: Next report in early August. Expect YoY revenue growth rebound + margin guidance upgrade.
📐 Technical Blueprint
📉 Support Zone: $120.78 (Golden Pocket reversion area)
📊 Pullback Scenario: If price rejects from $147.75 again, a W-pattern retrace to $124–121 would offer a prime long entry.
📈 Upside Targets:
Target 1: $164.54 (1.236 Fib extension)
Target 2: $174.98 (1.382 extension)
🔍 WaverVanir DSS Signal
The DSS signal model confirms:
Smart Money Concepts (SMC) bullish orderblock was reclaimed at $115
Volume profile shows breakout from low-volume node — setting up for a clean sweep to higher liquidity zones
Momentum divergence on RSI and MACD supports the "cool-off before liftoff" thesis
🧠 Strategic Setup
Scenario Trigger Action
Bullish Continuation Break + close above $148 Chase breakout with $155/$165 calls
W Reversion Entry Drop to $124–121 with holding wick Long entry with call spreads into earnings
Bearish Breakdown Close below $118 Wait and reassess — structure invalidated
⚠️ Risk Management: Tighten stops below $117. Risk defined. No long if structure breaks down on high volume.
✅ Summary
AMD’s structure screams accumulation, not distribution. The convergence of technical structure, fundamental catalysts, and AI expansion cycles makes this one of the highest-risk-adjusted setups heading into earnings season. We are watching for pullbacks to enter long toward $164–175.
🧩 #Tags:
#WaverVanir #AMD #Semiconductors #AITrade #MI300 #GPUWar #FibExpansion #TradingThesis #NVDA #OptionsFlow #AIInfrastructure #SmartMoneyConcepts #VolumeProfile #WPattern #NASDAQ100
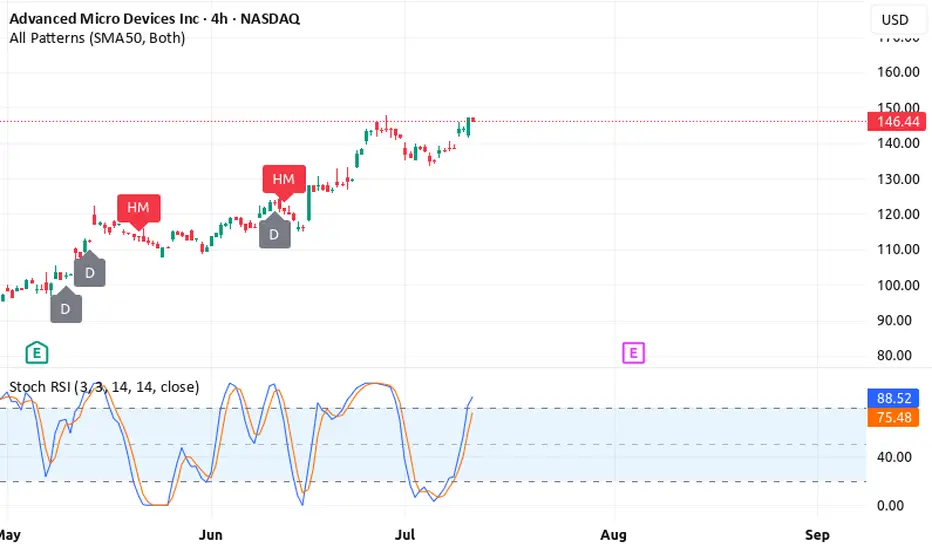
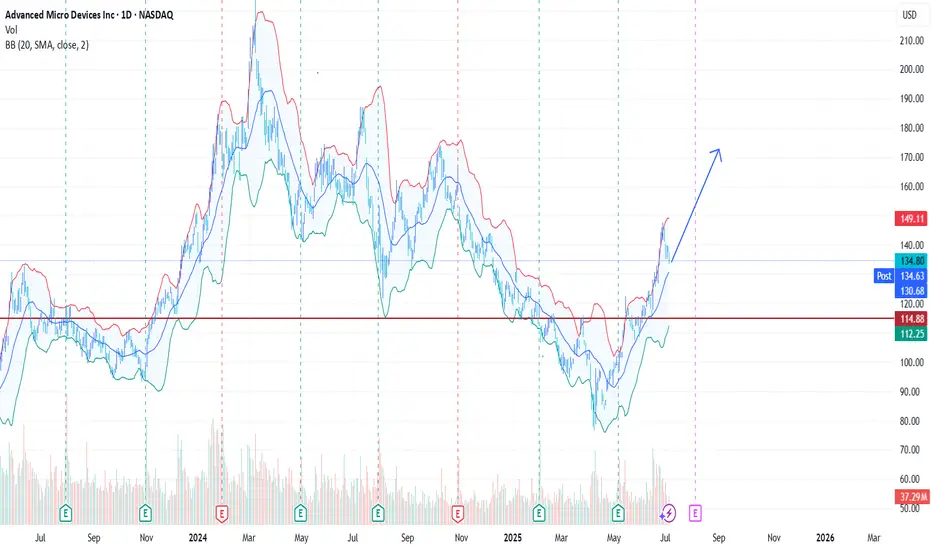
How 3 Bullish Timeframe Signals Suggest a Buy Opportunity on AMDHow 3 Bullish Timeframe Signals Suggest a Buy Opportunity on AMD Stock
AMD stock has flashed a compelling multi-timeframe buy signal based on a weekly breakout, daily reversal, and 4H stochastic
momentum shift—all aligned with the 50 and 200 EMA and Stochastic RSI indicators.
---
Advanced Micro Devices (AMD) is showing a promising technical setup for bullish traders. An alignment across the weekly, daily,
and 4-hour charts is sending a powerful message: momentum may be shifting in favor of buyers.
This article breaks down how two key indicators—EMA (50 and
200) and the Stochastic RSI—are lining up across three timeframes to support a potential upward move.
---
Weekly Chart: Breakout in Progress
The first signal comes from the weekly chart, where AMD has broken above a recent resistance level. Price has cleared previous
consolidation highs while staying well above both the 50 EMA and 200 EMA, a classic sign of long-term strength.
This breakout is significant because weekly chart patterns carry more weight and often lead to sustained price trends. The bullish
separation of price from the 50 and 200 EMAs is a signal that long-term traders are regaining control.
---
Daily Chart: Reversal Pattern Confirmed
On the daily chart, a clear reversal has taken shape. After a recent pullback, AMD found support near the 50 EMA and bounced
higher. The 200 EMA remains below, confirming the overall bullish structure.
This bounce is further validated by the Stochastic RSI crossing
back above the oversold region, a strong signal that short-term selling pressure has been exhausted. When momentum indicators
and price structure both confirm a reversal, it often leads to an upward follow-through.
---
4-Hour Chart: Early Momentum Reversal
Drilling down into the 4-hour chart, a timely reversal is unfolding.
AMD rebounded strongly from a lower support zone while holding above the 50 and 200 EMAs. Most notably, the Stochastic
RSI has crossed bullishly, confirming the momentum shift from sellers to buyers.
This 4-hour signal adds precision to the daily and weekly bullish bias. Short-term traders may use this to fine-tune entries, while
longer-term investors may see it as confirmation to scale into positions.
---
Conclusion: Multi-Timeframe Confluence Supports a Buy Bias
When the weekly, daily, and 4-hour charts align with bullish
signals from both price action and indicators like the EMA (50 and 200) and Stochastic RSI, the odds often favor the bulls.
While no signal is guaranteed, this kind of multi-timeframe confluence is rare and valuable. It suggests momentum is building
from the ground up—starting with short-term traders and expanding into longer-term buying interest.
---
Disclaimer:
This article is for educational purposes only and not financial advice. Use a simulation trading account before you trade with
real money and learn risk management and profit-taking strategies. Trading is risky and past performance does not
guarantee future results.
---
AMD 150 Target NASDAQ:AMD is setting up nicely — could push toward $150 by next week.
Break above $153 opens the door for a daily gap fill move. Watching closely. 🔥📈

Long 4HR AND Weekly ( Finishing Wave 1)
4HR
NASDAQ:AMD is close to potentially finishing Wave 5 of a larger degree wave 1.
$154 is the calculate Fib extension of Wave 1+3 for a wave 5 however, there is plenty room for the stock to run with multiple $160+ Analyst upgrades.
From the Close Price on 6/27 to $160 there is a potential 11% upside.
I believe any negative sentiment on trade with Canada will dissipate sooner than later as we seen throughout the entirety of the year so far with all trade talks failing to hold the markets down.
WEEKLY
The MACD has finally finished above the neutral zone increasing bullish sentiment and strength on this one moving forward as this is a bullish signal.
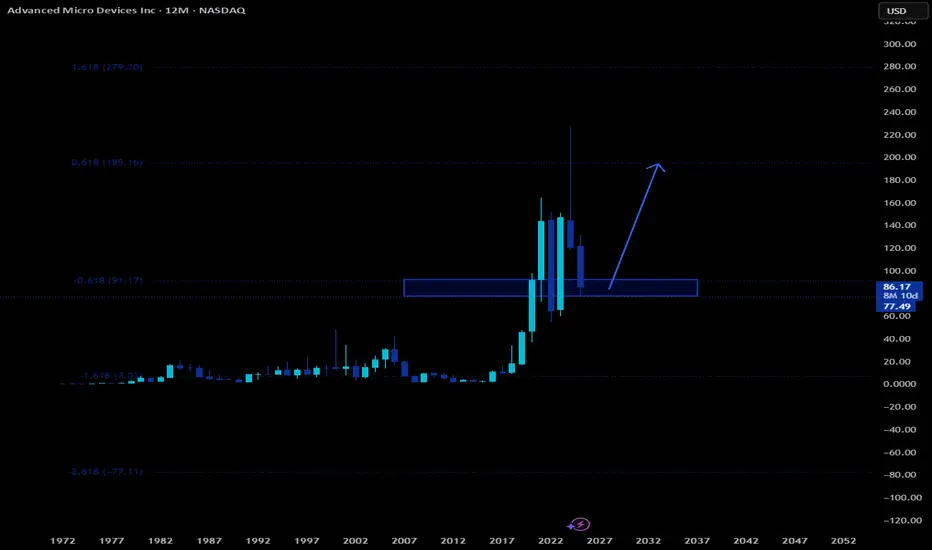
On both time frames this is a very clear breakout against the Multi year Resistance channel from its previous ATH with price against within the channel showing tons of strength in momentum.
A further outlook for this stock shows a possible wave 3 on the weekly chart targeting the upper trendline at over $300.
If you feel you missed the opportunity to get a long term position, there is always a second chance on on micro wave 2. That would give you retracements down to $100, $110, and $120. I'm rounding up the Fib levels for simplicity.
I currently hold 100 shares at an average of $118 and look to add more beneath my average.
I also am holding multiple contracts with a $140 strike out until the end of July and $160 strike out until September. I do not plan on trimming any contracts until the $150 stock price.
Use this information for educational purposes only as this is not financial advice.

AMD new range higherAMD essentially hit my buy zone that I called months ago almost to the T. Now with renewed strength and the market realizing there is share for both NVDA and AMD, the stock rips. I believe it will push up into this zone over the next week weeks and consolidate here. I am not currently in this trade but I did short AMD on the prior pivot.
Sometime in August we likely enter this range and I may start to sell CSP in the demand zones that form.

AMD Clears Resistance, Eyes $147.8 on Bullish ReboundAMD broke above $139.8, making the primary trend bullish. A pullback to this level can provide a discount to join the bull market, with a target at $147.8.

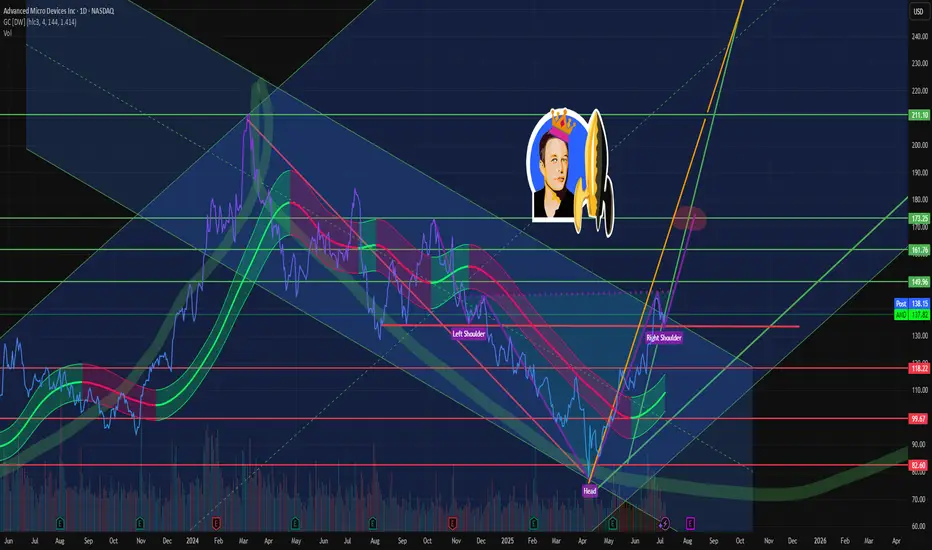
-This zone of 138 USD is really important-AMD📈 AMD Technical Analysis – Bullish Breakout in Sight?
"We are currently testing the parallel channel at $138 for a potentially very bullish confirmation afterward. If confirmed, I would set a target at $170 USD."
🔍 Let’s break it down:
- 🧭 Key Level at $138: AMD is hovering around a critical resistance level within a well-defined parallel channel. This zone is acting as a decision point—either we break out with strength or face a pullback.
- 🧠 Head and Shoulders Pattern: The chart shows a classic inverse head and shoulders formation (Left Shoulder – Head – Right Shoulder), which is typically a bullish reversal signal. If the neckline (around $138) is broken with volume, it could trigger a strong rally.
- 🚀 Bullish Confirmation: A confirmed breakout above $138, especially with strong volume and momentum indicators turning positive, could ignite a powerful uptrend. This would validate the bullish thesis.
- 🎯 Target at $170: If the breakout is confirmed, a price target of $170 is ambitious but realistic. It aligns with the upper bounds of the projected move from the head and shoulders pattern and the channel extension.
- 🛑 Risk Management: As always, keep an eye on false breakouts. A failure to hold above $138 could lead to a retest of lower support levels.
💡 Final Thoughts: AMD is at a technical crossroads. A breakout above $138 could be the spark for a major bullish run toward $170. Keep your eyes on volume, momentum, and confirmation signals. This could be a textbook setup for swing traders and long-term bulls alike. 📊🔥
The information and publications are not meant to be, and do not constitute, financial, investment, trading, or other types of advice or recommendations.
Thank you!
Subcribe TSXGanG! 💡🎯
AMD: Elliott Wave Cycle Shows Impulsive RecoveryAMD has seen a deep retracement from its 2024 highs, but it now looks like the stock is trying to stabilize. However, a straight push to new highs may not be likely just yet, as we’re still tracking an ongoing running triangle—an A-B-C-D-E pattern.
Looking at the daily chart, things do look promising for more upside into wave D as we’re seeing a clean five-wave move up on the lower time frame, suggesting we may be in wave A of that D-leg. After a pullback, there could be some very interesting opportunities on the long side.
Support levels on dips to watch are around 115 and 123, while upward projections for this three-wave D-leg rally could be toward the 166 gap area and potentially 185.
Highlights:
Direction: Up after pullback
Support: 115–123
Upside projection: 166 (gap), 185
Grega

AMD HUGE LONG AMD has a huge level around $180 that is begging to be tested. We are at major support on the yearly. I expect a huge move in AMD in the coming weeks to the upside.
AMD - the up rally continuesWe`va had again tariffs trouble bringing the stock and the market down, which does not change our main direction up. Stock is in a new cycle and continues to build up momentum. There is not much to say here
$AMD Swing Trade – Put Debit Spread Setup🔻 NASDAQ:AMD Swing Trade – Put Debit Spread Setup (Jul 18 Exp)
📅 Trade Opened: July 3, 2025
🛠 Strategy: Buy to Open (BTO) Put Debit Spread
📉 Strikes: $31 / $30 (Jul 18 Expiration)
💵 Cost (Premium Paid): $0.21
🎯 Trade Thesis
This setup aims to capture short-term downside in NASDAQ:AMD via a low-cost, defined-risk spread. The trade fits within my broader portfolio of OTM spreads under $0.25.
Key Drivers:
🔻 Semi sector under pressure – NASDAQ:AMD showing relative weakness.
📉 Breakdown below key support near $31 and rejection at VWAP.
🧾 Weak momentum – MACD trending down, RSI near 44.
🔄 Trade enters into earnings season volatility.
📊 Technical Setup (Daily)
EMA(4) < EMA(8) < EMA(15): Bearish structure fully intact.
VWAP: Price rejected from 30-day VWAP zone.
MACD/RSI: Momentum still fading, no signs of bullish divergence.
⏳ Strategy Notes
Max loss: $0.21
Max gain: $0.79
Risk/reward structured for a drop into or below $30
Expiration: July 18
🧠 Journal Note
Most of my trades are swing-based using OTM debit spreads with tight risk control. No same-day entries — setups must have defined technical compression and short-term catalysts.

AMD UpdateAs I have mentioned, this move higher is either an extended minor A wave, or it is the beginning of another bull run. I side with the extended A wave due to not only the structure of the chart, but also the broader market as a whole. If this is the case, then price will likely drop to the $100-$110 area to complete minor B. Minor C would ideally take us back up to the $170-$190 area completing intermediate (B). I cannot say how long all of this will take us, but intermediate (A) took 13 months to complete. It would not be a stretch to say we still have 8-10+ months before (B) completes.
Let's just take this one step at a time though. That means we need to watch for price to take us to the low $100's for minor B next.