Amazon should be closely look for resistanceAmzon has importance resistance to be break at 218.25 USD with closed candle above 218.25. if it not close over 218.25 after it test this resistance. it might have a chance for dropped by 10%++. However, if it closed above 218.25 and stay drop for time frame 240 min. this is a chance for long to test 233.58 resistance.
AMZN trade ideas

Heikin Ashi VS Regular candlesticks - EducationalNASDAQ:AMZN
Everything is explained in the video.
I hope you will find it very educational and test it. Those who trade stocks will probably switch to Heikin Ashi :)
Thank you!

AMZN - PULLBACK INTO NEXT SWINGGood Morning,
AMZN - Another stock that initiated a pullback. Not to fear, AMZN is trending towards a support. If it does not hold we would experience lower lows. My opinion is that it will hold given the strong bullish momentum. We will see it complete its final wave and then a correction.
ENJOY!

$NVDA $TSLA $META $AMZN – Triangle Squeeze Incoming?📊 Symmetrical triangle formations are building across these tech giants — and volatility is compressing.
🔍 What to watch:
📈 Breakout above upper trendline = bullish momentum
📉 Breakdown below lower trendline = bearish confirmation
📉 RSI on NASDAQ:NVDA is at 73.04 = overbought warning
⚠️ NASDAQ:NVDA earnings drop May 28, could be a trigger for resolution
These coils don’t last forever. Price is building pressure — and one strong candle could break the dam.
Stay sharp, and tighten your stops.
This is where risk management matters most.
👇 Which side are you betting on — breakout or breakdown?

SHORT | AMZN NASDAQ:AMZN
Current Price Action:
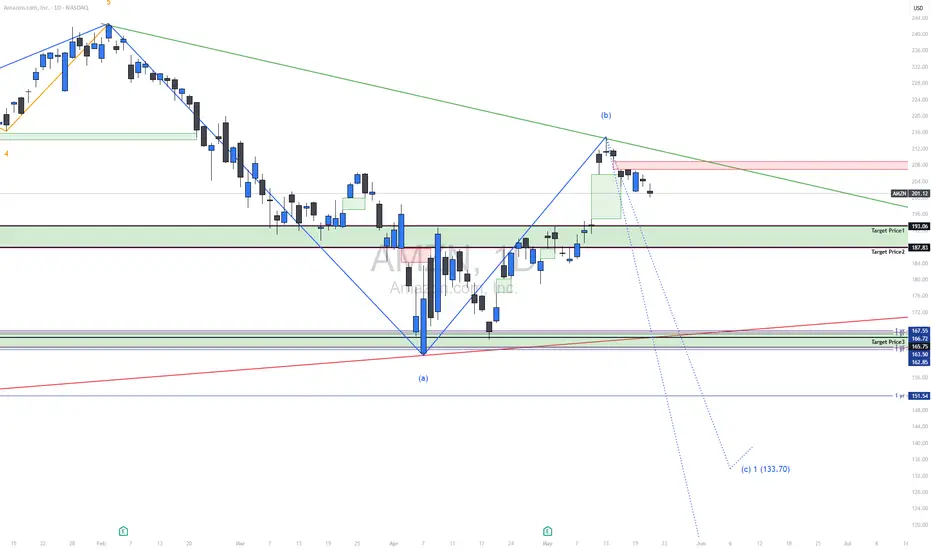
Price: $201.12
Recent Drop: -2.95 (-1.45%)
Support and Resistance Levels:
Immediate Resistance: $208–$212 (recent rejection zone)
Immediate Support: $193.06 (Target Price 1)
Further Supports:
Target Price 2: $187.83
Target Price 3: $167.55
Target Price 4: $164.72 / $163.55
Target Price 5: $151.54
Final Wave Target (c): $133.70
Trendlines:
Green Downtrend Line: Remains respected; price rejected at confluence.
Red Long-Term Support Trendline: Still valid; could act as a structural bounce level if tested.
Recent price action shows a breakdown from the short-term bullish move, indicating possible start of wave (c) to the downside.
Wave Structure:
Completion of corrective wave (b) followed by potential impulsive wave (c) targeting lower support areas.
Elliott Wave count suggests $133.70 is a possible wave (c) extension zone under bearish pressure.
Target Prices:
Target Price 1: $193.06
This zone is a minor support where bulls may attempt a defense.
Target Price 2: $187.83
A structural level from previous consolidation and a high-probability zone for price reaction.
Target Price 3: $167.55 – $163.55
Consolidated support zone; may attract buying interest or lead to acceleration if broken.
Target Price 4: $151.54
1-year support and psychological level.
Target Price 5 / Wave (c): $133.70
If the bearish wave unfolds fully, this is the projected terminal zone.
Summary:
Amazon (AMZN) has rejected a key resistance zone and appears to be entering wave (c) of a broader correction. The structure is bearish below the downtrend line and indicates further downside. Critical support levels to watch are $193.06 and $187.83 in the short term, with deeper targets at $167.55 and possibly as low as $133.70. This correction could accelerate if key support zones are breached.
Market prep 5-21The market sold off overnight, but nothing dramatic. A further move down and then recovery is a possibility. Gold pullbacks will likely be bought.

Amazon is looking at a short-term upside continuationNASDAQ:AMZN is looking good and from the Ichimoku perspective, the stock is showing a good bullish signal after bullish bar was seen closing above the kumo. Furthermore, the stock has confirmed its oversold crossover from its mid-term stochastic oscillator and 23-period ROC.
Price action wise, the stock saw a strong bullish flag in the making and prices has revert back above the 2020 March uptrend line.
For this, we are targeting 161.8% expansion of AB=CD

Using Advanced Hybrid Leading Indicators for Swing Trading The professional side of the stock market has undergone massive infrastructural changes in the past 5 years. These changes are unknown to most retail traders and that can pose major problems for you success and profitability no matter what trading style you use.
A trading style is a type of trading that has specific parameters to which strategies can be applied based on the current market condition. Currently, we have a Bottoming Market Condition that is poised to shift to a Moderately UpTrending Market condition.
The 3 sets of data used in stock indicators are Price Time and Quantity. Most retail traders use outdated price and time indicators from the 80's and 90's.
Unfortunately these indicators no longer work in the modern, millisecond transaction market which is dominated by Dark Pools and professional traders.
Hybrid Leading indicators use all 3 data sets in a complex mathematical formula that provides a leading indicator for you to use.
The Chaikin Oscillator is an excellent Hybrid Leading Indicator that has a CENTER LINE oscillation which provides more information about price direction, change of direction, duration of the run up or down and leads price.
An indicator that LEADS price means that it signals a day or a minute ahead of the change of direction of price on the candlestick charts. This is invaluable to swing and day traders who need to be able to quickly sell or buy-to-cover to net the highest profits from each trade while reducing risk factors of whipsaw action especially intraday.
Intraday traders must use indicators that signal ahead of the price direction change. Unfortunately, most traders are using outdated price and time cross overs which ALWAYS lag as the price must move down or up before the crossover can form on the indicator chart.
To improve your profitability start using center line indicators that have all 3 data sets within the mathematical formula.

Quick View: $AMZNEMA21 at the crossover of the EMA50 and price is pulling back.
Watching for a #TopSwing Setup
Area of $215 as key resistance.
Support → $193 and $176

AMZN watch $186-189: Key Resistance zone for Recovery BounceAMZN struggling with China tariffs but trying to recover.
Now up into a key resistance zone at $186.75-188.98
Anticipating some consolidation below or within zone.
.
Previous analysis that called the TOP:
===================================================

AMZN: A Power Move for the Smart Trader | The Rebound Play?🚀 AMZN 2025 Trade Plan
After an early 2025 rally to $240+, Amazon (AMZN) has pulled back sharply to around $167, opening the door to what could be one of the most attractive rebound setups of the year.
With AWS still growing strong and net income nearly doubling in 2024, the fundamentals are on Amazon’s side. Add to that bullish analyst outlooks pointing to $226–$253 this year, and we might just be looking at a golden entry zone.
📌 Entry Points:
Start building a position at $167
Add more if it dips toward $160 or $151 (52-week low)
🎯 Profit Targets for 2025:
First stop: $210
Next: $226
Final push? $240+
This setup blends technical recovery with strong financials and long-term bullish sentiment. Patience, discipline, and solid risk management are key as AMZN finds its footing.
⚠️ Disclaimer: This is not financial advice. All trading involves risk. Always do your own research and consult with a licensed financial advisor before investing.

Amazon Partners with FedEx as UPS Pays the PriceBy Ion Jauregui – Analyst at ActivTrades
Amazon (NASDAQ: AMZN) has taken a strategic step by partnering with FedEx (NYSE: FDX) to handle part of the delivery of its bulkier packages. The multi-year agreement, signed in February, marks a significant shift in the logistics chain of the e-commerce giant, which until now had relied less on FedEx, especially after years of tension between the two companies.
This long-term contract strengthens Amazon’s position by diversifying its distribution network and allowing it to reduce operational costs compared to its other major partner, UPS (NYSE: UPS). The news comes at a critical time for UPS, which recently announced 20,000 job cuts and the closure of 73 logistics centers. These measures respond to a sharp decline in parcel volumes from Amazon, one of its key clients.
Recent Financial Results:
Amazon closed 2024 with net sales of $638.0 billion, an 11% increase from 2023. Its net income doubled, reaching $59.2 billion, while its cloud services arm, AWS, generated $107.6 billion in revenue and $39.8 billion in operating income.
FedEx reported $22.2 billion in revenue for the third fiscal quarter of 2025, with adjusted net income of $1.09 billion and adjusted EPS of $4.51.
UPS recorded $91.1 billion in revenue in 2024, with a net income of $5.78 billion — a 13.8% decrease year over year. The company also announced it expects parcel volume from Amazon to drop by more than 50% by mid-2026.
Amazon’s decision appears to pursue two clear goals: increasing control over its logistics chain and optimizing last-mile delivery costs. With an increasingly robust transport network and deals like the one with FedEx, the Seattle-based giant continues to reduce its reliance on third parties while strengthening its ability to manage demand spikes more efficiently.
For FedEx, the agreement represents an opportunity to regain ground lost to direct competitors and reestablish itself as a key player in e-commerce logistics. Meanwhile, UPS will need to rethink its strategy to adapt to an environment increasingly shaped by efficiency, automation, and margin pressure.
Amazon Technical Analysis
Since late 2023, Amazon has been trading in a bullish channel, reaching an all-time high of $242.52 in January. The stock then pulled back slightly during the first week of April, creating a new support level around the same area on April 21. Yesterday’s session opened quietly, continuing the bullish gap from the day before. The RSI shows a high overbought level at 67.98%, which could signal a correction toward the point of control (POC) near $188. The moving average crossover on April 16 reinforced a bearish trend, suggesting a possible sideways movement between $222 and the lows of $162. If the price reaches the upper range again, it may face resistance unless Amazon’s online retail performance improves by the end of the quarter.
In a sector where speed, cost-efficiency, and adaptability are key, Amazon once again demonstrates its ability to stay ahead of the curve.
*******************************************************************************************
The information provided does not constitute investment research. The material has not been prepared in accordance with the legal requirements designed to promote the independence of investment research and such should be considered a marketing communication.
All information has been prepared by ActivTrades ("AT"). The information does not contain a record of AT's prices, or an offer of or solicitation for a transaction in any financial instrument. No representation or warranty is given as to the accuracy or completeness of this information.
Any material provided does not have regard to the specific investment objective and financial situation of any person who may receive it. Past performance is not reliable indicator of future performance. AT provides an execution-only service. Consequently, any person acting on the information provided does so at their own risk.

Amazon (AMZN) shares jump more than 7%Amazon (AMZN) shares jump more than 7%
As shown in the Amazon (AMZN) share chart, the price surged by over 7% yesterday, breaking above the key psychological level of $200 and closing at its highest point since early March.
The sharp rise in demand was driven by reports of a trade truce between the US and China following talks in Geneva. According to Reuters, the US has decided to lower the “de minimis” threshold on goods from China. This move could help de-escalate a potentially damaging trade war between the world’s two largest economies. For AMZN stock, this is a bullish signal, as Amazon sells a wide range of low-cost Chinese goods.
Technical analysis of Amazon (AMZN) shares
From a bearish perspective, the AMZN price has recovered to the 0.618 Fibonacci retracement level after falling from an all-time high to the early April low. In this context, selling pressure may re-emerge with the intention of resuming the downtrend—especially as most oscillators on the chart are signalling strong overbought conditions.
From a bullish perspective:
→ The pattern of higher highs and higher lows in late April and early May may have outlined the median of an ascending channel;
→ Yesterday’s price surge in AMZN shares may point to the channel’s upper boundary.
Given these conditions, it is reasonable to expect a minor pullback before the Amazon’s stock price resumes its upward trajectory within the blue channel.
This article represents the opinion of the Companies operating under the FXOpen brand only. It is not to be construed as an offer, solicitation, or recommendation with respect to products and services provided by the Companies operating under the FXOpen brand, nor is it to be considered financial advice.

AMAZON LongAMAZON is now net long on the regression break.
I am reviewing all market options this morning.

How to Trade with Professional TradersThe most important professional side group you need to learn to trad with are the professional traders. Many work for the Sell Side Institutions on huge trading floors or from their home office. Some work for the Buy Side Institutions and trade for the Giant Pension funds companies, Mutual funds companies and Derivatives Developer companies.
There are also Independent Professional Traders which is a growing number of floor traders who now trade in the home office for themselves.
One thing about pro traders you need to remember is they are highly competitive and do not share anything. They are loners and prefer a quiet place where they can trade uninterrupted. They do not have chat groups. They do not have guru groups.
They are reclusive and you will never see them giving a retail news interview.
Their trading is to track the Dark Pool hidden quiet accumulation or quiet rotation to sell short. They do not move price in big runs up or down.
Instead the use very controlled, bracketed orders that keep a tight penny to few penny spread as their entry price. The do not use VWAP. Instead, they use TWAP Time Weighted at Average Price which sets up an order on the millisecond time frame to ping automatically at a specific price range that is very tight.
Learning to read stock charts so that you can see the pro trader setups which start often 3-5 days ahead of the actual momentum run that follows their pro trader nudges candle patterns. These candle entry signals are not in the older Candlestick books. Nudges as an entry signal started a few years ago and now is the standard for most pro traders.
When you can read a stock chart, and in particular candlesticks, then you will be able to pick out the professionals easily.
Volume is often below its average as professionals are not making the momentum, they are using their strategies for swing trading to entice smaller funds, or HFTs or retail traders to move price for them. Thus they have an easy free ride of price movement.
Instead of waiting for a big gap learn how to enter early. Learn how to be patient and wait and then learn how to exit when the pros are selling into the buying spree of smaller funds and retail groups.

WHAT A LOVELY BULLISSH GAP ON AMAZON: A 4RR PROFIT TRADE CLOSEDI just closed this beautiful 4RR trade on Amazon.
The trade was entered last week, this new week market open Gap pushed the price high to my 4RR target.
Trade Idea;
The monthly is extremely bullish.
The weekly is also bullish.
Daily is bullish as well, so i entered on the daily time frame pull back swing low.
Result?
A beautiful 4RR profits trade.
Next Action?
I will wait till the daily frame correct and form a swing low before entering for a bullish trend continuation buy.

Bullish Momentum Signals $206 Target
Current Price: $193.06
Direction: LONG
Targets:
- T1 = $198.00
- T2 = $206.00
Stop Levels:
- S1 = $190.00
- S2 = $186.00
**Wisdom of Professional Traders:**
This analysis synthesizes insights from thousands of professional traders and market experts, leveraging collective intelligence to identify high-probability trade setups. The wisdom of crowds principle suggests that aggregated market perspectives from experienced professionals often outperform individual forecasts, reducing cognitive biases and highlighting consensus opportunities in AMZN.
**Key Insights:**
Amazon has been demonstrating impressive resilience and bullish momentum, reclaiming pre-2021 market levels and outperforming major peers like Meta and Nvidia. Recent institutional purchases, including BlackRock’s $3 billion investment in AMZN stock, signal strong investor confidence. Strategic investments in artificial intelligence (AI) and cloud computing, totaling $100 billion, position Amazon for substantial long-term growth. The stock's ability to stay above key technical levels, such as the 50-day moving average, further underscores its upward trajectory.
**Recent Performance:**
In recent trading sessions, Amazon has gained 0.5%, showcasing its strength amid broader market weakness. It has successfully reclaimed pre-2021 highs and continues to trade above critical support levels, reaffirming its bullish trend. Institutional interest, including BlackRock's recent investment, highlights the stock's attractiveness to major asset managers, adding credibility to its upside potential.
**Expert Analysis:**
Market experts remain bullish about Amazon's growth prospects, particularly its strategic emphasis on AI and cloud computing sectors, which are expected to drive its valuation higher. A notable adjustment in market valuation has placed Amazon on par with sector benchmarks, enhancing its competitive positioning. Industry analysts speculate a breakout above the $195-$200 resistance zone could catalyze a rally toward $206 or even higher in the short to medium term.
**News Impact:**
The potential reduction in US-China tariffs, from 145% to 80%, could provide a significant boost to Amazon's business by reducing operating costs and improving supply chain efficiencies. Additionally, anticipated SEC approval for three-day-a-week options trading may enhance trading volume and liquidity, further supporting the stock’s bullish momentum. With macroeconomic conditions and regulatory developments aligning favorably, Amazon is well-poised to capitalize on its strategic initiatives.
**Trading Recommendation:**
Considering its strong technical foundation, institutional backing, and promising growth prospects, a LONG position in Amazon is recommended. The $206 target reflects both technical and fundamental assessments, while stop-loss levels are carefully calibrated to minimize downside risks.

Are You Using Technical Indicators All Wrong?Most indicators aren’t broken. Most traders use them wrong.
Thousands of traders rely on RSI, MACD, and moving averages — and most of them still lose money. Why? Because they use tools the wrong way, in the wrong context, with the wrong mindset.
Let’s break it down:
1. Indicators don’t predict — they react.
RSI hitting 30 doesn’t mean “buy”. It means selling pressure dominated recently.
2. One tool ≠ one strategy.
MACD or CCI alone won’t build you a system. Context, confluence, and confirmation matter.
3. Emotional confirmation kills discipline.
Seeing RSI 70 after price moves doesn’t mean you’re late. It means your emotions want to join the move — not your logic.
🚨 Solution?
Use indicators as filters, not triggers.
Build rules. Track what works. Trade the system — not your excitement.
Want to see more posts like this? Let us know — We're preparing a series of deep-dives into indicator psychology and structure.

Amazon - Look At This All Time High Retest!Amazon ( NASDAQ:AMZN ) will create the bottom soon:
Click chart above to see the detailed analysis👆🏻
The trend on Amazon is clearly towards the upside and the recent correction of about -30% did not change that at all. Rather, we are now witnessing an extremely bullish all time high break and retest and therefore, if Amazon actually creates bullish confirmation, this could form a bottom.
Levels to watch: $180
Keep your long term vision,
Philip (BasicTrading)

AMZN trading at 20 year trough forward EV/EBITDA multiplesAMZN is trading at 20 year trough forward EV/EBITDA multiples. Right now that is 10.3x forward EV/EBITDA. For reference, the 20 year average multiple is 18.23. Note the standard deviation lines on the multiple chart on the bottom right indicate that AMZN is trading nearly 2 sigma below the 20 year average multiple.
Only twice in past 20 years has valuation reached these lows: the 2022 market bottom and the 2008 bottom. Both were fantastic entry points.
Note the graph of the forward EV/EBITDA using rolling 2 year forward annual estimates. The yellow arrows on that chart correspond to the dates of the blue arrows on the price chart.
If you want to read the multiple chart more closely, grab the chart and you can make it bigger.

AMZN Weekly Bullish Setup - 91% Historical Win RateI’m looking to go long on Amazon (AMZN) on the weekly chart as the price that has acted this way has been a strong indicator for a swing trade in the past.
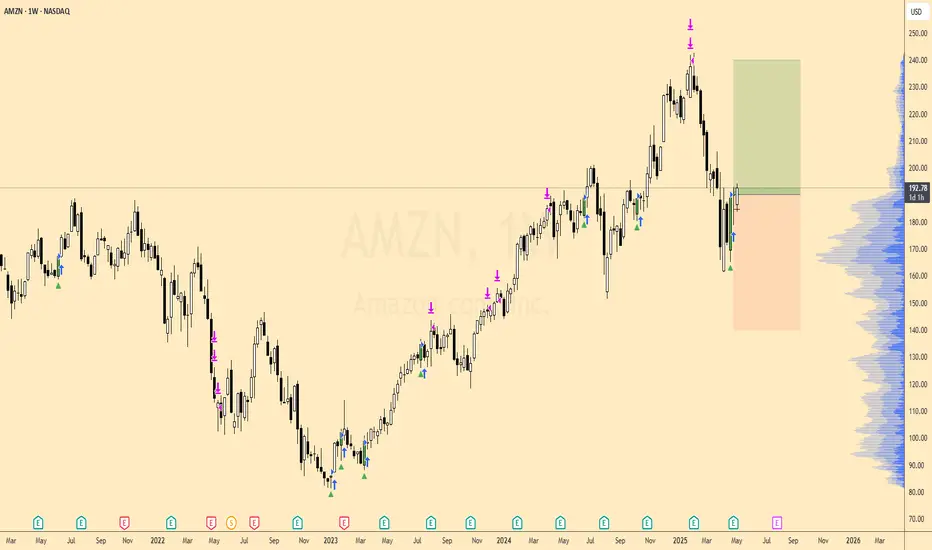
Since early 2023, AMZN has climbed from the mid-$70s to a peak above $245, carving out clear impulse moves followed by healthy pullbacks.
The current pullback has returned into the $185–195 region, which on the weekly VP shows the largest volume accumulation (HVN). Historically this zone has marked both places to buy into rallies and logical areas to defend.
We were in a 5 week range. Last week printed a bullish rejection candle (long lower wick), accompanied by my weekly “buy” arrow (green triangle). This mirrors 34 prior occurrences of the same pattern on AMZN’s weekly chart.
Targeting the $240 region, this is a 1:1 trade
Pull Back is RequiredAMZN Sell Setup - GETTEX:AMZ
Bearish Momentum on Daily Chart
Instrument: AMZN
Timeframe: Daily
Direction: Sell
Confidence: 75%
Setup Overview:
AMZN is showing bearish signals after a recent pullback. MACD has a bearish crossover, and RSI is overbought at 61.25, indicating potential for a downward move. VIX is rising, and 10-year yields are increasing, adding to market pressure. Social sentiment on X is mixed, but news sentiment leans bearish.
Trade Details:
Entry Price: $198.82
Profit Target: $182.23 (~5% downside)
Stop Loss: $205.61 (2:1 risk-reward ratio)
Position Size: 4% of portfolio
Expected Move: -5%
Key Indicators:
MACD: Bearish crossover
RSI: Overbought at 61.25
Market Context: Rising VIX, increasing 10-year yields
Follow for Best AI Signals on the market

AMZN at a Decision Point – Compression Before the Pop?Let me walk you through what I’m seeing on AMZN right now — because this thing has been quietly setting up, and I’ve got my eyes locked on a few key levels.
🧠 My Current Read on the Chart
From the daily timeframe, AMZN has clearly been in a falling channel since the Feb highs, but recently it’s been trying to base out. Price got a clean breakout of that downtrend, followed by a decent bounce, but the last few candles show we’re kind of stalling right around $185 — that level is acting like a magnetic midpoint.
On the 1H timeframe, it's just consolidating right under the Gamma Wall at $190, bouncing between $185 and $188 for several sessions. That tight price action looks like it's coiling.
MACD on the 1H is slightly turning up but still muted. The Stoch RSI on both timeframes is sitting in the midzone — not screaming momentum yet, but could flip fast with volume.
📊 What GEX and Options Flow Are Telling Me
Now here’s where it gets spicy: GEX levels are stacked. $190 is the highest positive Net GEX zone — that’s our big call resistance, and market makers are most likely short calls there. If price can chew through that level with strength, we could see a fast gamma pop toward $193–195.
Below current levels, $182.5 is the HVL and also lines up with a strong put wall (86%). That’s the real defensive level — if that breaks, it could attract liquidity lower into the $180–$175 zone.
IV rank is low at 27.7, and we’ve got a slight negative IVx trend (-8%), meaning the premiums are getting cheaper — good time to consider debit strategies.
💡 How I’d Play This Personally
1. Bullish case (breakout over $190):
I’d look at $190/$195 call debit spreads, especially with 3–10 DTE, keeping it defined risk while targeting that gamma extension.
2. Choppy zone (stuck between $185–$190):
I’m on watch mode. I wouldn’t touch directional plays unless I see a breakout or breakdown. Theta decay will eat you up in this range.
3. Bearish flush (lose $182.5):
I’d grab some quick puts targeting $177–$175, but only if we get momentum + a weak market. That zone opens the door for downside liquidity.
🧭 Final Thoughts
AMZN’s been under the radar while everyone watches AI names, but I think this thing is about to make a move — it’s just a matter of whether the breakout gets the volume push. Personally, I’m waiting for that clean trigger over $190 with some momentum before jumping in.
Keep your levels tight, watch that GEX wall, and don’t chase the chop. Let the setup come to you.
This is not financial advice, just how I’m looking at it based on my system and experience. Trade smart. 🙏
