BNS trade ideas

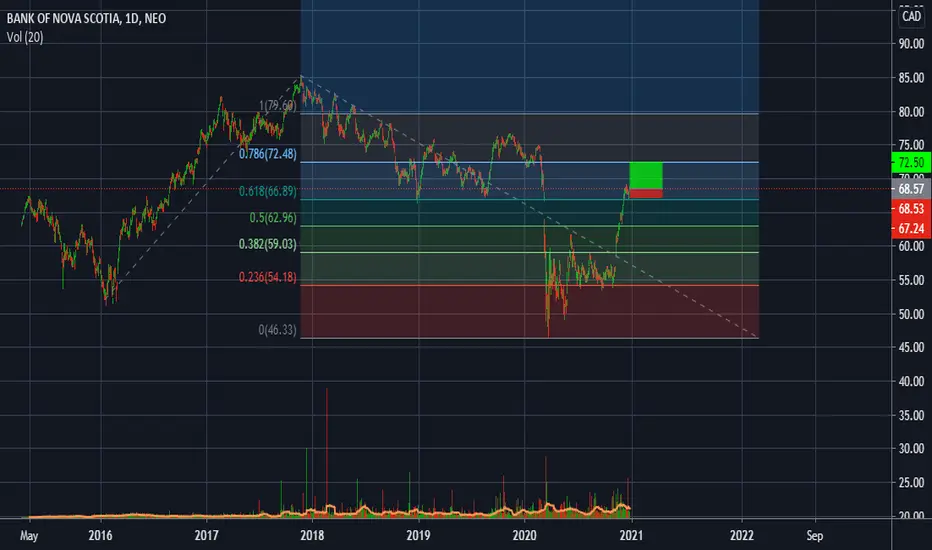
Bank Of Nova ScotiaChart pattern: Bull flag
Entry: Immediately (this would end the secondary downtrend of the correction)
Stop: 60.48$
Target: 72$
Stopmanagement: ATR Stops daily chart default settings
Risk:Reward-Ratio: > 3:1
Description: The chart is forming a bull flag with a nice corrective pattern (which retraced near the 38 Fibonacci retracement ). Target is the 1:1 Fibonacci extension of the former impuslive move.
Ordersize example: If you have a 10000K to trade and you only want to risk 1% of your volume , you can enter this trade with 2380$.

BNS - I know nothingJust playing around. I'm long all day all night on BNS. Good time to buy imo, $100 here we come

BNS LongLong Pros:
-GAP Fill
-Bullish Impulse
-Congestion around previous support (now resistance?)
Cons:
-Lots of real commercial / office real estate that COVID could impact.


$BNS - whats up with canadian banks? $TD had unusual volume, FNB and BNS are both headed towards golden crosses

BANK OF NOVA SCOTIABANK OF NOVA SCOTIA
Our share has been calmed, continuing to rise strongly upward as it has been terminated The vendors' role came to show their orders and there were volumes Large buyers

$BNS with a bullish outlook after earnings releaseThe PEAD projected a bullish outlook for $BNS after a positive under reaction following its earning release placing the stock in Drift A
If you would like to see the Drift for another stock please message us. Also click on the Like Button if this was useful and follow us or join us.

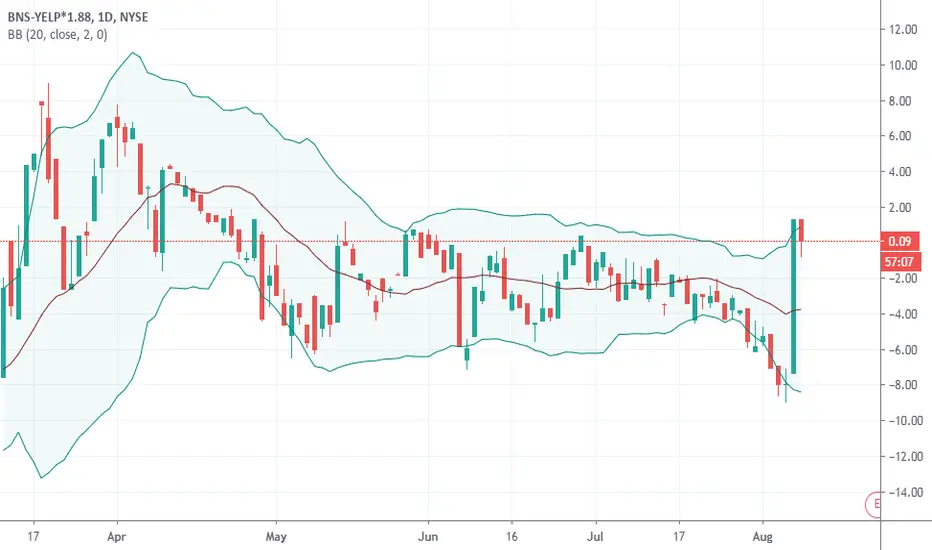
BNS and YELP Pair trade ( long the pair )Hello , good trade imo to hedge the account , especially with election uncertainties .
Long BNS and short YELP , exit on median band .
Good luck~

BANK OF NOVA SCOTIA Perspective DailyHey people, BANK OF NOVA SCOTIA is in a fake bearish movement with a bull tombstone and low buying volume traded. On TIMEFRAME M1 we see a panic which goes in the direction of its last precedent lower. To make a big propability reversal breakout the price zone then break the VWAP. And start at its high point, come back to make up for the losses before the strong resistance session once the comfort zone is broken (See TIMEFRAME H1). And if the buyers are still in the negotiation arived on the high that follows (See MULTIFRAME Daily H4 H1).
Please LIKE & FOLLOW, thank you!

Macro Ascending Triangle for BNS?On the RSI there's noticeably a triple bottom coinciding with three touch points on the upward sloping support of the Ascending Triangle.
If you move the chart left there's the first touch point of four on the upward sloping support of the ascending triangle dating back in 2003.
On a 5 year chart attached to this all time log scale chart there's been a golden cross on the KST that isn't noticeable here, the golden cross is recognizable on a 1 year chart as well.

Good statistical arbitrage to justify long position in YELP. I've noticed yelp is co-integrated with BNS. So, this chart represents bns/yelps pair price .
I am initiating a position in YELP based on this .
There are things I don't like about yelp like its p/e but all in all its a good entry based on statistic arbitrage of the pair price .
PS: I put together this pair price but it will not update due to the way I did this the ratio would quickly become inaccurate and would need to be recalculated manually if your looking for an updated pair price later on.


Following the moving average.Looking at this chart I see a price range between $53 and $50. Watching moving average to act as resistance. $50 being a physiological support.
Scotch RSI looks to be going up so rejection at $53 is very possible in the near feature. If price breaks $53 we could see a test of $60. It seems that currently probability slightly favors bears though its not like all indicators are bearish.
www.tradingview.com
RSI and MACD are basically flat.


It is a long term bearish, not good short short term trader 52 is a safe entry for long with 48$ as a stop loss and 58$ to collect profit

2020 mirrors 2008 gaps it is a recession, it is already confirmed on the chart before public know about it

A lesson from 2008 Canadian major bank Scotia Bank I do all my banking with Scotia bank and I personally believe they are the most risk taker as they handle all my personal and business loans
I will attach an analysis for 2020 chart in the comment shortly

RSI shows a bearish trend, a bearish BO happens Scotia Bank will be the first Canadian bank to show us an early sign for
Canadian recession if March 2020 closes under the 2009 support line
(Orange) then we will be looking at 61-53-50-47-23. The orange line
reflect the support of ALL time recession support, if it closes under that
line we are looking at a recession that no human witnessed before.
BUY GOLD

Watch 200 daily MAWatch for stock to try and stay above the 200 MA if it does dip below 200 MA the likely hood of death cross in linked post is much more likely.
