CNQ Earning Aug 7th, this to keep track of the stock for my own study to see if this works out. This is not for trading, just learning patterns
CNQ trade ideas
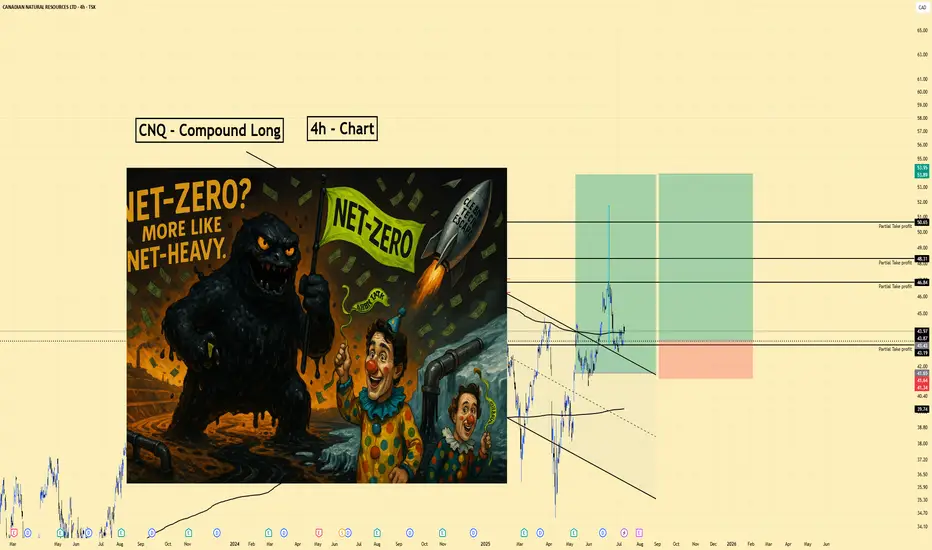
CNQ | Long | Oil & Gas Diversification Play | (July 9, 2025)CNQ | Long | Oil & Gas Diversification Play | (July 9, 2025)
1️⃣ Short Insight Summary:
Canadian Natural Resources (CNRL) is moving strong thanks to its diversified oil & gas operations, LNG expansion, and solid ESG positioning. We’re already up nicely on this move, and the setup still looks promising for higher targets.
2️⃣ Trade Parameters:
✅ Bias: Long
✅ Entry: Already in from lower (around $41)
✅ Stop Loss: Adjusted close to breakeven (~$41) to protect profits
✅ TP1: $46 — already partially hit (we took out 50% here)
✅ TP2: $50.65 — next profit-taking zone
✅ Final TP: $53.89 — extended target for the runners
✅ Partial Exits: Already 50% out, considering re-compounding at strong support zones
3️⃣ Key Notes:
We’re riding strong fundamental drivers: a major long-term LNG deal with Cheniere, increased pipeline capacity, and a robust oil sands base. The carbon capture (CCS) initiatives also support its ESG image, though they add capital costs. Oil price volatility and regulatory pressures remain risks, but the trend stays bullish as long as oil holds up and macro flows support energy stocks.
If entering fresh now, I'd watch closely and consider a tight stop around $41, as mentioned, to avoid getting caught in pullbacks.
4️⃣ Optional Follow-up Note:
I’ll continue to monitor and update this idea if major structure or price action changes.
Please LIKE 👍, FOLLOW ✅, SHARE 🙌 and COMMENT ✍ if you enjoy this idea! Also share your ideas and charts in the comments section below! This is best way to keep it relevant, support us, keep the content here free and allow the idea to reach as many people as possible.
Disclaimer: This is not a financial advise. Always conduct your own research. This content may include enhancements made using AI.
Canadian Natural resources is undervaluedUsing my simple method of technical analysis and fundamental calculation of the intrinsic value of a stock for which the range of intrinsic value of CNQ is between $35-$55. Assuming oil can make a reversal at this pivotal time in history for the world the stock looks very cheap. It also pays good dividends soon which was a bonus I bought some at $31 dollars for the market price. It looks like a great addition to make a nicely diversified portfolio.

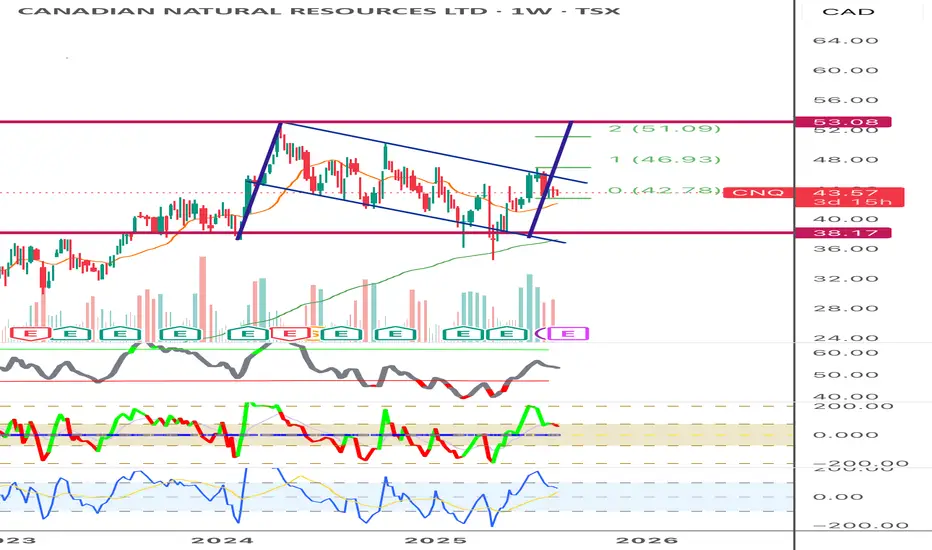
Canadian Natural Resources Stock Chart Fibonacci Analysis 050925Trading Idea
1) Find a FIBO slingshot
2) Check FIBO 61.80% level
3) Entry Point > 40/61.80%
Chart time frame: D
A) 15 min(1W-3M)
B) 1 hr(3M-6M)
C) 4 hr(6M-1year)
D) 1 day(1-3years)
Stock progress: A
A) Keep rising over 61.80% resistance
B) 61.80% resistance
C) 61.80% support
D) Hit the bottom
E) Hit the top
Stocks rise as they rise from support and fall from resistance. Our goal is to find a low support point and enter. It can be referred to as buying at the pullback point. The pullback point can be found with a Fibonacci extension of 61.80%. This is a step to find entry level. 1) Find a triangle (Fibonacci Speed Fan Line) that connects the high (resistance) and low (support) points of the stock in progress, where it is continuously expressed as a Slingshot, 2) and create a Fibonacci extension level for the first rising wave from the start point of slingshot pattern.
When the current price goes over 61.80% level , that can be a good entry point, especially if the SMA 100 and 200 curves are gathered together at 61.80%, it is a very good entry point.
As a great help, tradingview provides these Fibonacci speed fan lines and extension levels with ease. So if you use the Fibonacci fan line, the extension level, and the SMA 100/200 curve well, you can find an entry point for the stock market. At least you have to enter at this low point to avoid trading failure, and if you are skilled at entering this low point, with fibonacci6180 technique, your reading skill to chart will be greatly improved.
If you want to do day trading, please set the time frame to 5 minutes or 15 minutes, and you will see many of the low point of rising stocks.
If want to prefer long term range trading, you can set the time frame to 1 hr or 1 day.

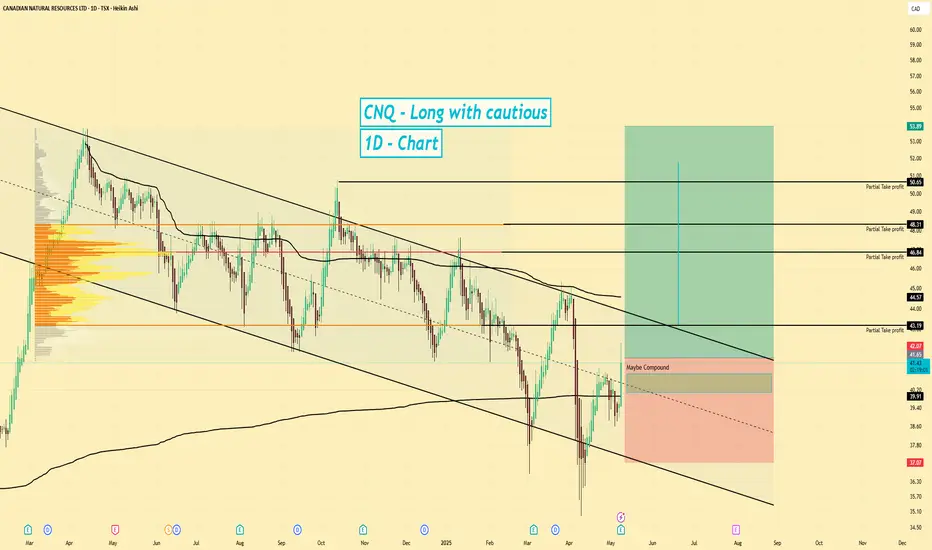
CNQ | Long Setup | Energy Value Play | (May 2025)CNQ | Long Setup | High Dividend + Energy Value Play | (May 2025)
1️⃣ Short Insight Summary:
Canadian Natural Resources (CNQ) offers strong energy exposure with solid dividends, but it's currently trading in a downward channel. I'm watching for signs of a reversal and a potential long setup forming off a W-pattern and VWAP reaction.
2️⃣ Trade Parameters:
Bias: Long (with caution)
Entry: Around VWAP zone ($40–$41), inside a possible W-formation
Stop Loss: Below $37
TP1: $43
TP2: $46.84
TP3: $48
TP4: $50
Partial Exits: Recommended at VWAP and $43 zone; potential to compound if structure confirms
3️⃣ Key Notes:
✅ CNQ operates across oil sands, refining, exploration, and production — with assets across Canada, U.S., and Australia
✅ Revenue sits around $35B CAD, with net income of $6.1B and annual cash flow around SEED_TVCODER77_ETHBTCDATA:8B
✅ Debt is high ( FWB:20B ), but manageable given strong cash generation and dividend coverage
✅ Dividend yield is 5.9%, which makes CNQ attractive to long-term investors despite debt concerns
✅ PE ratio is favorable at 7.95, suggesting potential value in energy sector
❌ Earnings and revenue growth are projected to slow slightly by 2025–26, so caution is warranted
4️⃣ Optional Follow-up Note:
I’ll continue monitoring for confirmation of the W-formation and channel breakout. If the VWAP area holds, I may consider compounding the position.
Please LIKE 👍, FOLLOW ✅, SHARE 🙌 and COMMENT ✍ if you enjoy this idea! Also share your ideas and charts in the comments section below! This is best way to keep it relevant, support us, keep the content here free and allow the idea to reach as many people as possible.
Disclaimer: This is not a financial advise. Always conduct your own research. This content may include enhancements made using AI.
Black Hole SunshineA surreal dreamscape, when spilled on water, can ignite under the right conditions, creating dramatic (but harmful) floating flames—an event that brings people back to reality.
The oil patch is on the verge. With an oil to gold ratio near all time high, the watershed moment is close. Accumulate through the near term volatility.

Road map for CNQIts a clear roadmap for NYSE:CNQ
I had done this analysis about 9 days ago for one of my friends and I forgot to publish it, and now that I am back, I see that it has progressed exactly step by step according to the analysis.
I need to see which price action pattern I specified on the chart will proceed in the future

$CNQ is hitting All-Time Highs (ATH) NYSE:CNQ is hitting All-Time Highs (ATH) 🚀 & still buying back stocks - a whopping 2,825,000 shares for approx. $285M! 📈 After a two-year base breakout, we're eyeing targets of $85-$90.
💡 KK Tip: Though tempting, it might be hard to chase right now. Keep it on your radar!

CNQ - time to take profits Chart setting up with what looks to be head and shoulder pattern. Taking some profits now before next earnings release. Lower commodity pricing might come into play. Watching closely the next few weeks and setting targets....if it drops a bit, would be a great buying opportunity long term.

CNQ - Time for some profit taking?CNQ - Canadian Natural Resources looks to be forming a classic Wyckoff Distribution pattern after this massive run up. I think it is time for some profit taking. A mild winter could produce a weak earnings report in February as demand for oil/gas is down. Natural gas prices remain down and I believe oil has room to reset. Pair these factors with CNQ at or near all time highs and it could be a good recipe for some coming downward momentum. Not Financial advice. Manage your own risk.

CNQ: Ascending Triangle, Confirmed (39,79%)(29/1000)(29/1000)
Ascending Triangle for CNQ on the daily chart.
Confirmed
Possible 39,79% gains.
Pros:
1- Bullish Ascending triangle
3- PPS above 50MA and 200MA
3- R/R ratio above 5
4- 250RSI above 50 and ascending
5- 50MA and 200MA ascending
6- RS above 0 and ascending
7- 50MA above 200MA
Cons:
1- ATR flat, less volatility
Target price is 86,99$
Stay humble, have fun, make money!
MAAX!

CNQ - 10 months HEAD & SHOULDERS CONTINUATION══════════════════════════════
Since 2014, my markets approach is to spot
trading opportunities based solely on the
development of
CLASSICAL CHART PATTERNS
🤝Let’s learn and grow together 🤝
══════════════════════════════
Hello Traders ✌
After a careful consideration I came to the conclusion that:
- it is crucial to be quick in alerting you with all the opportunities I spot and often I don't post a good pattern because I don't have the opportunity to write down a proper didactical comment;
- since my parameters to identify a Classical Pattern and its scenario are very well defined, many of my comments were and would be redundant;
- the information that I think is important is very simple and can easily be understood just by looking at charts;
For these reasons and hoping to give you a better help, I decided to write comments only when something very specific or interesting shows up, otherwise all the information is shown on the chart.
Thank you all for your support
🔎🔎🔎 ALWAYS REMEMBER
"A pattern IS NOT a Pattern until the breakout is completed. Before that moment it is just a bunch of colorful candlesticks on a chart of your watchlist"
═════════════════════════════
⚠ DISCLAIMER ⚠
The content is The Art Of Charting's personal opinion and it is posted purely for educational purpose and therefore it must not be taken as a direct or indirect investing recommendations or advices. Any action taken upon these information is at your own risk.

🐻 BEARISH FLATS ON FLATS #CNQ 🍁📉Hello Traders,
As we delve deeper into our market analysis, it's imperative that we pay attention to a commonly overlooked phenomenon in price action trading: the persistence of flat structures. These structures are fascinating because they offer both technical simplicity and profound insights into market sentiment.
They are easy to catch with the eye and offer a great accurate turning point when reaching the high or lows of A and C waves.
In the chart above we can see 3 flats, 2 regular and 1 contracting. The difference between the 2 is the following.
In a contracting flat:
Wave A is an impulsive wave retracing the impulse.
Wave B reverses wave A's movement but does not exceed the start of wave A.
Wave C is an impulsive wave in the direction of wave A, ending before the end of wave A, and not beyond the start of wave B.
In a regular flat:
Wave A is an impulsive wave retracing the impulse.
Wave B reverses wave A's movement and ends near the start of wave A but not beyond it.
Wave C is an impulsive wave in the direction of wave A, usually ending slightly beyond the end of wave A.
And it looks like #CNQ is making a regular flat to continue to bearish trend, look for sell setups!

#CNQ (CDN NATURAL RES), NEO MARKETHi
#CNQ (CDN NATURAL RES), Canada NEO MARKET
is in upward waves so if you get in a position with following details just exit position if updating trendline broke
Entry:81.29
SL:79.43
TP=1:10 and more but wait for trendline break and dont forget update trendline

If you think 10 year yields will keep climbing...If you think 10 year yields will keep climbing...
Then expect Oil & Gas producers to continue out performing speculative tech growth stocks.
Includes #Bitcoin #Amazon #Crypto #Tesla $arrk


Canada the big winner of energy?Energy markets are currently trying to find their footing. The loss of Russian crude to sanctions and the war in Ukraine has caused an impulse wave in the market.
My last energy post was about the long term more generally being short on oil. Short-term the disruption will cause elevated prices for a while followed by a turndown. Due to growth in energy use worldwide even if the hydrocarbons share of the market shrinks due to green energy demands for decarbonization LNG still overall gets bigger.
Waves of price action will depend on supply changes in both quantity and source through that transition. Waves of consumption and thus demand changes affect Europe negatively due to the current Ukrainian war along with emerging markets' needs for energy increasing for the next few decades till 2040.
There is an exception if the G7 decides sanctions should stay on Russia long term. If Europe hits its storage targets for LNG and crude for winter they will have a moment to breathe and look around for a long-term solution to their problem.
Canada offers a lot of solutions using LNG and could be one of if not the big beneficiary of the long-term needs of an expanding energy market through 2040. Exports on the coasts for LNG from North America generally could fill the gap left by Russia and meet demand from the emerging economies.
From the government of Canada's website.
"Eighteen LNG export facilities have been proposed in Canada – 13 in British Columbia, 2 in Quebec, and 3 in Nova Scotia – with a total proposed export capacity of 216 Million tons per annum (mtpa) of LNG (approximately 29 Billion cubic feet per day (Bcf/d) of natural gas). Since 2011, 24 LNG projects have been issued long-term export licenses. Canada’s only operational LNG terminal (an import terminal) is Canaport LNG’s regasification import terminal located in Saint John, New Brunswick."
Fliping this infrastructure to export will be a big job but if done quickly enough it can be used to avoid the use of coal worldwide in emerging economies and fix Europe's problems during the green transition.
To be fair building out base load in the form of Nuclear energy is far more preferable with hydro storage and then variable load in the form of solar and wind. In the opinion of this author however better is better for emissions and short-term use of LNG to limit coal consumption is a good idea. Just don't let the Koch think tanks trumpet their own horn too much. The unfortunate use cases of nuclear fuel for reactors to make bombs as North Korea has demonstrated presents a geopolitical tool that would be far too easy to use and thus is limiting the expansion of the technology.
Canada seems positioned to take advantage of exporting its resources to the rest of the world filling a gap left by Russia. It's a good opportunity for Canada. Time will tell if they take advantage of it.
All the best, see you on the moon.

Canadian Natural CanadaSun Storm Investment Trading Desk & NexGen Wealth Management Service Present's: SSITD & NexGen Portfolio of the Week Series
Focus: Worldwide
By Sun Storm Investment Research & NexGen Wealth Management Service
A Profit & Solutions Strategy & Research
Trading | Investment | Stocks | ETF | Mutual Funds | Crypto | Bonds | Options | Dividend | Futures |
USA | Canada | UK | Germany | France | Italy | Rest of Europe | Mexico | India
Disclaimer: Sun Storm Investment and NexGen are not registered financial advisors, so please do your own research before trading & investing anything. This is information is for only research purposes not for actual trading & investing decision.
#debadipb #profitsolutions

Parabolic ArcPrice is beneath the bottom band set on an 80 DMA, so stretched to the downside today.
Probable bounce to the upside soon.
An Arc is formed when price virtually goes almost straight up and can be better seen on a weekly or monthly chart. This pattern makes it worth checking a security on longer time frames if you plan to buy stocks at a high price. Folks are super bullish inside an Arc.
Most fall between 50 and 79% of the rise up, but they can fall less or more than this amount.
Price is volatile on the way down as a rule.
No recommendation.
Weekly chart:

WOW!!Steep climb. This is a monthly chart
Overbought on monthly with RSI on 80 versus 70, but not on weekly or daily timeframes.
Price is hovering below 70.60 which is an ATH.
I am laying low for this market rally and thought I would look at energy. Holy cow! This one is still going strong! Makes you scratch your brain and think, Why didn't I buy this at 6.71? LOL
If this ever falls, the .382 fib level is at 44.55 , the 50% is at 37.23, the .618 = 29.95 and the .786 = 19.77 but that is if this does not make another high which would change the fib table.
No recommendation/Short interest is less than 1.5% and negative volume remains very high.
EPS ( FWD )
9.04
PE ( FWD )
7.27
Div Rate ( FWD )
$2.33
Yield ( FWD )
3.55%
Short Interest
1.35%
Market Cap
$74.28B
Canadian Natural Resources Limited acquires, explores for, develops, produces, markets, and sells crude oil , natural gas , and natural gas liquids (NGLs). The company offers synthetic crude oil ( SCO ), light and medium crude oil , bitumen (thermal oil ), primary heavy crude oil , and Pelican Lake heavy crude oil . Its midstream and refining assets include two crude oil pipeline systems; and a 50% working interest in an 84-megawatt cogeneration plant at Primrose. As of December 31, 2020, the company had total proved crude oil , bitumen, and NGLs reserves were 10,528 million barrels (MMbbl); total proved plus probable crude oil , bitumen, and NGLs reserves were 13,271 MMbbl; proved SCO reserves were 6,998 MMbbl; total proved plus probable SCO reserves were 7,535 MMbbl; proved natural gas reserves were 12,168 billion cubic feet (Bcf); and total proved plus probable natural gas reserves were 20,249 Bcf. It operates primarily in Western Canada; the United Kingdom portion of the North Sea; and Offshore Africa. The company was formerly known as AEX Minerals Corporation and changed its name to Canadian Natural Resources Limited in December 1975. Canadian Natural Resources Limited was incorporated in 1973 and is headquartered in Calgary, Canada.

$CNQ with a Bearish outlook following its earnings #Stocks The PEAD projected a Bearish outlook for $CNQ after a Negative Under reaction following its earnings release placing the stock in drift D.
$CNQ with a Bullish outlook following its earnings #Stocks The PEAD projected a Bullish outlook for $CNQ after a Positive Under reaction following its earnings release placing the stock in drift A with an expected accuracy of 70%.

3/13/22 CNQCanadian Natural Resources Limited ( NYSE:CNQ )
Sector: Energy Minerals (Oil & Gas Production)
Market Capitalization: $70.677B
Current Price: $60.89
Breakout price: $54.00 (hold above)
Buy Zone (Top/Bottom Range): $57.25-$51.35
Price Target: $77.00-$79.80
Estimated Duration to Target: 788-805d
Contract of Interest: $CNQ 1/20/23 60c
Trade price as of publish date: $9.10/contract
