The king of canadian dollar storesthe king of canadian dollar stores. a solid swing, but also porbbaly a long term buy. An overall great company
DOL trade ideas

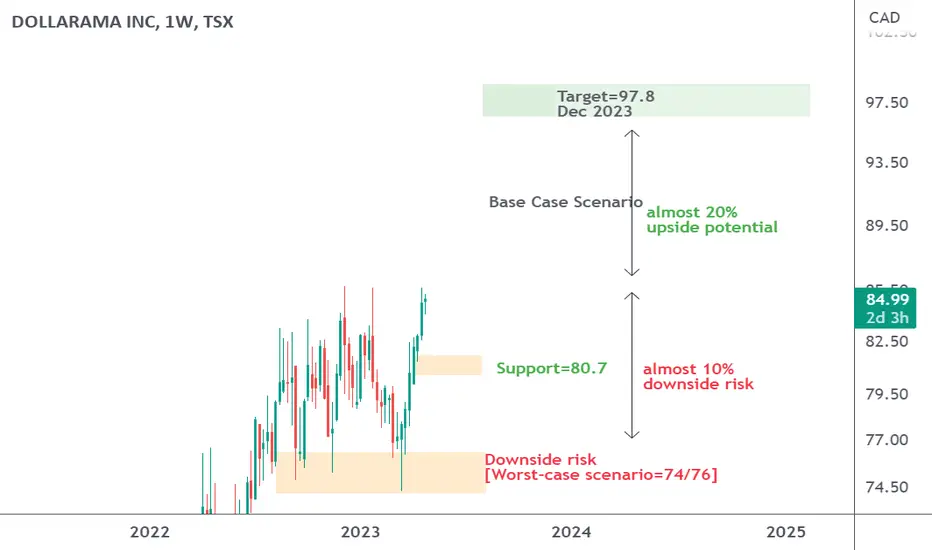
Dollarama is likely to break above 85.75; Risk=75, Upside=97.5Dollarama steadily rising trend is approaching toward a key resistance at 85.75. The ongoing pattern suggests that Dollarama’s stock price is about to break above the key resistance reaching to 97.8 target by the end of this year. Stock is currently trading above 200-day moving average which indicates the long-term sentiment is not bearish.
If stock price is unable to make a meaningful push above 85.75 mark, the downside risk would be initially 80.7 level. At current level Dollarama’s stock price offers 20% upside potential and 10% downside risk.
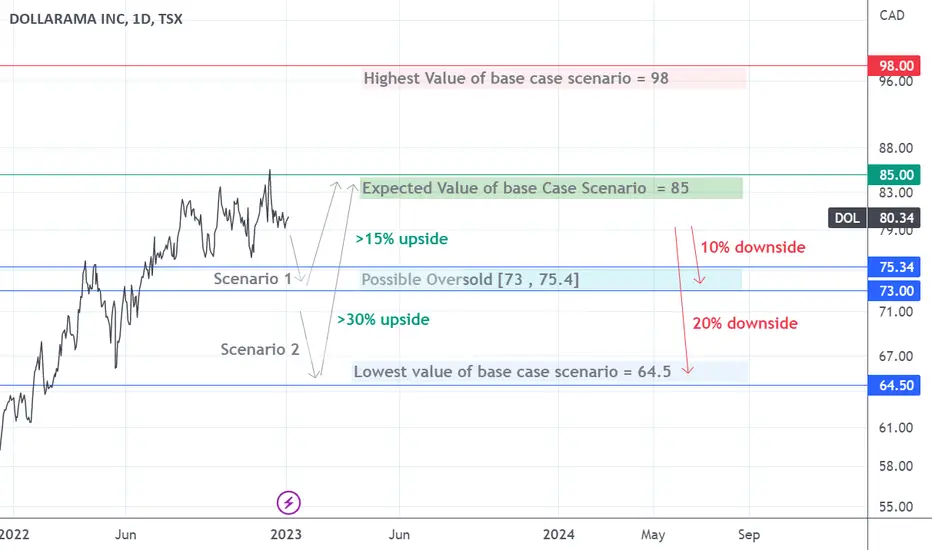
DOL: signs of upside exhaustionsDollarama steadily rising trend seems to have stalled since Aug 2022 when stock price struggled to move above 83.5. Although the long-term bullish trend still is intact, however some signs of upside exhaustions indicate the possible downside risk toward a range between 73 and 75.4.
Dollarama’s stock price is currently trading above 200-day moving average which suggests the long-term sentiment is not bearish; however, as stock has started to show some sings of weakness the risk of a downward move within the first quarter of 2023 has increased. A resistance zone ranges from 83.45 and 86 while supports are seen around 75.4 and 74.1. At current level Dollarama’s stock price offers a poor risk-reward given our base case scenario of 79.4 and 85 for March and Dec 2023 respectively.
If price falls between 75.4 and 73, it would offer 10 to 30% upside potential while the downside risk is estimated to be around 10%.

easy money dollaramaThe Canadian dollar has started to increase and it seemed it has a long way to go. Dollarama is one of the vital veins of the Canadian economy and the minor recovery in the economy would change this stock to a skyrocket!
% 4-5 is the easiest target for now, but in my humble opinion, $100 is not so far from today.

Late to the Game For those who are interested in my TSX watches:
DOL is one that I play frequently as a swing trade whenever a long opportunity presents. However, the TSX seems pretty late to the game in terms of the world dramas (recession, interest hikes, etc.) however the TSX Index has fallen quite a lot, with XIC (TSX Index ETF) falling 14.8% from its recent ATHs.
As is the style in Canada, we should soon be following the US's lead in terms of its massive bear market shortly and DOL will likely succumb to that reality.
DOL Currently:
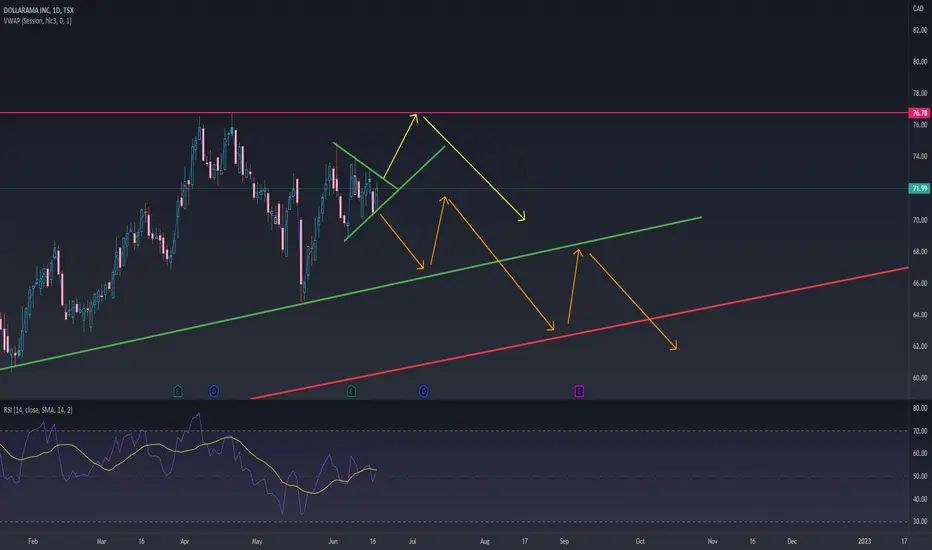
- Neutral on daily RSI
- Forming a bull pennant/symmetrical triangle on daily and 1 hour time frames:
- Trending very close to ATHs
- Has two major ascending supports located immediately underneath it, one currently around 66 to 65$ range (in gren) and the other, the MAJOR one that will make or break the stock (in red), sitting at around 61. You can see why this is the make or break support in the chart below:
Verdict:
- I really do anticipate the TSX to follow the NYSE in the bear market. Historically every time NYSE went into a bear market, TSX followed shortly after and the writing is on the wall with XIC.
- I am short biased here; however, I would wait for confirmation. Let us see a break down of this bull pennant before taking a short position.
Possible scenarios shown below:
Is it possible this breaks to new ATHs?
Yes! WMT, COST and retail in general were doing well. DOL has amazing fundamentals and is technically a staple of the Canadian economy. We did see a sort of sector rotation into these necessity markets on the NYSE during the start of this bear market with WMT, COST, etc. making ATHs while everything else was tanking.
HOWEVER, if we look at other Canadian retailers such as Loblaws we can see the writing on the wall:
My thoughts and opinions!
Feel free to comment, question and/or critique!
Interesting posting a TSX idea haha, would to hear from fellow TSX traders!
Take care
Still behind pandemic gains!35% increase from pre pandemic has not priced in the growth and expansion thats coming DOL's way for sure and that along inflation and belt tightening times and 5$ prices can easily push DOL past the 80$ mark , on technical side a long time channel has been broken upwards signaling a new lower and upper bands

Dollaramma Canada Sun Storm Investment Trading Desk & NexGen Wealth Management Service Present's: SSITD & NexGen Portfolio of the Week Series
Focus: Worldwide
By Sun Storm Investment Research & NexGen Wealth Management Service
A Profit & Solutions Strategy & Research
Trading | Investment | Stocks | ETF | Mutual Funds | Crypto | Bonds | Options | Dividend | Futures |
USA | Canada | UK | Germany | France | Italy | Rest of Europe | Mexico | India
Disclaimer: Sun Storm Investment and NexGen are not registered financial advisors, so please do your own research before trading & investing anything. This is information is for only research purposes not for actual trading & investing decision.
#debadipb #profitsolutions

Dollarama is going to test the bottom of the channel before popDollarama is going to test the bottom of the channel before a pop around end of March to early start of April


Correlation between Halloween and Dollarama stock price I really do not know anything about technical analysis but for the last few years, it sounds to me that DOL stock has a way to grow right after the 31 of Oct. Maybe I am fooling myself. What do you think ?

DOL putsUsually after earnings they've fallen shortly after. Sometimes they get a nice pump then a collapse, it seems like the last earnings call was that pump, and the result should be a nice collapse before an inevitable pump

DOLLARAMA: Clear Breakout on the Weekly ChartAfter long period of consolidation and a zig-zag type of action, Dollarama has successfully cleared the resistance around $57 on the weekly chart.
The business model proved itself to be resilient to COVID as stores remain open even during lockdowns. More gains to come?


DOL.CA: Ascending triangle, ConfirmedAscending Triangle, Confirmed
Pros
Descending Volume
Broke resistance with volume
RS above 0 and ascending
200MA slowly ascending
PPS above 50MA and 200MA
250RSI above 50
Targets:
PT1 = 51.63 (Filled)
PT2 = 53.99
PT3 = 56,69 (Last historical resistance)
PT4 = 58,96


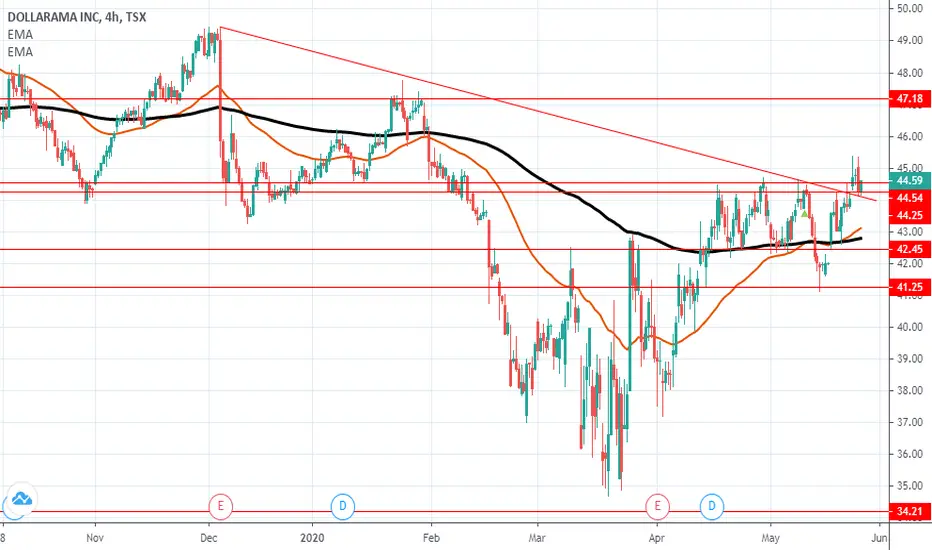
DOL: Pennant on WeeklyPennant on the Weekly on descending volumes.
Target #1 = 47,45$
Target #2 = 48,28$
Target #3 = 52,12$
Target #4 = 54,00$
Target #5 = 56,69$

finding an oppurtunityfound inverted head and shoulder pattern .....it has break up and again consolidating at the previously broken resistance which has become now support....so good luck ....trade wisely..

Dol retracement The dollaramas rear me are always packed with long lines as everyone is feeling the financial pinch caused by inflation. Only problem is a lot of the products are coming from China. Watchlist for now watch for support next week at .236 fib.

Substantial product is sourced from China - supply problems?With much of the product sold in dollar stores sourced from China, the coronavirus standstill in that country will hurt sales growth.
