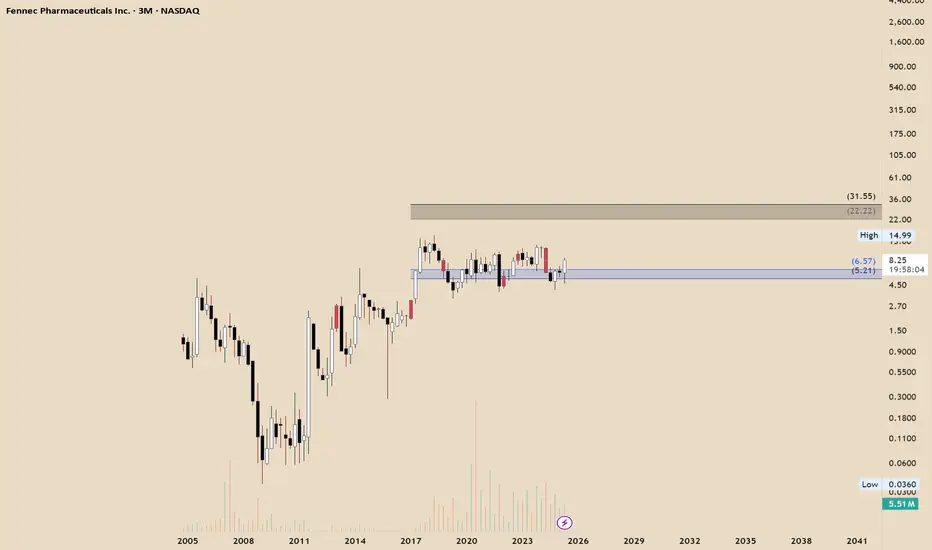
Fennec opportunity? FENNEC PHARMACEUTICALS has developed a compelling structure following the annual bullish breaker. According to my theory, the equilibrium zone is expected to act as support, potentially triggering an impulse move toward the first algorithmic target, as highlighted on the chart.
High R/R
NFA
Next report date
—
Report period
—
EPS estimate
—
Revenue estimate
—
−0.71 CAD
−597.30 K CAD
65.13 M CAD
23.03 M
About Fennec Pharmaceuticals Inc.
Sector
Industry
CEO
Jeffrey S Hackman
Website
Headquarters
Durham
Founded
1996
FIGI
BBG000BBWCT9
Fennec Pharmaceuticals, Inc. is a specialty pharmaceutical company. It focuses on the development and commercialization of PEDMARK to reduce the risk of platinum-induced ototoxicity in pediatric patients. The company was founded by Orest W. Blaschuk on September 3, 1996 and is headquartered in Durham, NC.
Related stocks
$FENC: Short setup$FENC has a nice short signal, the stock had a spectacular rally since it bottomed in early 2022, but could be reaching the end of the road here after drastically outperforming the market until now. Their drug received FDA approval in Sep 2022, commercial availability in the US in Oct 2022, but desp

FENC Analysis - Dip Buy0.786 can be seen as a previous point of resistance
now that price has moved higher than this level, it will be seen as a point of support for the breakdown of the rising wedge , a pattern that is commonly bearish (as you can see on the chart)
Pharmaceutical companies are possibly hot right now, due


WATCHING $FENC for ENTRY TARGET @ 5.68WATCHING $FENC for ENTRY TARGET @ 5.68
If this gets to 5.68 I'll play... 😏

FENC BULLISHI like the MACD cross and the close above the 61.8% Fibonacci level after testing it twice before. Also we should see a "golden cross" as the 50SMA crosses the 200MA in the next week or so. This of course would be very bullish.
1st target 9.41
2nd target 10.18


strange head and shoulders?I found this because there's a substantial upside breakout pre-market on FENC today. I think that H & S formations are reversal signals that are supposed to happen only at major tops and bottoms but this looks a lot like an upside-down one... is it just a fluke caused by this morning's press relea

See all ideas
Summarizing what the indicators are suggesting.
Neutral
SellBuy
Strong sellStrong buy
Strong sellSellNeutralBuyStrong buy
Neutral
SellBuy
Strong sellStrong buy
Strong sellSellNeutralBuyStrong buy
Neutral
SellBuy
Strong sellStrong buy
Strong sellSellNeutralBuyStrong buy
An aggregate view of professional's ratings.
Neutral
SellBuy
Strong sellStrong buy
Strong sellSellNeutralBuyStrong buy
Neutral
SellBuy
Strong sellStrong buy
Strong sellSellNeutralBuyStrong buy
Neutral
SellBuy
Strong sellStrong buy
Strong sellSellNeutralBuyStrong buy
Displays a symbol's price movements over previous years to identify recurring trends.
Curated watchlists where FRX is featured.

Frequently Asked Questions
The current price of FRX is 11.99 CAD — it hasn't changed in the past 24 hours. Watch FENNEC PHARMACEUTICALS INC stock price performance more closely on the chart.
Depending on the exchange, the stock ticker may vary. For instance, on TSX exchange FENNEC PHARMACEUTICALS INC stocks are traded under the ticker FRX.
FRX stock has risen by 1.27% compared to the previous week, the month change is a 4.35% rise, over the last year FENNEC PHARMACEUTICALS INC has showed a 32.05% increase.
We've gathered analysts' opinions on FENNEC PHARMACEUTICALS INC future price: according to them, FRX price has a max estimate of 20.99 CAD and a min estimate of 18.11 CAD. Watch FRX chart and read a more detailed FENNEC PHARMACEUTICALS INC stock forecast: see what analysts think of FENNEC PHARMACEUTICALS INC and suggest that you do with its stocks.
FRX stock is 0.00% volatile and has beta coefficient of 2.05. Track FENNEC PHARMACEUTICALS INC stock price on the chart and check out the list of the most volatile stocks — is FENNEC PHARMACEUTICALS INC there?
Today FENNEC PHARMACEUTICALS INC has the market capitalization of 331.15 M, it has decreased by −2.96% over the last week.
Yes, you can track FENNEC PHARMACEUTICALS INC financials in yearly and quarterly reports right on TradingView.
FENNEC PHARMACEUTICALS INC is going to release the next earnings report on Aug 7, 2025. Keep track of upcoming events with our Earnings Calendar.
FRX earnings for the last quarter are −0.06 CAD per share, whereas the estimation was −0.13 CAD resulting in a 55.94% surprise. The estimated earnings for the next quarter are −0.05 CAD per share. See more details about FENNEC PHARMACEUTICALS INC earnings.
FENNEC PHARMACEUTICALS INC revenue for the last quarter amounts to 12.23 M CAD, despite the estimated figure of 11.67 M CAD. In the next quarter, revenue is expected to reach 13.10 M CAD.
FRX net income for the last quarter is −1.67 M CAD, while the quarter before that showed −2.26 M CAD of net income which accounts for 26.17% change. Track more FENNEC PHARMACEUTICALS INC financial stats to get the full picture.
No, FRX doesn't pay any dividends to its shareholders. But don't worry, we've prepared a list of high-dividend stocks for you.
As of Jul 28, 2025, the company has 32 employees. See our rating of the largest employees — is FENNEC PHARMACEUTICALS INC on this list?
EBITDA measures a company's operating performance, its growth signifies an improvement in the efficiency of a company. FENNEC PHARMACEUTICALS INC EBITDA is −16.46 M CAD, and current EBITDA margin is 5.40%. See more stats in FENNEC PHARMACEUTICALS INC financial statements.
Like other stocks, FRX shares are traded on stock exchanges, e.g. Nasdaq, Nyse, Euronext, and the easiest way to buy them is through an online stock broker. To do this, you need to open an account and follow a broker's procedures, then start trading. You can trade FENNEC PHARMACEUTICALS INC stock right from TradingView charts — choose your broker and connect to your account.
Investing in stocks requires a comprehensive research: you should carefully study all the available data, e.g. company's financials, related news, and its technical analysis. So FENNEC PHARMACEUTICALS INC technincal analysis shows the buy rating today, and its 1 week rating is buy. Since market conditions are prone to changes, it's worth looking a bit further into the future — according to the 1 month rating FENNEC PHARMACEUTICALS INC stock shows the strong buy signal. See more of FENNEC PHARMACEUTICALS INC technicals for a more comprehensive analysis.
If you're still not sure, try looking for inspiration in our curated watchlists.
If you're still not sure, try looking for inspiration in our curated watchlists.