Fortune MineralsThe price is slipping away from the bears, but I don't think anyone was harmed, because there's no short interest. Even the bears are bullish. They may have wanted to buy, or convert, more shares at a lower price, but they're not upset to see higher prices. Nobody is upset to see higher prices, and so the price goes up as sell pressure eases into a vigorous pump up to the $.25USD neckline.
Most to all of the underlying metals that FT deals in is pumping, so pump in the ticker kind of makes sense. Looks to me like we're about to leave the all-time bearish fibonacci channel. Good times ahead as we turn bullish and enter into our new "bull fib channel". My own proprietary bull fib channel, which you've seen nowhere else. Guys on the blogs are getting their targets from me. Who has been saying $2 for the last two years?
FT trade ideas
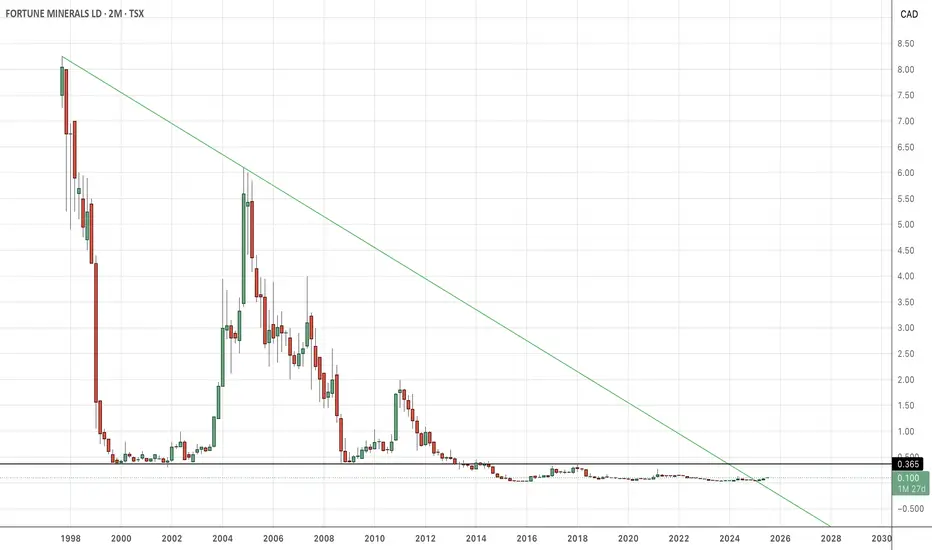
Fortune MineralsAnd here she is in log.
With OBV rising, the $.25USD pivot is in the headlights, but that's just the first step. We have a higher swing high on the dailies, but that does not make FT bullish. You need a higher-swing-high on the weeklies or a longer timeframe. So, the pump to $.25 is the pump before the pump. It's kind of like the dip behind the dip, but in reverse.
I'll see you at $2.
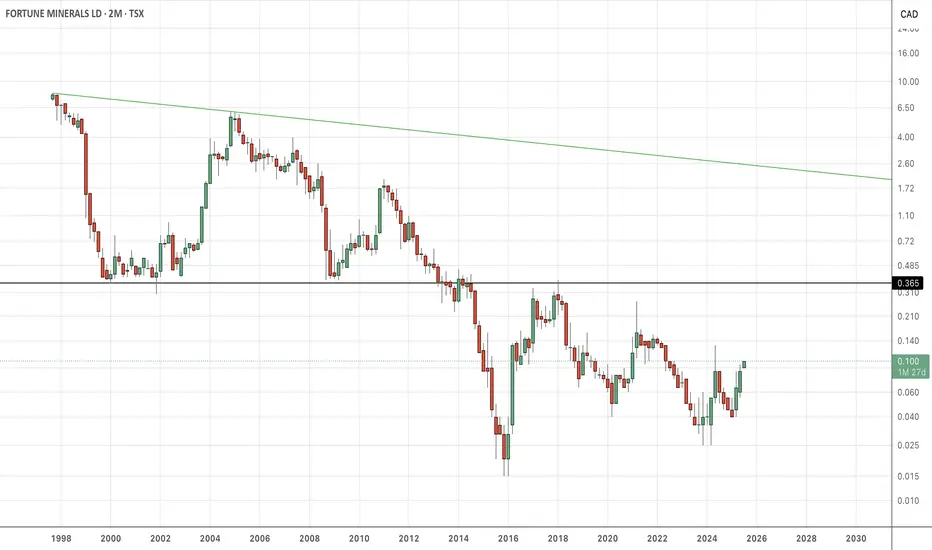
FortuneHere's the linear overhead in the rear-view mirror. The old rules no longer apply. New rules are no resistance until a twenty-five cent pivot, but really no resistance until it hits the Log overhead at $2. You think it's not going to go for $2? Watch.
Fortune MineralsI'm showing you a strong overhead that has been tested many times, and is now breaking out. It's kind of an IQ test, and the bears are failing it. There is little to no incentive to sell here, when we're about to "snap-to" $.25. Why would anybody sell here?
And that's why the price has seen thirteen up days in a row if you don't count one negative .64% day.
The log overhead is around $2. That's the pump which you should be here for. The bears can't explain to you why they're here. You never hear from them, do you?

Fortune MineralsHi guys,
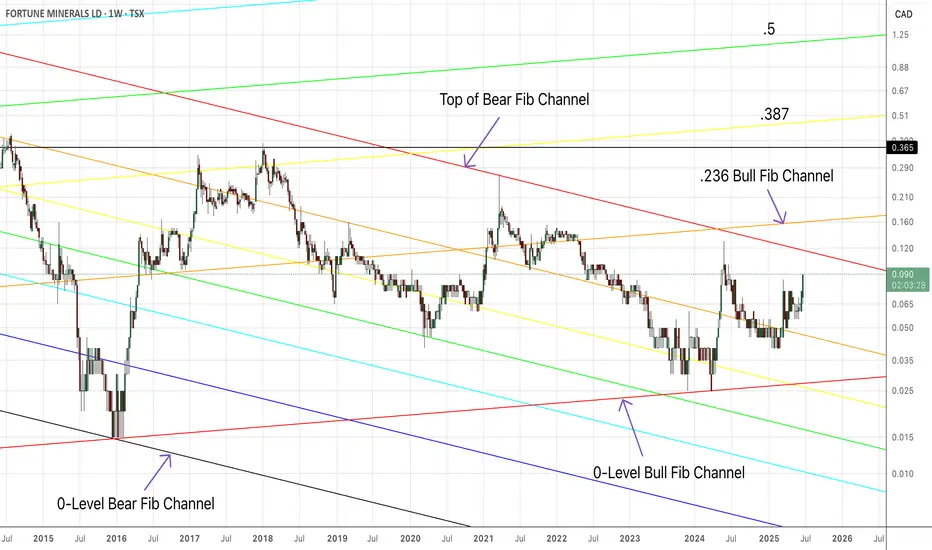
I want to show the technical landscape that FT price finds itself in. I talk a lot about this fib and that fib, but I hope this clarifies things. As I've said before, above the .236 bull fib, it's bullish. That is the major threshold where new market participants come into the picture, and real volume enters. Down below the .236 bull fib is high-risk, high reward zone. So, consider yourself early to the party.
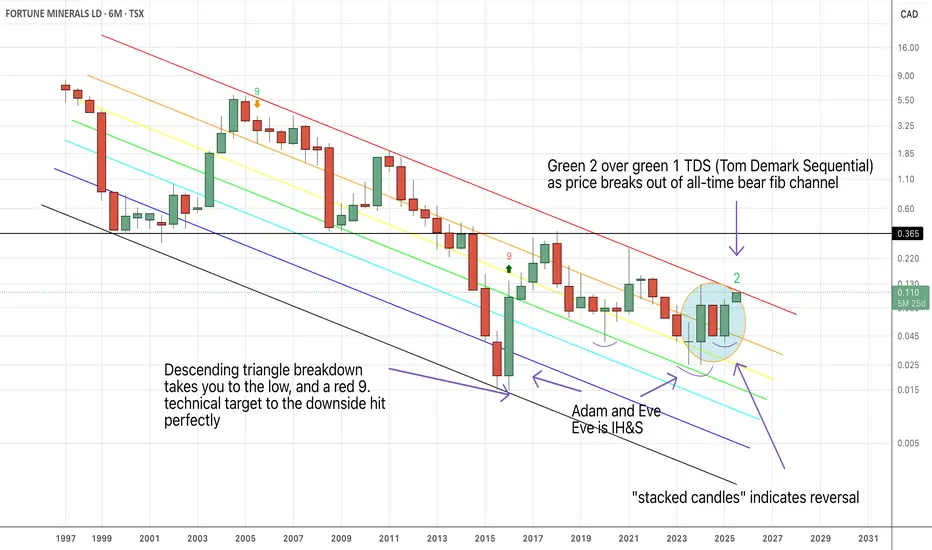
Fortune or folly?We have a breakout on the weeklies, and a target at the top of the funnel. The funnel being the consolidation post-capitulation. We're looking at a recovery, and $.25 is the "neckline", or the "pivot". %.25 is just the beginning, and above that looms the log overhead at $2, which is giving the bears shivers right now.
OBV looks like a breakout coming - an OBV pattern that encompasses the whole "recovery" Adam and Eve, with Eve being inverse head and shoulder. I see this pattern a lot. AISP has the same shape. Many do, so when you begin to see it, trades present themselves. No research needed. All fundamental analysis goes into the trash bin.

FTThe price is above the moving averages, and the moving averages are all stacked bullish. The situation is a royal flush from a technical perspective. You have these long-standing overheads, with the key linear overhead having already been breached. In Log, we still have the 1-level "bear fib" to clear and then land on top of. Once that lifts off, we run into the .236 "bull Fib" (which I have hidden for simplicity). After we clear the .236 bull fib, it means we are truly bullish in FT for the first time in the chart history. Then come's the $.38CAN level, and higher. It in the states here, I'm looking for $2.
This is the first time the price has come to be supported by the moving averages. First time in chart history. The Bollinger Bands are widening. The OBV is near record high levels. All hell is about to break lose.

Fortune MineralsFT is primed to pamp back to $.25USD. Price is consolidating at the .786 "bear fib", and is being compressed under what I believe is a kind of inverse parabola. We shall see, but a return to 1-level bear fib, and $.25 is a fait accompli.
I hate to see guys bailing right as the party gets underway. You sell, and it pumps 16% the next day. That's how it's going to be.

Fortune MineralsThere are multiple technical theories about why FT will break out. OBV is climbing, and I have postulated and proven that OBV is a leading indicator. Every other indicator is rear-ward looking. Looking out the back mirror. That includes moving averages. The price is spending too much time above the .786 “macro bear fib”, and this cannot stand. A breakout is inevitable. There, we have OBV pointing to a breakout, and we have the price near the 1-level bear fib. The only conclusion is a breakout

Fortune MineralsFor those that love volatility like moths love flames, I present to you Fortune Minerals. If you know a more volatile stock, please let me know. I own well over 5M shares, and I’m basically flat in price, and long term. This party is just starting. I’ve been in and out of FT for 15 years. We’re about to witness the first real bullish pump, which prints a higher swing high, and it’s going to be glorious. I know I chart FT too much, but I have a quarter million dollar position, so can you blame me? 1.86m shares traded today. It’s game on.

Fortune MineralsSchwab reports that the on balance volume (OBV) is going up in Fortune Minerals. You’ll never find a nicer tidbit from Schwab, because they prefer to not report on “penny stocks”, even though what is now a penny will soon be a dollar.

FTMDF/FTThese assets should be about the same value in theory, but that’s not the case in fact. Theories are often thwarted by the facts on the ground. The fact is FTMDF and FT are not fungible. You cannot exchange one for the other. They’re independent pools of value, and they’re different assets. We can see that we have increasing volatility between them. The US ticker usually lags behind, but not always. Sometimes it spikes. the US side has even lower volumes than the Canada side, but that can change quickly if the chart confirms bullish. Bullish for the first time. What’s going to happen to FTMDF vis a vis FT? I think we continue the trend of even more volatility between them, and the US ticker spiking against FT.

Fortune or misfortune?It’s absolute despondency for life’r bagholders, of which I include myself. But there are guys like Brian who are real lifer’s and they’re ready to commit herri karri. I say wait. Don’t put yourself in front of a train yet. Sell when you feel like a genius, and buy when others are despondently selling. What’s happening now is just low vol, not really going anywhere, and holding a somewhat elevated level as it consolidates momentary. What can happen next is six-sigma to the upside.

FT converted into USDHi y’all, I converted CAN to USD in the upper, right-hand corner. It puts us below the .236 Fibonacci level for my “projected” macro bull fib. I’m pretty good at this at this point. The level between 0 and .236 is a low volume, high risk, high reward zone. If and once the price overcomes the .236 bull fib, then a new bull run is confirmed, and volume enters. New money and bigger players enter above that US $0.10 to $0.15 zone. For stocks, and all else equal, if we break through the .236, then we expect to see a .618 test. This is just how it is in stocks, and in crypto I’m looking for the .786 fib.
Fat has a good history now, and there’s an all-time linear overhead that we’ve already cleared, and there’s a log overhead around $2, which the bears are not happy to see. A run for the log overhead is a fait accompli.

Fortune MineralsIt makes no sense to the bears why this might break out. They think it’s going to break down instead. It’s going to go to zero? Is that what the bears think? I’m very interested to hear from one of them, and they can enlighten us as to why they believe the price will collapse as we get very close to mine start, and the underlying spot prices of all commodities are pumping. Bears, where are you? Come out from hiding. Don’t troll me, I’m trolling you.

Fortune MineralsToday’s pump in FT has proven my point. My whole thesis relies on the nothing that after the price capitulation, the consolidation since then has been Adam and Eve. Now, this is proven right. Adam was the initial capitulation, and Eve is an inverse head and shoulder. I’ve been saying this, and you can go back and check my records. I own more than 5 million shares of ftmdf, at an average price of US $.055. So, the price went up and tested my average price paid today, before pulling back down. We will see where it ends the day and week, but what a relief to see my chart formation theory become fact. Almost all of my shares are in one term - held over one year. I’m looking for $2 FTMDF, which is just a revisit of the log overhead in FT - which is the only full history. A spike to $1USD puts me at well over five million US dollars, so let’s run this.

Fortune MineralsInteresting day. The volume is low, but has crept up every so slightly over the last couple of days, and then today’s announcement, which puts the project forward a bit, but doesn’t really clear hurdles. Looking to March for news on the sample testing. The price itself may clear hurdles though, as it looks to test the 200 day ma. We shall see. Return to $.10us, and you could see $0.25 pretty quickly.

FTRecord low volatility as recovery Adam and Eve is contained under all-time overhead. This has the effect of compressing the eve, or inverse head and shoulder component of the formation as it gets late, as we are now. Low volatility begets high volatility. I’m betting big that the floor holds, and imaginary overheads evaporate.

FTMDFThis is Adam and Eve in linear. You are blind if you don’t see the descending overhead, and we’re at the right, inverse shoulder of an IH&S, and we have spinning tops. The whole chart history has been bearish, with lower and lower highs. I’m looking for that counter-trend move that prints a fresh higher swing high, which would signal at least an attempt at a new bullish run. Daily candles become bullish after a higher swing high, and then after a higher swing low. If the price begins to revisit the prior neckline after a higher swing low, then it’s assumed at that point bullish.
The overhead resistance is all time overhead resistance in linear. It’s strong overhead, but it’s only theoretical. It means nothing and will be easily overcome with any volume event. Go back to $.10us, and bears will start crapping themselves.

FTThis ticker begins with a descending triangle, into a price capitulation, which sets the low. Then, the recovery looks like a Adam and Eve formation, where the Eve is an inverse H&S. That puts us at the right inverse shoulder. En den? Yes, an den.

Fortune MineralsHey guys. It’s been a long retrace from the last little peak, and we have a breakout of the short-term overhead in the FT price and the On Balance Volume. Let’s see if we can climb back up to $.10US, in which case, the bull party begins in earnest. I own over 4,800,000 units, which makes me top three or four holder of this ticker, so let’s go!!

FT Here's a look at a Gold stock that is very low price and could have the potential to pump!
I don't know much about this company. Keeping an eye on this for Granddad.

Fortune Minerals linearHi, I’m showing the US FTMDF chart in linear. It’s not a complete history, as only FT shows the full history, but what I’m showing is the overhead resistance that keeps getting tested. This will break to the upside. Will I live to see the breakout? I own almost 4.5 million shares and rising. At $.06 USD average. Let’s go!
