Key stats
About HARVEST PORTFOLIOS GROUP INC BLOCKCHAIN TECHNOLOGIES ETF UNIT CL A
Home page
Inception date
Feb 7, 2018
Structure
Canadian Mutual Fund Trust (ON)
Dividend treatment
Distributes
Distribution tax treatment
Ordinary income
Primary advisor
Harvest Portfolios Group, Inc.
The fund tracks an index that invests in two segments: the large cap blockchain segment and the emerging blockchain segment. The large cap segment consists of North American large-cap companies that have direct or indirect exposure to blockchain or distributed ledger technologies, and are included in the GICS Information Technology sector. The emerging blockchain segment consists of North American companies that also have exposure to blockchain technologies but are significantly smaller in size, with a minimum CAD$50 million market capitalization. The index uses a multi-factor model that produces a portfolio of 10 equally weighted companies from the large cap segment, and up to 50 market-cap weighted companies from the emerging blockchain segment. As the emerging blockchain market grows, the index will slowly increase the emerging segment weighting until such time that the entire index is comprised of issuers from the emerging blockchain segment. The index is rebalanced quarterly.
Related funds
Classification
What's in the fund
Exposure type
Technology Services
Finance
Stock breakdown by region
Top 10 holdings

Blockchain technologies VERY BULLISH! Breakout!Look at that beautiful ascending triangle!
It's breaking out now!
I see this stock continuing the uptrend which is bullish for cryptos.
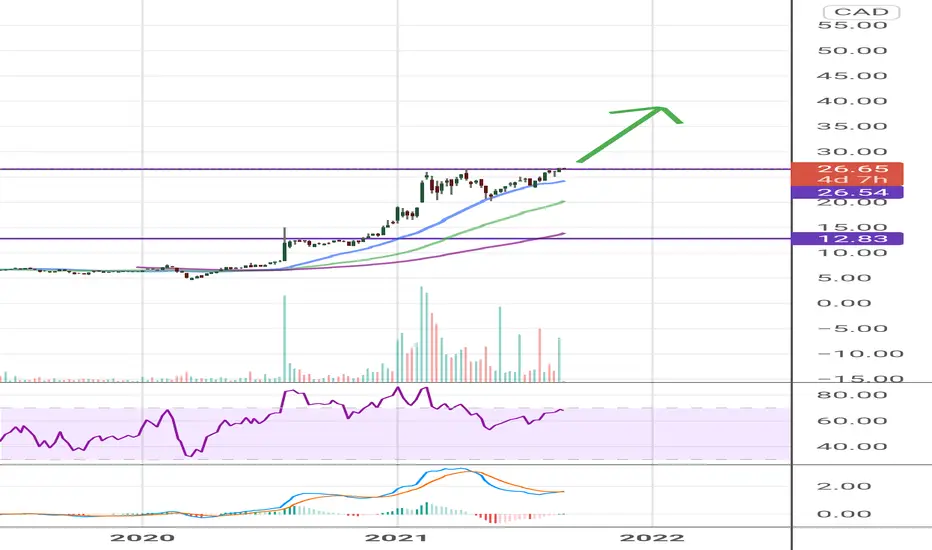
Pullback incoming?*** Only a TA of HBLK, this is not financial advice ***
With the grandiose growth of the ETF HBLK due to the great bull run of Bitcoin, the 1Trillion market cap news and companies joining the asset, In wouldn't be surprised to see a pullback of around 10% until next support of 22.35 or the higher t

See all ideas
Summarizing what the indicators are suggesting.
Oscillators
Neutral
SellBuy
Strong sellStrong buy
Strong sellSellNeutralBuyStrong buy
Oscillators
Neutral
SellBuy
Strong sellStrong buy
Strong sellSellNeutralBuyStrong buy
Summary
Neutral
SellBuy
Strong sellStrong buy
Strong sellSellNeutralBuyStrong buy
Summary
Neutral
SellBuy
Strong sellStrong buy
Strong sellSellNeutralBuyStrong buy
Summary
Neutral
SellBuy
Strong sellStrong buy
Strong sellSellNeutralBuyStrong buy
Moving Averages
Neutral
SellBuy
Strong sellStrong buy
Strong sellSellNeutralBuyStrong buy
Moving Averages
Neutral
SellBuy
Strong sellStrong buy
Strong sellSellNeutralBuyStrong buy
Displays a symbol's price movements over previous years to identify recurring trends.
Frequently Asked Questions
An exchange-traded fund (ETF) is a collection of assets (stocks, bonds, commodities, etc.) that track an underlying index and can be bought on an exchange like individual stocks.
HBLK trades at 21.00 CAD today, its price has fallen −0.57% in the past 24 hours. Track more dynamics on HBLK price chart.
HBLK net asset value is 21.09 today — it's risen 13.48% over the past month. NAV represents the total value of the fund's assets less liabilities and serves as a gauge of the fund's performance.
HBLK assets under management is 24.57 M CAD. AUM is an important metric as it reflects the fund's size and can serve as a gauge of how successful the fund is in attracting investors, which, in its turn, can influence decision-making.
HBLK price has risen by 13.55% over the last month, and its yearly performance shows a 20.14% increase. See more dynamics on HBLK price chart.
NAV returns, another gauge of an ETF dynamics, have risen by 13.48% over the last month, showed a 43.91% increase in three-month performance and has increased by 22.12% in a year.
NAV returns, another gauge of an ETF dynamics, have risen by 13.48% over the last month, showed a 43.91% increase in three-month performance and has increased by 22.12% in a year.
HBLK fund flows account for −3.26 M CAD (1 year). Many traders use this metric to get insight into investors' sentiment and evaluate whether it's time to buy or sell the fund.
Since ETFs work like an individual stock, they can be bought and sold on exchanges (e.g. NASDAQ, NYSE, EURONEXT). As it happens with stocks, you need to select a brokerage to access trading. Explore our list of available brokers to find the one to help execute your strategies. Don't forget to do your research before getting to trading. Explore ETFs metrics in our ETF screener to find a reliable opportunity.
HBLK invests in stocks. See more details in our Analysis section.
HBLK expense ratio is 1.34%. It's an important metric for helping traders understand the fund's operating costs relative to assets and how expensive it would be to hold the fund.
No, HBLK isn't leveraged, meaning it doesn't use borrowings or financial derivatives to magnify the performance of the underlying assets or index it follows.
In some ways, ETFs are safe investments, but in a broader sense, they're not safer than any other asset, so it's crucial to analyze a fund before investing. But if your research gives a vague answer, you can always refer to technical analysis.
Today, HBLK technical analysis shows the buy rating and its 1-week rating is buy. Since market conditions are prone to changes, it's worth looking a bit further into the future — according to the 1-month rating HBLK shows the strong buy signal. See more of HBLK technicals for a more comprehensive analysis.
Today, HBLK technical analysis shows the buy rating and its 1-week rating is buy. Since market conditions are prone to changes, it's worth looking a bit further into the future — according to the 1-month rating HBLK shows the strong buy signal. See more of HBLK technicals for a more comprehensive analysis.
No, HBLK doesn't pay dividends to its holders.
HBLK trades at a premium (0.28%).
Premium/discount to NAV expresses the difference between the ETF’s price and its NAV value. A positive percentage indicates a premium, meaning the ETF trades at a higher price than the calculated NAV. Conversely, a negative percentage indicates a discount, suggesting the ETF trades at a lower price than NAV.
Premium/discount to NAV expresses the difference between the ETF’s price and its NAV value. A positive percentage indicates a premium, meaning the ETF trades at a higher price than the calculated NAV. Conversely, a negative percentage indicates a discount, suggesting the ETF trades at a lower price than NAV.
HBLK shares are issued by Harvest Portfolios Group, Inc.
HBLK follows the Harvest Blockchain Technologies Index - CAD. ETFs usually track some benchmark seeking to replicate its performance and guide asset selection and objectives.
The fund started trading on Feb 7, 2018.
The fund's management style is passive, meaning it's aiming to replicate the performance of the underlying index by holding assets in the same proportions as the index. The goal is to match the index's returns.