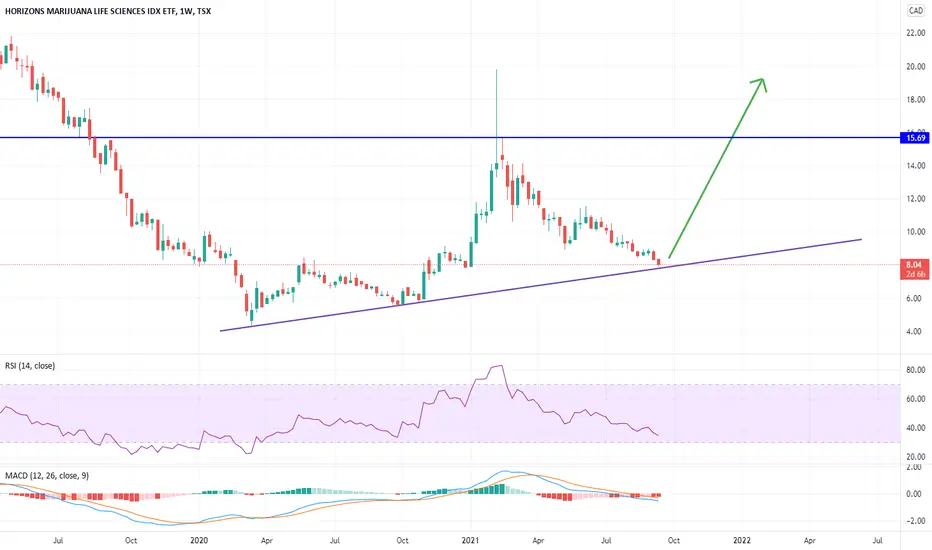
Buy Before the End of ProhibitionYou wish you could have owned alcohol companies at the end of prohibition. Here's your second and last change at a trade like this. Marijuana is a far less destructive and harmful drug than alcohol with many medical uses and now more socially acceptable than ever. Just wait until mdma and mushrooms
Key stats
About GLOBAL X INVESTMENTS CANADA INC. MARIJUANA LIFE SCIENCES INDEX ETF
Home page
Inception date
Apr 4, 2017
Structure
Canadian Mutual Fund Trust (ON)
Dividend treatment
Distributes
Distribution tax treatment
Ordinary income
Income tax type
Capital Gains
Primary advisor
Global X Investments Canada, Inc.
The fund invests in equity securities as well as ADRs of companies substantially in the same proportion as its underlying index. These securities are listed on stock exchanges in North America, and are classified as life sciences companies (including those involved in biopharmaceuticals, medical manufacturing, distribution, and bio products) as well as other companies with significant business activities in the marijuana industry. Rebalanced quarterly, the portfolio is market-cap-weighted with 10% maximum capping for each constituent.
Related funds
Classification
What's in the fund
Exposure type
Process Industries
Health Technology
Finance
Stock breakdown by region
Top 10 holdings

BUY HHMJ CALLS Buying staggered calls over 3 month frame.
Once again back in after almost 3 years.
FOMO is gone fair value is near and some great swing trade near!

HMMJ Oversold - Time to AccumulateCannabis is still in the early fases off acceptance and adoption. Wild swings are expected.
I expected this drop, looking at my previous anlyses. For long term holders this is no big deal.
Looking at the RSI on the daily level, it is oversold, also touching the 0.236 FIB level. This is a perfect bu

HMMJ, time to buy?HMMJ , could be a great buy. Price almost reached the ATL. It also break on the trendline or descending channel. But it could also be another faker.


Pot stocks on watchHMMJ has broken out of this long term down trend. The sector could gain some momentum again if there is any favourable news about easing US laws regarding MJ. I would expect resistance coming into the 236 fib retracement. I will take the sector more seriously if price can consolidate below that le

HMMJ getting close to start a bullish movementThe weed sector is getting close to start a new bullish uplgeg.

This could be the start of an amazing reversal to the upside. Very good entry point at 7.36, lets see how far this move will take us.

LongMajor trend lines meeting, into major demand (Monthly/Weekly), all indicators pointing to the upside and reversal.

HMMJ great buy opportunity at 8$ ON SUPPORT!I am loading up on marijuana stocks now!
I have a feeling it's going to bounce up from here! BULLISH ON HMMJ!
See all ideas
Summarizing what the indicators are suggesting.
Oscillators
Neutral
SellBuy
Strong sellStrong buy
Strong sellSellNeutralBuyStrong buy
Oscillators
Neutral
SellBuy
Strong sellStrong buy
Strong sellSellNeutralBuyStrong buy
Summary
Neutral
SellBuy
Strong sellStrong buy
Strong sellSellNeutralBuyStrong buy
Summary
Neutral
SellBuy
Strong sellStrong buy
Strong sellSellNeutralBuyStrong buy
Summary
Neutral
SellBuy
Strong sellStrong buy
Strong sellSellNeutralBuyStrong buy
Moving Averages
Neutral
SellBuy
Strong sellStrong buy
Strong sellSellNeutralBuyStrong buy
Moving Averages
Neutral
SellBuy
Strong sellStrong buy
Strong sellSellNeutralBuyStrong buy
Displays a symbol's price movements over previous years to identify recurring trends.
Frequently Asked Questions
An exchange-traded fund (ETF) is a collection of assets (stocks, bonds, commodities, etc.) that track an underlying index and can be bought on an exchange like individual stocks.
HMMJ trades at 7.04 CAD today, its price has fallen −0.28% in the past 24 hours. Track more dynamics on HMMJ price chart.
HMMJ net asset value is 7.10 today — it's risen 7.19% over the past month. NAV represents the total value of the fund's assets less liabilities and serves as a gauge of the fund's performance.
HMMJ assets under management is 46.11 M CAD. AUM is an important metric as it reflects the fund's size and can serve as a gauge of how successful the fund is in attracting investors, which, in its turn, can influence decision-making.
HMMJ price has risen by 6.99% over the last month, and its yearly performance shows a −36.92% decrease. See more dynamics on HMMJ price chart.
NAV returns, another gauge of an ETF dynamics, showed a 4.04% increase in three-month performance and has decreased by −36.21% in a year.
NAV returns, another gauge of an ETF dynamics, showed a 4.04% increase in three-month performance and has decreased by −36.21% in a year.
HMMJ fund flows account for −11.79 M CAD (1 year). Many traders use this metric to get insight into investors' sentiment and evaluate whether it's time to buy or sell the fund.
Since ETFs work like an individual stock, they can be bought and sold on exchanges (e.g. NASDAQ, NYSE, EURONEXT). As it happens with stocks, you need to select a brokerage to access trading. Explore our list of available brokers to find the one to help execute your strategies. Don't forget to do your research before getting to trading. Explore ETFs metrics in our ETF screener to find a reliable opportunity.
HMMJ invests in stocks. See more details in our Analysis section.
HMMJ expense ratio is 1.01%. It's an important metric for helping traders understand the fund's operating costs relative to assets and how expensive it would be to hold the fund.
No, HMMJ isn't leveraged, meaning it doesn't use borrowings or financial derivatives to magnify the performance of the underlying assets or index it follows.
In some ways, ETFs are safe investments, but in a broader sense, they're not safer than any other asset, so it's crucial to analyze a fund before investing. But if your research gives a vague answer, you can always refer to technical analysis.
Today, HMMJ technical analysis shows the neutral rating and its 1-week rating is sell. Since market conditions are prone to changes, it's worth looking a bit further into the future — according to the 1-month rating HMMJ shows the sell signal. See more of HMMJ technicals for a more comprehensive analysis.
Today, HMMJ technical analysis shows the neutral rating and its 1-week rating is sell. Since market conditions are prone to changes, it's worth looking a bit further into the future — according to the 1-month rating HMMJ shows the sell signal. See more of HMMJ technicals for a more comprehensive analysis.
Yes, HMMJ pays dividends to its holders with the dividend yield of 4.46%.
HMMJ trades at a premium (0.21%).
Premium/discount to NAV expresses the difference between the ETF’s price and its NAV value. A positive percentage indicates a premium, meaning the ETF trades at a higher price than the calculated NAV. Conversely, a negative percentage indicates a discount, suggesting the ETF trades at a lower price than NAV.
Premium/discount to NAV expresses the difference between the ETF’s price and its NAV value. A positive percentage indicates a premium, meaning the ETF trades at a higher price than the calculated NAV. Conversely, a negative percentage indicates a discount, suggesting the ETF trades at a lower price than NAV.
HMMJ shares are issued by Mirae Asset Global Investments Co., Ltd.
HMMJ follows the North American Medical Marijuana Index - CAD. ETFs usually track some benchmark seeking to replicate its performance and guide asset selection and objectives.
The fund started trading on Apr 4, 2017.
The fund's management style is passive, meaning it's aiming to replicate the performance of the underlying index by holding assets in the same proportions as the index. The goal is to match the index's returns.