LAC trade ideas

LITHIUM AMERICAS CORP - BULLISH TRENDLithium Americas Corporation (NYSE:LAC)
No of HFs: 12
Total Value of HF Holdings: $33 Million
One of the largest producers of lithium, Lithium Americas Corporation is ranked tenth in our list of 11 best lithium stocks to buy now. The company owns large-scale assets located in Argentina and Nevada. LAC focuses on the development of the Thacker Pass project. LAC was acquired by FMC Corporation in September 1985. During the third quarter of 2020, the company reported a loss of $6.5 million or 7 cents per share.
There were 12 hedge funds that held positions in LAC by the end of December, compared to 3 funds in the third quarter. The biggest stakeholder of the company is Axel Capital Management, with 780 thousand shares, worth $9.7 million.
Massif Capital mentioned LAC in its Q4 2020 investor letter:
“Selling covered calls on Lithium America (LAC) contributed roughly 0.75% to the portfolio’s quarterly return. The covered calls we sold were laddered and had increasing strike prices at points at which we would have trimmed the position for portfolio management purposes. The volatility of Lithium America’s equity made the calls a remunerative opportunity. We believe LAC may have a long way to go before it is appropriately valued, but we will continue to use covered calls to trim the position size should the opportunity present itself.
We first evaluated LAC in April of 2019 and invested in February 2020. At the time of our investment, a discounted cash flow analysis of the firm’s projects produced a $6.5 valuation versus the share price of roughly $2.8. Today, a year later, we think LAC is worth $18 per share. What changed over the last 12 months such that we revised our estimate up by 170+%?
1. The risk associated with project development, and 2. Time to production
LAC’s South American brine operation secured sufficient funding to bring the project to commercial production (financial de-risking). Their North American clay project received critical environmental permits and made substantial progress on the firm’s processing technology to turn lithium-sulfur into lithium salts (operational de-risking). These developments allowed us to lower the discount rate used on future cash flows to reflect where LAC sits in their development cycle. LAC is also one year closer to production, which means cash flows are accretive to the firm sooner.
In either scenario, a shared thread among most growing businesses is elevated volatility. Perhaps obvious, but again, consider the valuation ramifications. Discounted cash flow analysis treats volatility as risk, and value is subtracted from the business. Option analysis treats volatility as an opportunity and rewards the potential asymmetry. Growth investors frequently think in terms of options, traditional value more in terms of cashflows. Tangible asset businesses, which are historically the value investor’s domain, now need to be evaluated with greater attention being paid to both aspects of the companies future, with investors’ judgment determining where the majority of the weight lies in the final intrinsic value calculation.
We want to poise an open question: how comfortable are you valuing a capital-intensive, pre-revenue R&D operation, selling a compelling product into a market that does not yet exist (hydrogen producer, electric vehicle charging company) or an incumbent that fundamentally changed their business model without changing their product (green aluminum, or steel, a coal-burning utility that is now a fast-growing renewable utility)?”

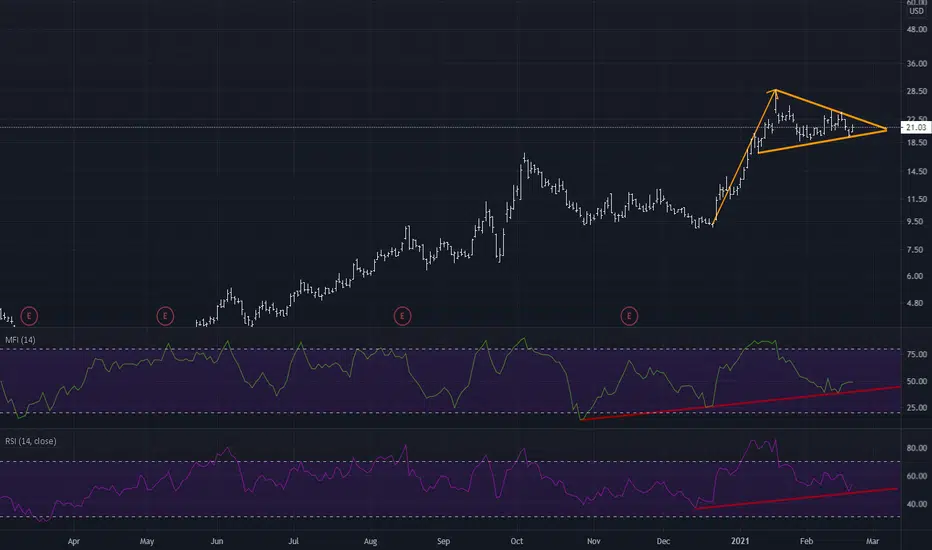
Sideways to slight downtrend Double bottom as indicated. Price action seems to be going to retest key s/r with declining bearish volume. Watching if price can hold above it for a retest of the 4H resistance neckline, and rising MACD.


$LAC Bounce levels w Harmonic potential (BAt)For @zumaTech, Hope this helps, It nneeds to regain 618% or it could fall further

LAC - Lithium PlayYou throw enough $h!t at the wall - some of it will stick. If we hold 200MA - lights out, cosmos, Gagarin....Hello Laika
Biden and his "eco" friendly agenda will run this up to the moon. Check out Lithium Americas website. Not your ordinary 2 dudes in the basement operation that you typically like to buy. Mega potential.

$LAC Target 24.76 for 27.56% Or next add level is at 14.06$LAC Target 24.76 for 27.56%
Or next add level is at 14.06
I am not your financial advisor. Watch my setups first before you jump in… My trade set ups work very well and they are for my personal reference and if you decide to trade them you do so at your own risk. I will gladly answer questions to the best of my knowledge but ultimately the risk is on you. I will update targets as needed.
GL and happy trading.


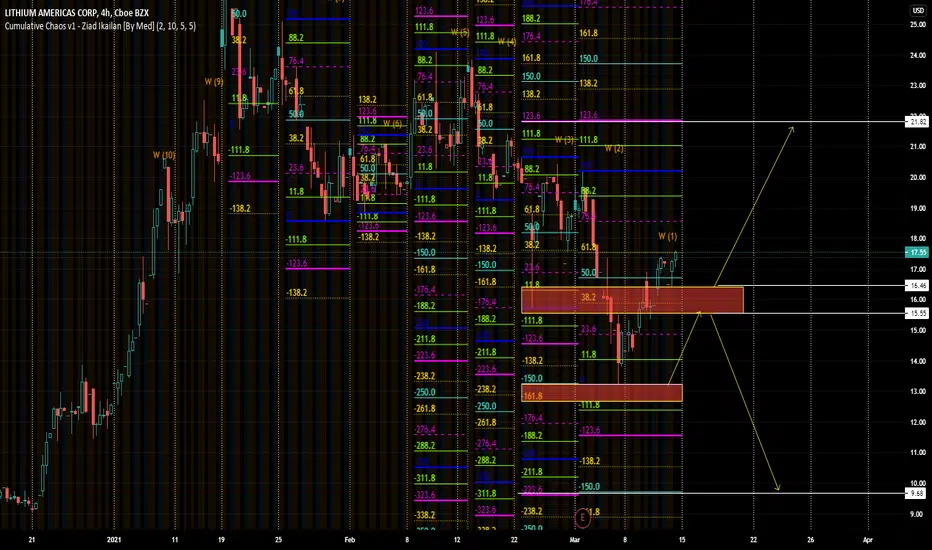
LITHIUM H4 (cumulative chaos)To buy now is still above the separation zone , but if it breaks through the specified area, it will be sold......Please follow up my friends
LAC Nice Touch To SupportLAC bounced off support and is ready for a very strong green week. Bullish on them for the long-term as well; I consider this to be an extremely good buying opportunity. Good Luck!

Gartley pattern $LAC-- Top watch for me See chart for $LAC long set up. Focus on pin bar at trigger and daily inside bar over 15.35, might go big here

LAC$LAC- EV battery (lithium)- will likely go down towards the 200 day EMA before it heads up to test the channel’s resistance.

Is TSLA actually a reflation / commodity-style trade? The correlation between TSLA prices and lithium prices is remarkable (we are using the stock prices of two lithium miners with low diversification as a proxy- so more diversified Albermarle is not included - which is obviously an imperfect proxy). Movements in the price of the largest US-focused lithium miner LTHM explain 79% of the variation in TSLA's price since 2018. imgur.com (Linear Regression Analysis)
A cross correlation analysis suggests no consistent lag between and TSLA. This means that current day (and current week) LTHM movement correlates best with TSLA. So it's not really TSLA driving LTHM, or vice versa.
1. Weekly returns were aggregated and compared, and the Pearson Correlation actually suggests that prior week LTHM return has some predictive value for TSLA current week returns. imgur.com The volatility of returns as a % make linear regression a sub-optimal tool to use here. We used binary logistic regression which somewhat confirmed these conclusions (71% accuracy).
2. We looked to see if variations in the 10yr yield explained variations in TSLA's stock price (making TSLA more like a tech company) and perhaps then affected lithium producers downstream. We found that, prior to 2020, the Pearson correlation between TSLA and TNX was positive (0.36); in early 2020, it was negative (-0.42 yields fell and TSLA rose out of the March lows) and, since August, strongly positive (0.86). I included a more traditional tech company (AMZN) for comparison which clearly has a negative relationship with 10-year yields throughout nearly all periods.
3. The visual chart shows a number of continuation patterns ("pauses") since the March 2020 lows. In most instances, TSLA and LTHM corrections & consolidations occur simultaneously, and in the vast majority of instances, LTHM topped slightly prior to TSLA.
4. All 3 assets show hammer reversal-type patterns within falling wedges that are quite similar to many previous iterations that resolved bullishly.
Until further notice, TSLA, LTHM, and another US-based lithium producer (LAC) appear to be ending yet another falling wedge pattern to reverse to bullish upside. And, thus, I am cautiously bullish on all 3. However, for me, LTHM's breakout appears slightly stronger than that of the other two, so I consider it the preferred trade. LAC could be the highest upside trade of the 3 given its outperformance of the other two since the March lows.


$LAC Top watch for me Please see chart, over noted range break w volume high i will be long too (noted on chart)


Tesla's Overuse of Lithium Batteries Could Make This SoarTesla has been using lithium batteries like crazy, and that could mean that they will start needing to purchase more lithium. They are currently in a deal with a Chinese company for this, but If they start needing more (which they will), they will have to start buying from smaller companies like Lithium Americas. They are quite a safe investment, a stable company with decent profits and income, so its a good idea to buy for long term. Good Luck!

Look for push to retest highsLast time we saw this sort of price action, we pushed to the high 20's.
If it weren't for the madness that occurred yesterday this would be well on its way. So lets just say thanks for the dip buying opportunity and move on.
Entry: 20.80-21.50
SL: 20.25 (Lows of yesterday)
TP1: 24
TP2: 28
TP3 (breakout): 30
Not financial advice


LAC 08-02-2021 LongAsset and Time frame -LAC,1H,4H
Entry Price -20.80
Exit(Stop Loss) -19.58
Exit(Take Profit) -25.10, and another at 27.65
Technical Analysis -Price was completing an impulsive wave on the daily, and now finished making a small correction to resume the uptrend, price was moving sideways until it reached a bearish trend line, which the price broke with a decent amount of momentum on the hourly chart, the price has failed to reach oversold on the 1H chart, and on the 4H price has closed above the 100 MA.
I would like to hear your opinions and what can I do to improve, many thanks

LAC - reversal after decent pull backLac - lithium stock (EV strong demand)
Pulled back, tested the level,
Now ready to reverse
