Pivot Point for SA? Bulls Ready to Take Over?If SA can break through the key level at 17.5, this may work its way back up to it's ATH established mid October and maybe surpass it. Key level identified at the area of my solid white uptrend line and the 50SMA on the daily chart, and the area right above the 10EMA on the weekly chart.
Earnings is on the 15th so you would want to pay attention to that.
The few areas of potential resistance to take note of are at 18 and 19. If SA gains momentum, I expect some pause or a pull back at 19 or 20.5 to help it gear up to break through to a new ATH.
SEA trade ideas

SA potentially still holding up?The key level to monitor here is $18. SA took a tumble after establishing a recent high (not ATH) at 20.55. As of Friday it is still holding its long term uptrend line that started in February.
How I would play this:
A call option to capture the swing on the 4h chart when price closes above of 18, with a stop at 17.5. If it works and I can cover my initial cost, I will keep a few shares through earnings. Profit Target 1) 19 and 2) 20.

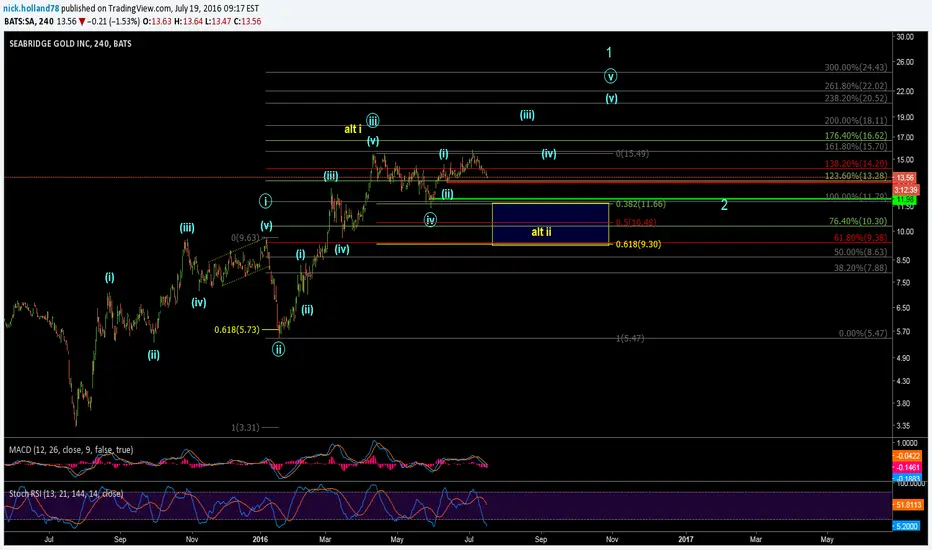
Right-Angled Ascending Broadening Formation Partial-RiseWe've broken down after a partial rise fakeout i'm going to be buying put options for this ticker as i'm really not that bullish on commodities anymore at the moment.

Nasty amounts of break divergence with weekly breakdownThe weekly seems to be showing weakness and confirming that weakness by breaking down a bearish structure known as a Right-Angled and Ascending Broadening Formation; The measured move should take us down to test the 61.8% retracement at the very least before seeing any sort of major attempt at bullish continuation.

IRON TARIHi guys!
New Iron condor, chek my last trades, and get my script for free!
Enjoy your wallet!
Tari.

Iron TariHi guys,
just as described in my strategy we have 4weeks 10% strikes.
Themaths are simple, just have a look at the strategy, and all the iron conodrs I shared in "ideas".
Enjoy your wallet!
Tari.

SA Ready To RipGold has been consolidating for a while and SA (gold miner w/ some silver/copper exposure) has held up very nicely. Of all of the gold miners this would be my focus. Close to a breakout. If gold can break the current downtrend SA should be hitting new highs quickly. Waiting for a breakout to go long.

SA hoping to continue after bull flagSA has formed a bit of a large bull flag. It has maintained support at $17 and 100 EMA is also helping it, too.
I am buying at $19.40 and I will stop if it goes below that trend line.
Hopefully it'll break through the flag.

has some potentialOverall i think the stock is undervalued right now. It should be around $19.71, and with he recent news release of initiation of drilling resources i can see this target being hit.

[Long] SeabridgeCould turn into a nice trend on this weeklong test of the 50ma and now break from bull flag.
It is a lagger and has not really participated in the gold rally over the year. It is sitting on an absurd amount of long term price support.


SA - 2hrI was early on Seabridge Gold. Should have stopped out but the swing position was small...may look to add to this position on a retrace.
SA dipped below ideal wave (2) support but has a solid impulsive looking move so far off the low. Need to see something like this 1-2 play out if wave (3) is indeed underway.

SA - DailySeabridge bottomed earlier than many miners. So far it topped at the 100% extension (log-scale). That has me concerned as it would normally count as the (3) of P3. I've annotated it as an extended (1) of P3 instead since the retrace is too deep for a 4th wave, imo. That'll extend targets for (3) and P3 beyond normal expectations, but that's not entirely unreasonable for metal-related stocks.
What has me concerned is that the 100% extension is also a typical A=C target in a corrective move...see red oval.
Getting close to the lower end of retrace support, and may wind up stopping me out.

SA - DailyLooks like the former alt 1-2 played out. Not clear yet that this correction is complete, but a good add for long-term holds IF you're bullish miners.
I've been adding miners like Seabridge all morning.

SA - 4hrSimilar KGC and GG, Seabridge Gold also has a dubious start to this impulsive rally. My stop is just below price, in red, at the (ii) of v of 1 level. Will look for support in the yellow alt ii IF stopped out.

pennies to thousands gold silver basic materials candidatestrong on 133 minute chart get our book on different time charts on amazon
on daily money flow good
macd good on daily
relative strength excellent
cci and percent r good
above clouds

SA LONGSA looks to be oversold (blue circles) and consolidating. RSI and %R are very oversold. Typically a run up is expected (but not always) into the red circle sell points. Stochastics strategy is indicating a Long Entry (LE). The pattern forming could look like a bear flag, but is very similar to a turn pattern from 11-5-2014 ( see gold bars). TSI looks to be starting a move higher. This is just a possibility. With gold and GDX moving higher I expect SA to join in.

Double bottom in Seabridge Gold (SA)- Double bottom completed over 6.65-6.76 area.
- Nothing in my indicators at moment to suggest a false breakout
- Should trade nicely along AB rising channel
- Bullish crossover in 50/200 day EMAs should continue to support bullish momentum
- Pullback to point C (9.96-10.36 area) may represent a nice buying zone
Looking for target at prior lower high at 15.00 while bullish views should be reconsidered on loss of support at 7.98. Risk/Reward ratio bout 2.23
