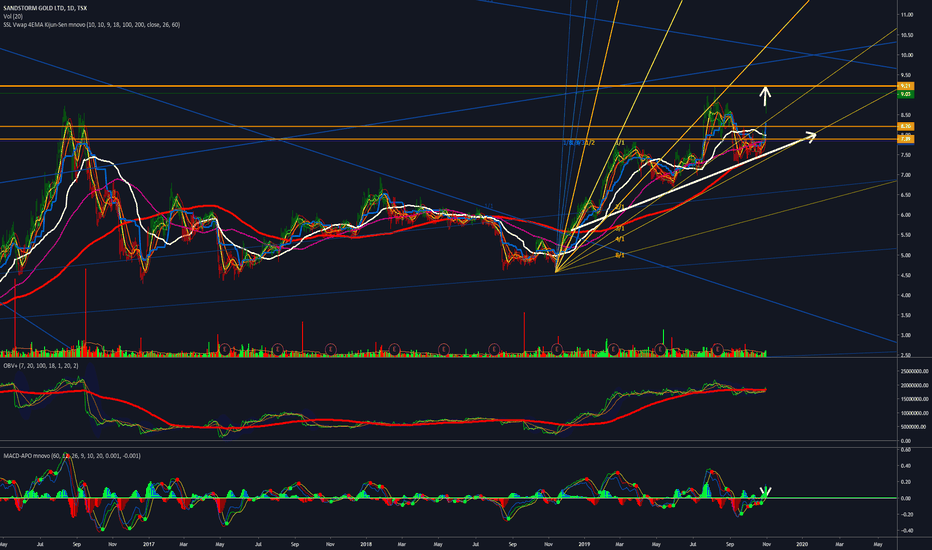
Sandstorm- A Golden Kool-Aid man2020 Revenues = Record 93 Million. That's with several mine shutdowns due to covid. I believe most if not all of those mines were restarted due to being declared essential businesses!
Gold started 2020 at $1,525 and rose to $1,800 USD in July. Was in a range of $1,800 to $1,900 the last 6 months of 2020.
Sandstorm is about the same price now ($6.99 USD 1/11/21) as it was in January of 2020 with gold/silver/copper at much higher prices, no debt, and lots of cash on hand.(100 mil?)!
2021 should be a another great year for Sandstorm which now has ZERO DEBT to my knowledge. If gold stays in range of $1,800 to $1,900 without any mine shutdowns they will easily break another record. However If Silver/Copper can continue to rise and gold break above $2,075 USD then Sandstorm is going to smash through previous records like the Kool-Aid man.
SSL trade ideas
Sandstorm, call the crisis line!Sandstorm has a great future however it has fallen below the last support line as I see it. As part of my long term holdings I will be adding big time if we get another COVID crash as we did back in March 2020. SAND is cashed up with no debt and a nice credit line so perhaps they will add another nice deal coming up. "Price is what you pay and value is what you get-RR"
SAND: Divergence->Left Turn at 50%?Currently -general downtrend, bottoming out on the daily lows (50% retrace)-notice the macd+rsi divergence against the general downtrend
-look at previous divergences when macd+rsi travel in the opposite direction
-flat lows, then reversal when macd+rsi diverge
- GAP filled above 50% retrace of march lows and beginning of bull run.
-~3 bounces around 50% retrace
-no more gaps to fill from rapid accent in Spring 2020
-one gap to fill
Also, where should i place fib and gaps: on the wick or candle?
Also, divergence around the top... a bit of a stretch?
[Long] SAND hoping for this dipNice job painting the pattern on this fundamentally great Gold royalty company.
If we get some panic selling, I will leg into this aggressively and hold for the LT.
This stock is trading at its 2012 levels and while Gold is flat relative to its 2012 peak, one has to consider the amount of growth, cash flow, and royalties this company has accumulated in 8 years.
DXY GOLD Mining stocks. Gartley pattern.9.15.20 The DXY looks like a failed Bear Trap and is probably going lower...possibly into a bullish Gartley pattern. Whatever happens to the DXY, expect a reciprocal move in gold and silver. This is a difficult market because the dollar is in a fairly narrow range and narrow ranges create more difficulty with less opportunity and higher risk in relation to a realistic reward. it is essentially a non-directional market which is difficult for both buyers and sellers. Normally for me, if I see a market like that I figure they are too smart for me and I don't bother with the market which can go on for days, weeks, and even months. I talk about a potential second chance at the gold and silver miners.
[Long] SANDI admit, I'm caught a little flat footed because I was "buying the dip" at higher levels.
But broadly, I see one of my favorite gold royalty companies dipping to the 50ma.
I could have been more patient to pick up these prices, instead of buying earlier dips. But, it is what it is.
There could still be more downside / consolidation, but iMO the slower this moves the more bullish it is longer term.
Short SANDSince the end of 2018, gold miners started a new bull trend (weekly chart). Sandstorm followed the same path up until the midst of February 2020. There is a clear divergence between Sandstorm's price and the RSI. The RSI was showing that the stock was giving up momentum.
Price has just touched weekly supply zone. I see more selling pressure in this stock. A good target could be in the level of $2.50 and $3.00
We will see.


