TLRY trade ideas

$TLRY Ready for Measured Move Takeoff Marijuana stocks look to have finally bottomed for a real short term rally, that can maybe turn into something else. I would think people are booking profits from being short all year and that tax loss selling in these names are done.
In any case, the whole space looks ready for a real short cover rally. I have here some channel analysis that is providing some measured move targets.

Inverse head and shoudlers in playTilray has finally hit the local bottom and we are seeing an Inverse head and shoudlers reversal pattern.
Buying here provides great risk/reward ratio however still have to pay attention to the index overall.
###NOT FINANCIAL ADVICE###

Tilray for the fishermanSpecial request chart
But I’m along dcaing weed stonks
It looks to be breaking out
This next couple of months is key
Mid term target is 17.50 but if it breaks up from there and if we’re right about stonks still being bull overall and if dollar has topped- weed bubble 2.0 is a possibility
GRI 2022

Tilray breaking out or back to the bottom of 2.65?This is not an advice. Just a journey for myself and for those who want to share thoughts.
I have been following this stock for 3 years now.
Absolute bottom is 2.65, could this be broken? Will we ever see 9 again? It seems so far away.

TLRY close to breaking outIt looks like if $TLRY breaks the downtrend shortly and confirm the break out it could run up to the 200wma or longer term downtrend. With some bullish divergence on the weekly chart this adds to the bullish case.

TLRY - Things May Be About To Turn Bullish For WeedMulti time frame bullish RSI divergence is coming in for TLRY and could be a large pop in the pipeline.
That said this one mostly takes from, not gives to buyers so a lot of care is required.
Not advice.
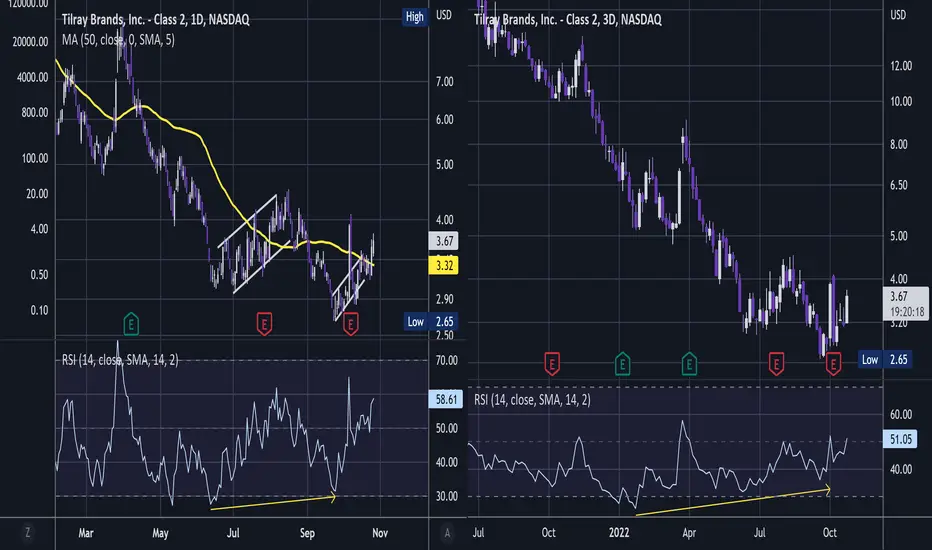
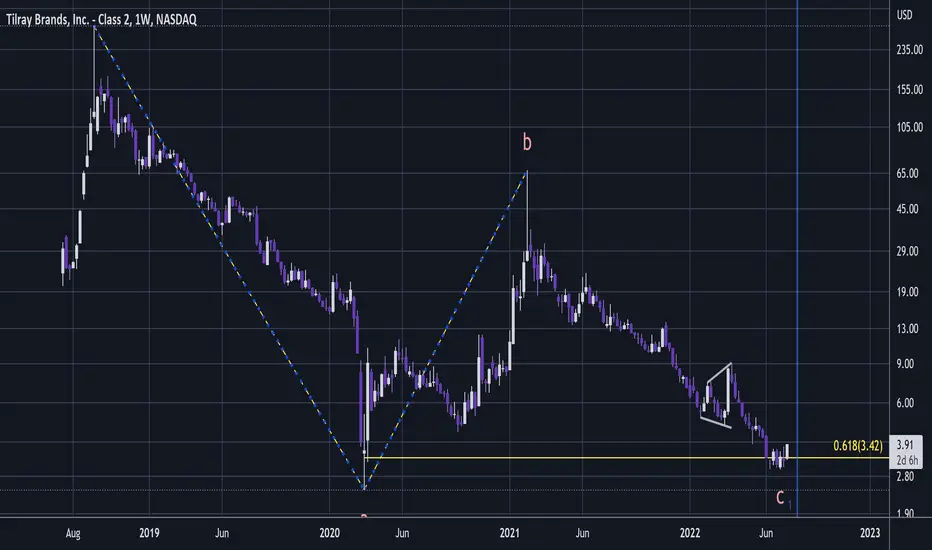
TLRY - Looks Set To Break Out With Indexes 🚀🌒TLRY appears to be consolidating my previous first target 1:0.618 @ $3.42 just as NDX looks set to break out and so I think this is the anchoring fib that will prove to either be the bottom or a significant low.
Also earnings is coming up shortly and would you believe the 1:1 fib time extension for this 3 wave pattern is almost exactly at earnings.
Its as if its been scripted 😄.
So I think TLRY is about to rocket 🚀.
Bought LEAP puts due to high IV which can pay for my calls, alternatively can buy the stock.
Not advice.
Final Showdown Before Deadcat bounceI am waiting for the last shoe to drop before going long on the deadcat bounce.

TLRY all about that 4.20I know it may seem like a joke, but actually 4.20-4.30 area is the resistance point for TLRY, over that and it could be a very large move up. Good luck

Not Out of the Wood Part 2I think we will have a deadcat bounce with the mid term election coming up and then drop right back down to all time low. $1.xx long term target for now.

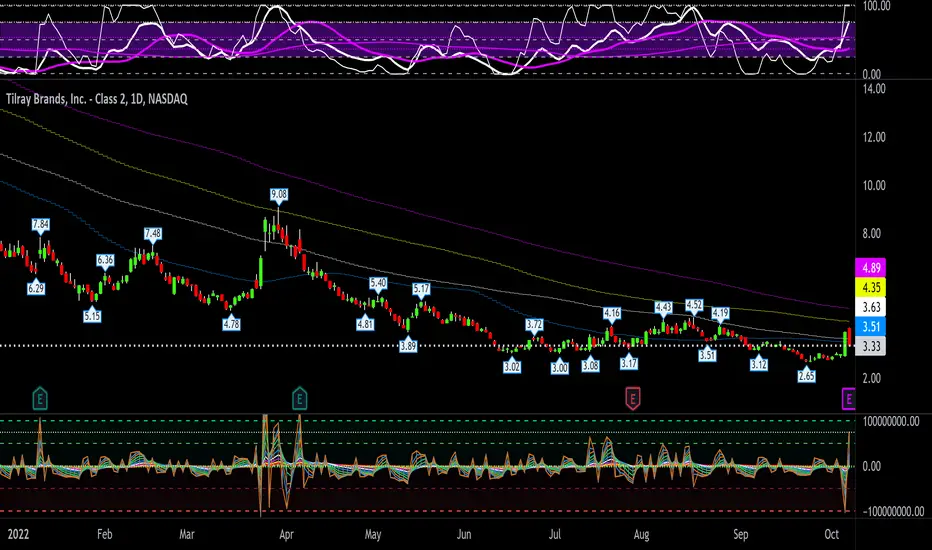
Tilray moving averagesYesterday cannabis stocks moved higher on news. Here's TLRY moving averages on the 1-day chart:
SMA50 = 3.51
SMA100 = 3.63
SMA150 = 4.35
SMA200 = 4.89
52wk high = 13.95
52wk low = 2.65
Do your own due diligence, your risk is 100% your responsibility. This is for educational and entertainment purposes only. You win some or you learn some. Consider being charitable with some of your profit to help humankind. Good luck and happy trading friends...
*3x lucky 7s of trading*
7pt Trading compass:
Price action, entry/exit
Volume average/direction
Trend, patterns, momentum
Newsworthy current events
Revenue
Earnings
Balance sheet
7 Common mistakes:
+5% portfolio trades, capital risk management
Beware of analyst's motives
Emotions & Opinions
FOMO : bad timing, the market is ruthless, be shrewd
Lack of planning & discipline
Forgetting restraint
Obdurate repetitive errors, no adaptation
7 Important tools:
Trading View app!, Brokerage UI
Accurate indicators & settings
Wide screen monitor/s
Trading log (pencil & graph paper)
Big, organized desk
Reading books, playing chess
Sorted watch-list
Checkout my indicators:
Fibonacci VIP - volume
Fibonacci MA7 - price
pi RSI - trend momentum
TTC - trend channel
AlertiT - notification
tickerTracker - MFI Oscillator
www.tradingview.com
TLRY Short | LT entry target $2.08NASDAQ:TLRY
Tilray Brands Inc. engages in the research, cultivation, production, marketing, and distribution of medical cannabis products. It operates through five segments: Cannabis Business, Distribution Business, Beverage Alcohol Business, Wellness Business, and Business Under Development. The company provides medical and adult-use cannabis products; pharmaceutical and wellness products; beverage alcohol products; and hemp-based food and other wellness products. It offers its products to retailers, wholesalers, patients, physicians, pharmacies, clinics, hospitals, governments, and researchers. The company operates Tilray Medical, a medical platform that provides GMP-certified flowers, oils, vapes, edibles, and topicals. It has operations in Canada, the United States, Europe, Australia, New Zealand, Latin America, and internationally. The company was formerly known as Tilray , Inc. Tilray Brands Inc. was incorporated in 2018 and is headquartered in New York, New York.
TLRY Earnings are expected to be released on the 6th of October.
A break below $3.08 could potential lead to an ATL of $2.08

Tilray: Extended W or Head&ShouldersIt's not certain yet but I see high probability for an Extended W pattern (double bottom) or a Head&Shoulders pattern (triple bottom).
First target=4.50
After the first target, there are two probabilities:
A) It may break the resistance and keep on rising.
B) Or, it may turn back from 4.50, form a "head and shoulders/triple bottom pattern" and then rocket!
Mid & long term targets might be very high, since the share is too far away from its ATH.

TLRY (20% TRADE SETUP) Buy target is right under 3.33 when the gap closes. Sell targets are marked in orange. Red line is not accurate, it's is just there to display potential upside movement between buy target and final sell target.

Tilray at support? Tilray
Short Term
We look to Buy at 3.18 (stop at 2.94)
We look to buy dips. There is scope for mild selling at the open but losses should be limited. A higher correction is expected. Expect trading to remain mixed and volatile. Previous support located at 3.120.
Our profit targets will be 3.74 and 3.99
Resistance: 3.75 / 4.00 / 5.15
Support: 3.20 / 3.00 / 2.50
Disclaimer – Saxo Bank Group. Please be reminded – you alone are responsible for your trading – both gains and losses. There is a very high degree of risk involved in trading. The technical analysis, like any and all indicators, strategies, columns, articles and other features accessible on/though this site (including those from Signal Centre) are for informational purposes only and should not be construed as investment advice by you. Such technical analysis are believed to be obtained from sources believed to be reliable, but not warrant their respective completeness or accuracy, or warrant any results from the use of the information. Your use of the technical analysis, as would also your use of any and all mentioned indicators, strategies, columns, articles and all other features, is entirely at your own risk and it is your sole responsibility to evaluate the accuracy, completeness and usefulness (including suitability) of the information. You should assess the risk of any trade with your financial adviser and make your own independent decision(s) regarding any tradable products which may be the subject matter of the technical analysis or any of the said indicators, strategies, columns, articles and all other features.
Please also be reminded that if despite the above, any of the said technical analysis (or any of the said indicators, strategies, columns, articles and other features accessible on/through this site) is found to be advisory or a recommendation; and not merely informational in nature, the same is in any event provided with the intention of being for general circulation and availability only. As such it is not intended to and does not form part of any offer or recommendation directed at you specifically, or have any regard to the investment objectives, financial situation or needs of yourself or any other specific person. Before committing to a trade or investment therefore, please seek advice from a financial or other professional adviser regarding the suitability of the product for you and (where available) read the relevant product offer/description documents, including the risk disclosures. If you do not wish to seek such financial advice, please still exercise your mind and consider carefully whether the product is suitable for you because you alone remain responsible for your trading – both gains and losses.

on the way back up - longThe purple painting that I've draw 2 months ago looks like coming true. Lets continue the ride together. LONG TLRY!

Not Out of the WeedSomeone here was cracking up on some Dad jokes. I think the joke fits the Tilray stock trend here perfectly.
We do see increased volume coming in but there are still people who want to sell. This incoming leg down should create a RSI divergence on the daily.
On the weekly, we are far from end of correction. However, I am expecting a huge deadcat bounce going into this mid term election. The timing fits perfectly with the EW counts.

TLRY LONG LONG LONG TLRY Love this here for a longer-term play
As mentioned, weed has been off the radar and we have a nice entry here for a swing.
LONG LONG LONG AND HOLD THAT SHIT FOR GENNY WEALTH

TLRY Bullish Pennant Pattern Long ContinuationNASDAQ:TLRY
TLRY had 10% price range today' and finished with a Bullish Pennant
on the 15-minute chart. Accordingly, it is set up for an entry for the
long continuation.
TLRY showed momentum today by breaking above the double top
in the price action last week.
The uptrend is supported by bursts of relative volume beyond
the moving average of volume.

Weed Stocks Bottom We are not out of the weeds yet. Get it?
stupid dad Joke
We are back down to buying prices and with inflation/fed rates priced in we've had a good month.
If we can break and hold above the downtrend line we could see a little rally to $6-$8 range.
I don't think it will last long though and we will more likely have a double bottom.
Seems like federal legalization is still a ways off, and marijuana market growth is slowing.
Just charting and sharing thoughts. Happy to hear feedback.

Is TLRY a buy on yesterday's selloff?Yesterday, TLRY stock went down 10.7%, crashing along with other meme stocks. On the short term it bounced against strong support at the level around 3.8. Interpreting the crash as a bearish engulfing, the nearest resistance line would be at 4.44, whereas on the downside, below the current support level which is being held, there is another clear resistance turned support level around 3.65. This means that from a risk/reward perspective, TLRY is great, with a risk/reward of over 3.75, even using the nearest support line, below the current one. The stock is also in an upwards trending channel, the stock was oversold according to my RMA indicator, short sale volume was significantly smaller than net volume as shown in my NDO indicator, and the stock's price is hitting the 50 day EMA after breaking above it.

