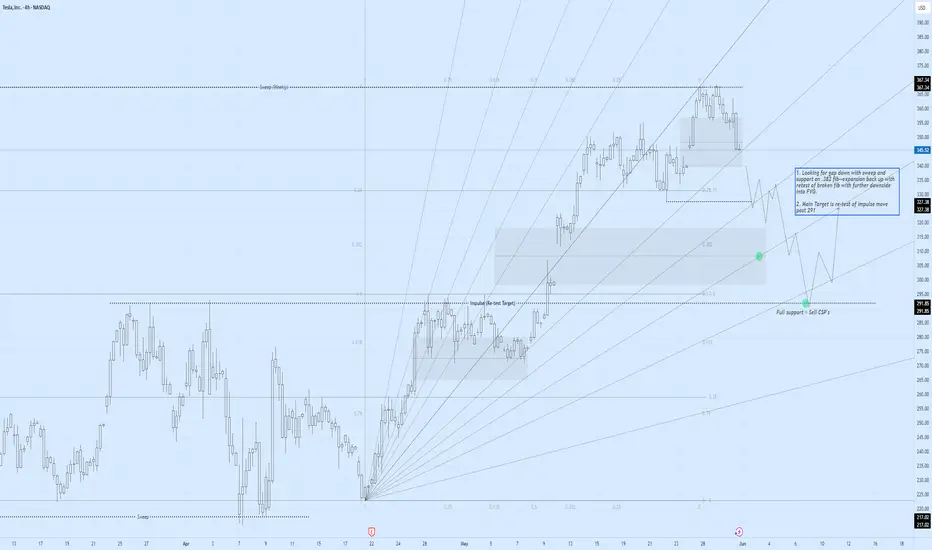
TSLA Descent 4-hr OutlookTSLA Descent!
1. Looking for gap down with sweep and support on .382 fib--expansion back up with retest of broken fib with further downside into FVG.
2. Main Target is re-test of impulse move (291 level).
-- take into consideration TSLA moves 29 points weekly (avg).
3. Full support = selling CSP's 14+ days out.
TSLA trade ideas
Tesla's Perfect Storm: A $152 Billion MeltdownTesla's Perfect Storm: A $152 Billion Meltdown, Chinese Rivals on the Attack, and a Faltering Shanghai Fortress
A tempest has engulfed Tesla, the electric vehicle behemoth, wiping a staggering $152 billion from its market capitalization in a single day. This monumental loss, the largest in the company's history, was triggered by a dramatic and public feud between CEO Elon Musk and former U.S. President Donald Trump. The confrontation, however, is but the most visible squall in a much larger storm. Lurking just beneath the surface are the relentless waves of competition from Chinese automakers, who are rapidly eroding Tesla's dominance, and the ominous sign of eight consecutive months of declining shipments from its once-impenetrable Shanghai Gigafactory.
The confluence of these events has plunged Tesla into a precarious position, raising fundamental questions about its future trajectory and its ability to navigate the turbulent waters of a rapidly evolving automotive landscape. The narrative of Tesla as an unstoppable force is being rewritten in real-time, replaced by a more complex and challenging reality.
The Trump-Musk Spat: A Bromance Turned Billion-Dollar Blow-Up
The relationship between Elon Musk and Donald Trump, once a seemingly symbiotic alliance of power and influence, has spectacularly imploded, leaving a trail of financial and political wreckage in its wake. The public falling out, which played out in a series of scathing social media posts and public statements, sent shockwaves through Wall Street and Washington, culminating in a historic sell-off of Tesla stock.
The genesis of the feud lies in Musk's vocal criticism of a sweeping tax and spending bill, a cornerstone of the Trump administration's second-term agenda. Musk, who had previously been a vocal supporter and even an advisor to the President, lambasted the legislation as a "disgusting abomination" filled with "pork." This public rebuke from a figure of Musk's stature was a direct challenge to Trump's authority and legislative priorities.
The President's response was swift and sharp. In an Oval Office meeting, Trump expressed his "disappointment" in Musk, questioning the future of their "great relationship." The war of words then escalated dramatically on their respective social media platforms. Trump, on his social media platform, threatened to terminate Tesla's lucrative government subsidies and contracts, a move that would have significant financial implications for Musk's business empire. He also claimed to have asked Musk to leave his advisory role, a statement Musk labeled as an "obvious lie."
Musk, in turn, did not hold back. On X (formerly Twitter), he claimed that without his substantial financial support in the 2024 election, Trump would have lost the presidency. This assertion of his political influence was a direct jab at the President's ego and a stark reminder of the financial power Musk wields. The spat took an even more personal and inflammatory turn when Musk alluded to Trump's name appearing in the unreleased records of the Jeffrey Epstein investigation.
The market's reaction to this public spectacle was brutal. Tesla's stock plummeted by over 14% in a single day, erasing more than $152 billion in market capitalization and pushing the company's valuation below the coveted $1 trillion mark. The sell-off was a clear indication of investor anxiety over the political instability and the potential for tangible financial repercussions from the feud. The incident underscored how intertwined Musk's personal and political activities have become with Tesla's financial performance, a vulnerability that has been a recurring theme for the company.
The Chinese Dragon Breathes Fire: Tesla's EV Dominance Under Siege
While the political drama in Washington captured headlines, a more fundamental and perhaps more enduring threat to Tesla's long-term prosperity is brewing in the East. The Chinese electric vehicle market, once a key engine of Tesla's growth, has become a fiercely competitive battleground where a host of domestic rivals are not just challenging Tesla, but in some aspects, surpassing it.
Companies like BYD, Nio, XPeng, and now even the tech giant Xiaomi, are relentlessly innovating and offering a diverse range of electric vehicles that are often more affordable and technologically advanced than Tesla's offerings. This intense competition has led to a significant erosion of Tesla's market share in China. From a dominant position just a few years ago, Tesla's share of the battery electric vehicle market has fallen significantly.
One of the key advantages for Chinese automakers is their control over the entire EV supply chain, particularly in battery production. This allows them to produce vehicles at a lower cost, a crucial factor in a price-sensitive market. The result is a growing disparity in pricing, with many Chinese EVs offering comparable or even superior features at a fraction of the cost of a Tesla.
Furthermore, Chinese consumers are increasingly viewing electric vehicles as "rolling smartphones," prioritizing advanced digital features, connectivity, and a sophisticated user experience. In this regard, many domestic brands are seen as more innovative and in tune with local preferences than Tesla. This shift in consumer sentiment has been a significant factor in the declining interest in the Tesla brand in China.
The numbers paint a stark picture of Tesla's predicament. While the overall new-energy vehicle market in China continues to grow at a remarkable pace, Tesla's sales have been on a downward trend. This is a worrying sign for a company that has invested heavily in its Chinese operations and has historically relied on the country for a substantial portion of its global sales.
The pressure on Tesla's sales in China is so intense that its sales staff are working grueling 13-hour shifts, seven days a week, in a desperate attempt to meet demanding sales targets. The high-pressure environment has reportedly led to high turnover rates among sales staff, a clear indication of the immense strain the company is under in this critical market.
The Shanghai Gigafactory: A Fortress with a Faltering Gate
The struggles in the Chinese market are reflected in the declining output from Tesla's Shanghai Gigafactory. For eight consecutive months, shipments from the factory, which serves both the domestic Chinese market and is a key export hub, have seen a year-on-year decline. In May 2025, the factory delivered 61,662 vehicles, a 15% drop compared to the same period the previous year.
This sustained decline in shipments is a significant red flag for several reasons. Firstly, the Shanghai factory is Tesla's largest and most efficient production facility, accounting for a substantial portion of its global output. A slowdown in production at this key facility has a direct impact on the company's overall delivery numbers and financial performance.
Secondly, the declining shipments are a direct consequence of the weakening demand for Tesla's vehicles in China. Despite being a production powerhouse, the factory's output is ultimately dictated by the number of cars it can sell. The falling shipment numbers are a clear indication that the company is struggling to maintain its sales momentum in the face of fierce competition.
The situation in China is a microcosm of the broader challenges facing Tesla. The company's product lineup, which has not seen a major new addition in the affordable segment for some time, is starting to look dated compared to the rapid product cycles of its Chinese competitors. The refreshed Model 3 and Model Y, while still popular, are no longer the novelties they once were, and are facing a growing number of compelling alternatives.
A Confluence of Crises: What Lies Ahead for Tesla?
The convergence of a high-profile political feud, intensifying competition, and production headwinds has created a perfect storm for Tesla. The company that once seemed invincible is now facing a multi-front battle for its future.
The spat with Trump, while seemingly a short-term crisis, has exposed the risks associated with a CEO whose public persona is so closely tied to the company's brand. The incident has also highlighted the potential for political winds to shift, and for government policies that have benefited Tesla in the past to be reversed.
The challenge from Chinese automakers is a more fundamental and long-term threat. The rise of these nimble and innovative competitors is not a fleeting trend, but a structural shift in the global automotive industry. Tesla can no longer rely on its brand cachet and technological lead to maintain its dominance. It must now compete on price, features, and innovation in a market that is becoming increasingly crowded and sophisticated.
The declining shipments from the Shanghai factory are a tangible manifestation of these challenges. The factory, once a symbol of Tesla's global manufacturing prowess, is now a barometer of its struggles in its most important market.
To navigate this storm, Tesla will need to demonstrate a level of agility and adaptability that it has not been required to show in the past. This will likely involve a renewed focus on product development, particularly in the affordable EV segment, to better compete with the value propositions offered by its Chinese rivals. It will also require a more nuanced and strategic approach to the Chinese market, one that acknowledges the unique preferences and demands of Chinese consumers.
The coming months will be a critical test for Tesla and its leadership. The company's ability to weather this storm and emerge stronger will depend on its capacity to innovate, to compete, and to navigate the complex and often unpredictable currents of the global automotive market. The era of unchallenged dominance is over. The battle for the future of electric mobility has truly begun.
congrats to tesla longs! boost and follow for more ❤️🔥 in my last tesla update in early april I mentioned the break of trend resistance, and how that resistance acted as support.. how this meant the bottom was likely in. lots of people doubted this, but here we are a few months later at my short term targets 🎯
now we are sitting at a important trend support that has held since april, a break below can send us to 290-300 before the next push higher.. if we hold here and start to rally it might go straight to my next target around 430..
whether it breaks or holds, I think 430 will get hit soon enough.. I am wearing a tesla shirt as a write this analysis hehe.. 🤣 I will see you soon with more updates, I am done for today! felt good to post some stuff after being gone for over a month.

Stock Of The Day / 06.06.25 / TSLA06.06.2025 / NASDAQ:TSLA
Fundamentals. Negative background due to the conflict between Musk and Trump.
Technical analysis.
Daily chart: Pullback on an uptrend
Premarket: Gap Down on increased volume.
Trading session: The primary impulse from the opening of the session was stopped at 312.70, after which a smooth, long pullback followed. At 12:00 p.m., volumes appeared and the price sharply returned and tested the level of 312.70, and the next pullback was significantly smaller than the previous one. We are considering a short trade to continue the downward movement in case of breakdown and holding the price below the level.
Trading scenario: #breakdown with retest of level 312.70
Entry: 310.94 after the breakout, retest and holding below the level.
Stop: 313.06 we hide it above the tail of the retest.
Exit: Cover the position at 279.47 when the structure of the downward trend is broken amid price acceleration and volume growth.
Risk Rewards: 1/14
P.S. In order to understand the idea of the Stock Of The Day analysis, please read the following information .

Tesla Wave Analysis – 5 June 2025
- Tesla broke the support zone
- Likely to fall to support level 260.00
Tesla recently broke the support zone located between the support level 294.00 (former resistance from April and March) and the 50% Fibonacci correction of the upward impulse from April.
The breakout of this support zone accelerated the active minor ABC correction 2 from the end of May.
Tesla can be expected to fall to the next support level 260.00, which is the former resistance from the start of April.
TSLA SHORT TERM Bullish ReversalThere is a double or triple bottom forming and it has to have a retracement. This is more of a scalp play because it's going against the trend. The MACD lines are getting closer together and the bars are getting smaller.

TESLA: Patience Is KeyAdmittedly: The news surrounding Tesla is not particularly exciting at the moment. Nevertheless, it is unlikely that the share price of the e-mobility pioneer will plummet. Rather, it is now important to wait for an ideal entry point.
The share has currently recovered significantly from its recent lows and a long entry would offer a suboptimal RRR. Instead, we assume that the price will move sideways to negative in the coming weeks and months, in line with the rather bearish annual seasonality, which usually lasts until September or October. The entry point shown at around USD 260 would then provide an ideal RRR for a long trade that would take us to the ATH area and possibly beyond.

Elon Musk vs Trump: Who you betting on?Elon Musk and Donald Trump have recently had a public falling-out, with their feud playing out on social media and in political circles.
The dispute seems to have started over Trump's new budget bill, which Musk has criticized for increasing the national debt. Trump, in turn, accused Musk of being upset because the bill removes electric vehicle subsidies that benefit Tesla.
The tension escalated when Trump suggested that Musk had known about the bill beforehand and had no issue with it until after leaving his government role. Musk denied this, claiming he was never shown the bill and that it was passed too quickly for proper review. Trump then took things further by threatening to cut Musk’s government contracts and subsidies, which amount to billions of dollars. Musk responded defiantly on social media, calling Trump "ungrateful" and claiming that without his financial support, Trump would have lost the election.
TSLA violated key levels and will be looking for a sharp technical bounce off the $260-$257 zone

Everything we know about the Trump - Musk divorce (so far)
Elon Musk publicly criticised Trump’s “One Big Beautiful Bill” as a “disgusting abomination” that would explode the U.S. deficit and “bankrupt America.” The bill is projected to add $2.5 trillion to the U.S. deficit over 10 years.
Musk claimed Trump wouldn’t have won the 2024 election without his support, calling the backlash “such ingratitude.”
Musk then alleged on X that Trump appears in the Epstein files. This marks a serious escalation (but we all thought this before Musk confirmed it right?)
Trump followed up on Truth Social by calling Musk “crazy” and hinting at cancelling federal contracts with his companies. Trump wrote that cancelling subsidies for Musk’s companies “could save billions,”.
Tesla has wiped out ~$100 billion in market value. Tesla now politically exposed?
Musk floated the idea of creating a new centrist political party, criticising both Democrats and MAGA Republicans. “We need a party that actually represents the interests of the people. Not lobbyists. Not legacy donors. Not extremists.”

TSLA cooling offI know Tesla lovers hate to see a short post on the stock. Okay... it's cooling off... lol.
*another news report states he's leaving gov't; trump holding on tight... we shall see
*alleged new growth story incoming... check news and see what you see
*TA (technical analysis) look like a pullback in order... 330-325
Do you see what I see? Or you are feeling like it's a straight moon shot?
Have a great weekend.

Tesla (TSLA) – SMC Buy Zone Identified🕒 1H Chart | Wave Structure + Liquidity Sweep | Vol: 680K+
🔍 Context:
TSLA appears to have completed a textbook 5-wave impulse, peaking near $385. Price has now retraced into the discount zone, testing a prior equilibrium and FVG (Fair Value Gap)—ideal for reaccumulation.
🧠 Technical Breakdown:
✅ Wave Count Complete: Elliott Wave (1–5) structure suggests a cycle top was formed.
📉 Current Retracement: Price is approaching the 0.5–0.618 Fibonacci retracement and strong OB zone around $294–$303, aligning with Smart Money’s typical entry zones.
📦 Choch → BOS Confirmation: Bullish structure shift suggests a potential reversal zone.
💰 Buy Zone: $294.89 (key low) to $303.17 (equilibrium).
🎯 Target: $513.06 (Fibonacci extension + liquidity cluster).
🧮 Probability Outlook:
📈 Bullish Probability: 70% — Favoring upward continuation post-retrace.
📉 Bearish Breakdown: 30% — If $294 fails, expect deeper retracement toward $267 support.
📊 Strategy Suggestion:
Wait for a bullish confirmation candle near $294–303 zone. Add size above break of minor BOS. Target premium levels with trailing stop logic.
#TSLA #SmartMoneyConcepts #Fibonacci #ElliottWave #VolumeProfile #TradingStrategy #WaverVanirInternational

Momentum Still HighDid not expect this deep fall today. But as the momentum is still high I don't think that the decline is over already. There are some fine targets waiting to be reached lower.
The mood is bearish anyway.

$TSLA That’s why you never mix politics with entrepreneurship
It clouds judgment, delays action, and places key info out of order.
Business needs clarity, not chaos.
Stick to the strategy, not the drama. 💼🚫🎭
#Entrepreneurship #Focus #Discipline #GamePlan


TSLA wait for buying signal at 250s or 210sTesla (TSLA) has been a hot topic among investors. Analysts at TD Cowen recently maintained a "Buy" rating with a price target of $330, citing Tesla's advancements in autonomous vehicle technology as a key factor. Elon Musk has also stated that Tesla has already "turned around," with the stock price climbing back toward last year's highs2. However, Tesla's recent earnings report showed a 71% drop in net profit year-over-year, and vehicle sales fell 13% in the first quarter.
The stock is currently trading above $360, which is 184 times trailing earnings, making it significantly more expensive than legacy automakers. Some investors remain bullish due to Tesla's focus on robotaxis and AI-driven innovations, while others are cautious about its valuation and declining automotive profits.
If you're considering investing, it might be worth reviewing Tesla's latest earnings, growth strategy, and broader market conditions. You can check out more details here and here. Let me know if you want a deeper dive into any specific aspect!

Tesla POP off the lowsTesla is currently experiencing a 5 wave impulsive move from the lows of the tarriff turmoil zone, and seeing increasing strength as it climbs and consolidates.
Generally, whenever you have strong bounces such as this one, you can look for a 5 wave impulse move and utilize fibonacci extensions which innately use mathematics to correlate the momentum relationship between each wave.
At present, we have already seen the first 2 waves, which are quite clearly defined, and now pulling back wave 4 for the last 5 wave blow off.
Using the trend based fib extension from the bottom of wave 1, to wave 3/4 to measure the expected move to the 0.618 extension. Meaning, the last wave is generally approx. 61% the size of the first initial wave.
This is a nice 30% move , and can be quite profitable should it materialize. Stoploss is below $312 on a daily close.
Good luck!

Possible Head & Shoulders Forming Possible head and shoulders forming on the weekly chart could signal more downside ahead.
This plays into a large corrective wave that started in November 2021, which still needs to form a wave-C of comparable size.
A new high above the wave-B top would negate this count.

TSLA Backtest: A robo-taxi launchpad? TBD ... 𝗧𝗲𝘀𝗹𝗮 𝗕𝗮𝗰𝗸𝘁𝗲𝘀𝘁: A robo-taxi launchpad? 🤖🚗
After a 20%+ breakout, NASDAQ:TSLA is retesting its 200dma with $295–300 now key support. Hold that — and bulls have room to run to $400+.
𝘉𝘶𝘭𝘭𝘪𝘴𝘩 𝘴𝘦𝘵𝘶𝘱 𝘸𝘪𝘵𝘩 𝘢 𝘥𝘢𝘵𝘦: June 12 robo-taxi reveal in Austin could mark Tesla’s first real step toward autonomous ride-hailing at scale.
𝘏𝘪𝘨𝘩 𝘱𝘳𝘪𝘤𝘦, 𝘩𝘪𝘨𝘩 𝘩𝘰𝘱𝘦𝘴: Tesla's valuation has always priced in the future. This time, the future might show up in a self-driving Model Y.
$NQ_F NASDAQ:NDX NASDAQ:QQQ NASDAQ:NVDA NASDAQ:AAPL AMEX:SPY NASDAQ:SOX CBOE:ARKK #Tesla #Robotaxi #FSD #ElonMusk #Stocks

SHORT Tesla, Bearish Chart SetupGood morning my fellow Cryptocurrency trader, I hope you are having a wonderful day. If you decide to call me a genius or whatever... The choice is yours to make.
Here, the TSLA stock (Tesla) is showing some weakness signals. Weakness that can translate into a drop.
Would you like me to point those out?
Ok, we can go through a few of them real-quick.
1) A rising wedge pattern. Always bearish.
2) Decreasing volume. Always bearish.
3) Resistance being confirmed at the 19-February peak.
4) Bearish bat.
These are just a few of the chart signals but it is not only about the signals, there is something in the air... I smell... Huh, what to call it? A flash crash? A market shakeout? A flush? A surprise? Or simply, a retrace?
I don't know... All I know is one thing, TSLA doesn't look bullish anymore.
The chart is saying down.
Let's see what kind of event shows up to match the chart.
Namaste.

Tesla Inc. (TSLA) Technical Analysis and ForecastTSLA has demonstrated strong upward momentum since the market opened today, reaching a resistance level around the $362 zone.
From a technical perspective, there is potential for a short-term pullback to the $354 area, which aligns with the top of the support zone, also known as the "right shoulder" of the prevailing pattern.
Should this support level hold, we may anticipate a continued upward move, targeting higher price levels.
Key Levels to Watch:
Support Levels:
Primary Support: $354 zone
Secondary Support: $321 zone (as a deeper stop loss level)
Resistance/Take Profit Levels:
Target 1 (Take Profit): $440
Target 2 (Take Profit): $480 (previous all-time high)
Traders should approach this setup with caution, as always, adhering to sound risk management principles.
Market conditions can shift rapidly, and price action around these levels should be monitored closely.
If you find this analysis helpful, please consider supporting the channel by liking, commenting, and sharing this post.
Stay disciplined and trade with care.

TSLA looking for a rally setupPrediction:
TSLA will likely pull back to the green range (328–342), and in extreme cases, it may dip to the 318–320 area before starting a rally toward ~380 in June or July.
Eventually, it may aim for the ~420 range as the full target, though I’m not very confident about that at this point.
On the daily chart, the overall setup is forming a bull flag pattern, with the MACD showing a potential pullback reversal in the high-range.
The gap between 307 and 311 likely won’t be filled in the near future.
Action:
I plan to accumulate long positions around ~335 and will add more if it drops to 320, or if it breaks above the 10 SMA after breaking below the 20 MA without hitting 320.
Stop loss will be at filling the gap or breaking down 60 SMA.
Potential-loss ratio is 2:1 to 3:1, which is not ideal for TSLA or TSLL. So I will be looking for calls or BCS.
Tesla - retrace is expected before any possible upside.Tesla upside movement so far is a corrective structure ABC. Further upside is possible even if its a corrective structure. For now, a retrace can soon start to Green box. The retrace will also fill gaps.

TSLA | Long Bias | Double VWAP + ABC Setup | (June 5, 2025)TSLA | Long Bias | Double VWAP + ABC Setup | (June 5, 2025)
1️⃣ Insight Summary:
Tesla is pulling back just as we anticipated, but strong technical support from a double VWAP level and a developing ABC correction is hinting at a potential bullish reversal. Momentum could build soon — this is a key area to watch!
2️⃣ Trade Parameters:
Bias: Long
Entry Zone: Current VWAP support near $230 (adjust per actual chart level)
Stop Loss: Below VWAP + liquidity zone (~$225 suggested)
TP1: $363
TP2: $395
Partial Exits: Consider profit-taking along the way; over 50% of the position to be closed around the $363–$395 range.
3️⃣ Key Notes:
✅ Support Factors: We're holding the double VWAP level and near the left-side value area high (around $294), with ABC corrective structure playing out.
✅ Money Flow: On the 4H chart, money is flowing out, but on the 30min it's stabilizing near 0 — watch for a potential turn.
❌ Risk Zone: We might see a short liquidity grab under the VWAP before the real move starts. Be patient with entries.
📰 Sentiment & Fundamentals: Tesla dropped due to new tariffs, but the news around Robotaxi services could spark a sharp rebound. Wall Street is watching closely as EPS continues to underperform forecasts.
⚠️ Valuation Caution: Despite a sky-high P/E ratio (189), Tesla remains outside normal valuation rules, like Nvidia. Keep that in mind when thinking long-term.
4️⃣ Follow-Up:
I’ll be monitoring this setup closely — especially how price reacts around VWAP and whether money flow turns green. Updates to come if conditions change!
Please LIKE 👍, FOLLOW ✅, SHARE 🙌 and COMMENT ✍ if you enjoy this idea! Also share your ideas and charts in the comments section below! This is best way to keep it relevant, support us, keep the content here free and allow the idea to reach as many people as possible.
Disclaimer: This is not financial advice. Always conduct your own research. This content may include enhancements made using AI.
