TSLA eyes on $294: Key Support for bulls to hold or face $253TSLA oscillating all over the place thanks to Musk moves.
Currently testing a key support zone $293.96-294.32.
Loss of this floor opens the Golden Genesis at $253.57
See "Related Publications" for previous charts ------------>>>>>>
TSLA trade ideas

TSLA Long Idea — Buying the Support After News-Driven DipNASDAQ:TSLA price has stabilized near the key $290–291 support zone, a level that has previously triggered rebounds. This presents a solid entry opportunity with limited downside risk.
Context: The recent drop was triggered by headlines involving the U.S. President and Elon Musk. If this was mainly speculative noise, now could be the best time to buy, as the market absorbs the news and finds technical support.
Technical Setup:
• Strong support at $290–291 holding firm.
• Stochastic is in the oversold zone and starting to turn upward.
• Bollinger Bands tightening — breakout likely.
• Target: $307.45 (+4.57%)
• Stop-loss: $289.09 (−1.68%)
• Risk/Reward Ratio: 2.72
Expected move by July 9, 2025. With strong technical signals and fading news impact, this setup offers a favorable risk/reward for bulls looking to ride a rebound.

TSLA racing to break thru resistancearea 1: 340
area 2: 360
will be tuned into earnings to see if the jig is jiggin July 23rd.
Elon is busy. so let's see what's the dealio.
****280 is a key level
**300 needs to hold for these attempts

7/7/25 - $tsla - 20% position.7/7/25 :: VROCKSTAR :: NASDAQ:TSLA
20% position.
- that's the message... refer to prior msg "buying all dips"
- u do u
V

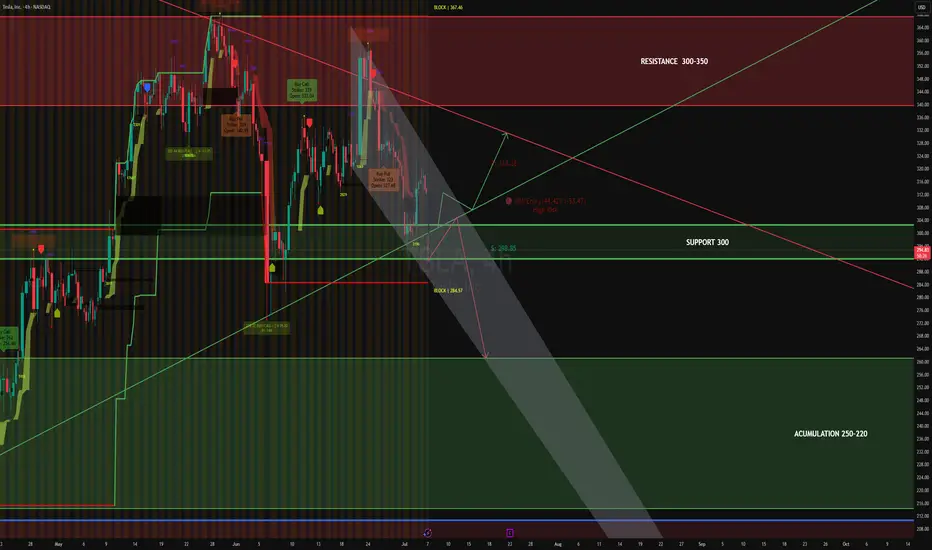
TESLA 4HS Tesla broke below the triangle formation, signaling a bearish continuation.
Trend: Bearish breakdown from consolidation triangle.
Key Support (SUP): $300 (now resistance on retest).
Next Demand Zone: Strong block between $284–285.
Accumulation Zone: $250–220, identified for potential long-term institutional accumulation.
Resistance (RES): $300–350 remains a significant supply zone.
Projection Channel: Downward channel in play; price action respects descending pressure.
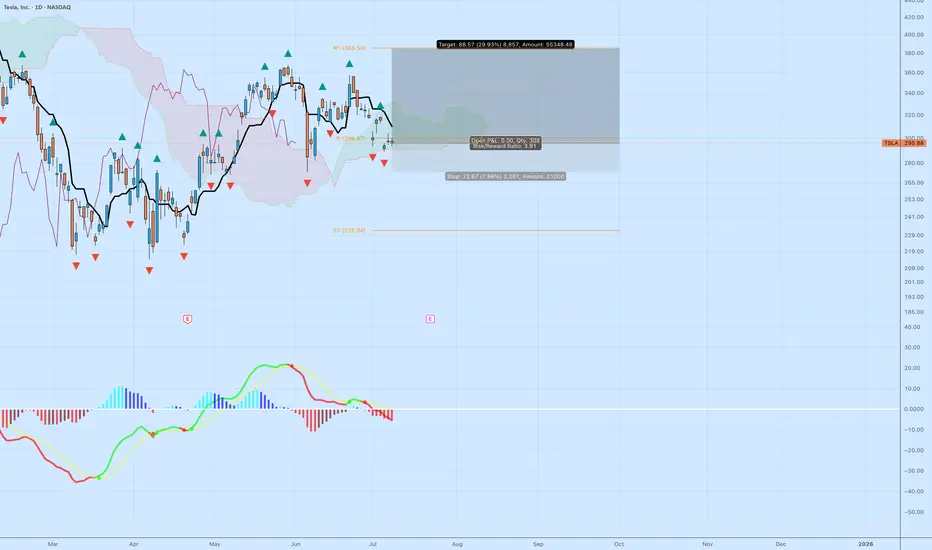
TSLA: High R/R Bounce Play Off the Cloud EdgeTesla NASDAQ:TSLA is sitting at a decision point — testing the edge of the Ichimoku cloud while momentum resets. The setup isn’t confirmed, but the risk/reward is compelling for those watching structure.
🔍 Technical Breakdown
Cloud Support: Price is holding right at the top of the cloud. A breakdown would signal trend weakness, but for now, it's a potential bounce zone.
MACD: Momentum has cooled off, but no bullish crossover yet. Early signs of a flattening histogram could suggest a pivot.
Structure: Horizontal support near $292–295 has held multiple times. If this zone holds again, the upside target opens up quickly.
🎯 Trade Specs
Entry: $296.88
Target: $385.50 (+29.93%)
Stop: $274.21 (–7.66%)
Risk/Reward: 3.91 — solid asymmetry
💡 Trading Insight:
This isn’t about calling bottoms — it’s about defining risk. When price compresses at known support, and you’ve got a 3.9 R/R profile, you don’t need to be right often to be profitable.
Big Bounce or Breakdown? Tesla at the edgeTesla is at crossroads right now, where the next move will define its near-term trajectory.
After an extended correction phase, TSLA is reaching a key zone around the $300 level, one that held price well during recent pullbacks.
Although recent tax news caused a decline in the price, belief in Tesla’s longer-term trajectory remains strong among many investors.
At the same time, many investors are carefully monitoring the support near $215 to $230, another important zone. This level has acted as a reliable level during past pullbacks, as it suggests the stock has a solid base, despite short-term ups and downs. For these investors, maintaining their positions through consolidation is a test of patience and belief in Tesla’s longer-term trajectory. If Tesla breaks below the $230 support zone, some investors may view this as an opportunity to take advantage once again.
Given the current setup, it’s best to be cautious and wait for confirmation before looking to get involved.

TSLA Honey Ticking Bull Trap! UPDATE 1This is an updated chart, as I keep being prompted to reach "My Target" by TV.
No matter how bad things get for Elona and TSLA, there are always people who are willing to pile in and buy at any price. The problem is the chart is showing lower highs, as TSLA no longer attracts the people needed to boost price, just like TSLA the brand. As a result, people keep getting honey ticked.
Don't Get HONEY TICKED!
As I always say, never EVER!! Invest in toxic people like Elona. They always blow themselves up in the end. It's in their nature!
Click Boost, Follow, subscribe, and let's reach 5,000 followers. ;)

Tesla, Below 200 Next - The Crash Can Reach 140, 150 & 160Tesla has been bearish since December 2024 and producing lower highs since. A strong lower high happened late May with a shooting start candlestick pattern. A month later another lower high and bullish rejection with an inverted hammer.
This looks like an ABC correction with the low in March/April being the A wave. The lower high in May the B wave and the next low the final C wave. This would complete the corrective pattern.
Conditions for bullish
An invalidation of the bearish bias and potential would happen with a rise and close, weekly, above 355. Any trading below this number and the bearish bias remains intact.
Indicators: RSI & MACD
» RSI:
The RSI looks pretty bad as it already curved down; trending down and moving lower since December 2024.
» MACD:
The weekly MACD is weak, starting to curve but still on the bullish zone. The daily MACD already turned bearish and moving lower.
Summary
Overall, market conditions are weak for this stock and everything points lower. The chart structure points to a lower low based on a broader bearish trend.
Thank you for reading.
Namaste.

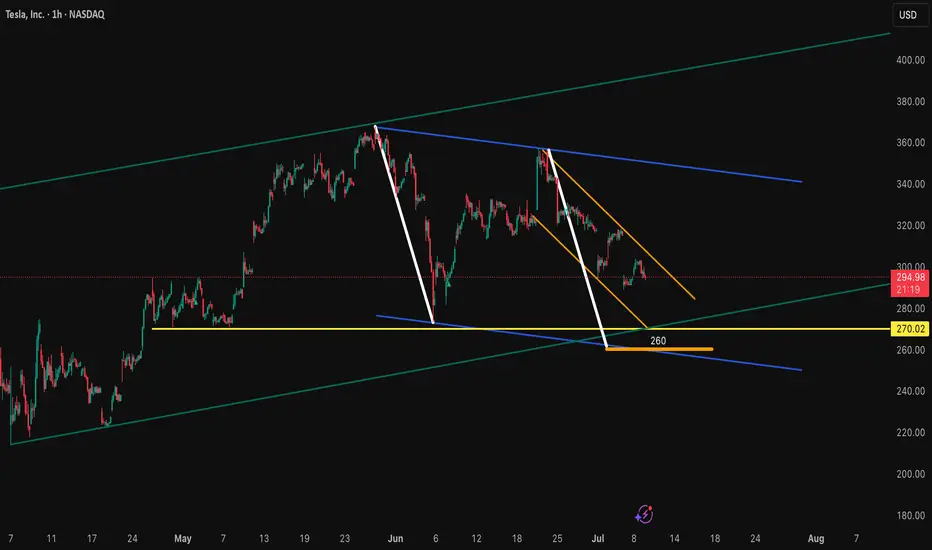
Break of rising trendline TSLA – 4H 🧠
Bias: Bearish
Entry: Below 300.00
🎯 Targets: 273.67 – 253.87
❌ Invalidation: Above 315.01
Break of rising trendline signals bearish momentum. Downside continuation anticipated.
#TSLA #Stocks #NASDAQ #PriceAction #TradingView #piporia

Tesla on the Edge – Key Support or Deeper Drop?📉 Tesla on the Edge – Key Support or Deeper Drop? 🔥🔍
Tesla is in freefall, dropping nearly 9% today. The stock has plummeted from its highs near $500, now testing the critical $220-$200 support zone.
📊 Key Levels to Watch:
📌 Holding $220 could trigger a relief bounce towards $275+.
📌 A breakdown below $200 could open doors to $160-$180, or worse.
🔎 What’s Happening?
Tesla, along with X and SpaceX, is under intense scrutiny amid political pressure, regulatory battles, and even cyberattacks. This aligns with the broader market uncertainty, as Bitcoin struggles to reclaim $79,478.
👀 Elon Musk is in the spotlight, facing global resistance, from social media wars to business challenges. Could this spell opportunity or more downside for Tesla?
⚡️ Will TSLA rebound, or is it heading even lower? Let me know your thoughts below!
One Love,
The FXPROFESSOR 💙
#Tesla #TSLA #ElonMusk #StockMarket #Trading #TechStocks

Long TSLA with a quick stop if we break back below 290.I have followed NASDAQ:TSLA for a while now and this 290 level has been huge. We have tried to test it a couple of times and failed, and you can see how price was stuck in a range below that level for almost 4 months earlier this year. The one thing that worries me is that there are a lot of people on social media calling for a pop here because of the drop we just saw and a lot of people are watching that 290 level. I think the market might punish the majority and dump this but the R:R is too great to ignore a trade here.
I would stop out of this if price closes back below 290 (on the 1H or D timeframe depending on your risk). If we don't stop out I would target 300, 310, 325. Break/hold above 333/5 and I would press longs for 360, 400.
If price does break/hold below 290 I would be short to target 280, 275. 275 should be another big support level as you can see the other white box/range on the chart has a top there. A look below and fail of 275 would be another good long entry and that would be the level I would watch if they decide to punish the 290 crowd.
I will post again if we see 275 otherwise look for upside with a quick stop as detailed above.
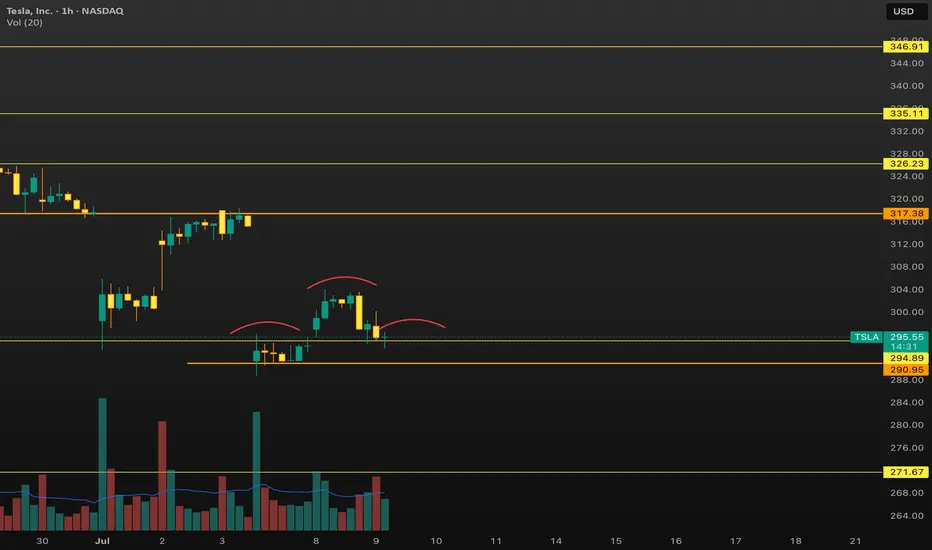
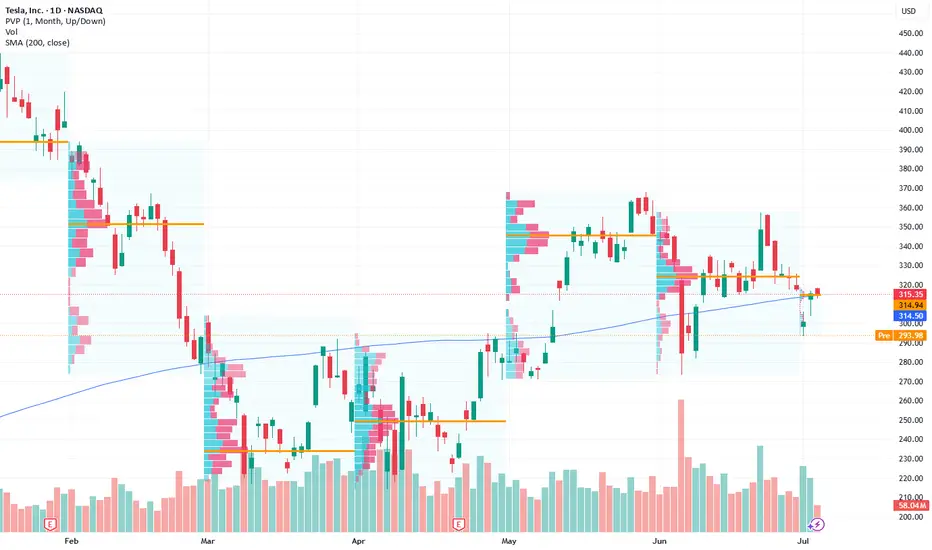
TSLA · Potential Double-Top Breakdown Idea Toward $255 → $225Rounded / double-top: Two rounded peaks formed at ≈ $335-340 with a clean neckline at $295-297 (yellow arcs on my chart).
Break confirmed: Friday’s candle closed below the neckline on above-average volume, triggering the pattern.
Measured-move math: Height of the top (≈ $40) projected beneath the neckline points to $255 for a full 100 % target.
Volume-profile “void”: VPVR shows a sharp volume vacuum between $260 and $230; once below $260, price often “slides” quickly to the next demand shelf around $225-230 — my purple “1st-target” box.

TESLA Reached The Support! Buy!
Hello,Traders!
TESLA gaped down on
Monday but the move was
Held up by a massive support
Area ending around 272$ and
As the support is strong we
Will be expecting a rebound and
A move up from the level
Buy!
Comment and subscribe to help us grow!
Check out other forecasts below too!
Disclosure: I am part of Trade Nation's Influencer program and receive a monthly fee for using their TradingView charts in my analysis.

Tsla below 288 ?I see an H&S pattern forming if we break below 288 we could see it drop to 280 ish imo. Can play out this week. Lets see
TSLA at Critical Compression – Will 300 Break or Reject Again?🔍 Options Sentiment (GEX) Insight:
TSLA is currently sitting just below the $300 call wall — a key resistance level with 71.83% call gamma. This makes $300 a battleground where dealers are likely to defend against upward movement unless there's a significant catalyst or volume thrust. The highest positive call gamma is stacked at $320, making that the next magnet level if $300 is breached with strength.
Below, the $290 level is critical, hosting a major PUT wall and high-volume liquidity (HVL). A break below could trigger acceleration toward $285–$280, where the strongest negative NET GEX exists — signaling potential dealer hedging flows in favor of downside momentum.
Options Trade Ideas:
* Bullish Scenario (Breakout):
* Buy CALL if TSLA breaks and holds above $300, targeting the $310–$317.5 range.
* Ideal setup: Use 310c or 315c, 1–2 weeks out, looking for gamma squeeze.
* Bearish Scenario (Breakdown):
* Buy PUT if TSLA breaks and holds below $290, targeting $285 → $280.
* Ideal contracts: 280p or 285p, especially if IV remains low (IVR is at 21.3).
* Be cautious of chop inside the $290–$300 zone — it's gamma neutral.
📈 1-Hour Technical Structure:
TSLA is trading inside a descending wedge with a bullish CHoCH (Change of Character) confirming near the lower boundary of the wedge. There is a visible bullish OB (order block) between $288–$290, which acted as support in the last two sessions.
* Trendline Resistance from recent highs still caps upward movement unless $300 is reclaimed decisively.
* A strong bullish breakout above $300 could flip the structure fully bullish and initiate trend continuation toward $320.
* Failure to hold $290 could invalidate the CHoCH and confirm a BOS (Break of Structure) back to the downside.
Intraday Trade Scenarios:
* Scalp Long:
* Entry: $297.50 (if holds and reclaims above $300)
* Target: $307 / $310
* Stop: $293.94 (below last swing)
* Scalp Short:
* Entry: Break below $288.77
* Target: $285 → $280
* Stop: $293.94
Final Thoughts:
TSLA is consolidating near a major decision zone. $300 remains the trigger level for a directional move, and option flows suggest an explosive resolution if either side breaks. Stay nimble, wait for confirmation, and trade with clear invalidation in mind.
This analysis is for educational purposes only and does not constitute financial advice. Always do your own research and manage risk appropriately.

TSLA (daytrading) break out and retest1. Still watching here (down trend is too strong)
We can see break out patterm
2. And came back to restest. But i worry about that tsla usually doesnt restest like that.
3. Hit sma 200 h1

Tesla (TSLA) Leads Declines in the Equity MarketTesla (TSLA) Leads Declines in the Equity Market
Yesterday, President Trump announced that letters had been sent to the United States’ trading partners regarding the imposition of new tariffs — for instance, a 25% tariff on goods from Japan and South Korea. This marks a return to “trade diplomacy” under the America First strategy. The tariffs are scheduled to take effect on 1 August, though the date remains subject to revision.
As we highlighted yesterday, bearish signals had begun to emerge in the US equity market. In response to the fresh wave of tariff-related headlines, the major indices moved lower. Leading the decline — and posting the worst performance among S&P 500 constituents — were shares of Tesla (TSLA). The sell-off followed news of a new initiative by Elon Musk, who now appears serious about launching a political “America Party” to challenge both the Republicans and Democrats.
Trump criticised his former ally’s move on his Truth Social platform, and investors are increasingly concerned about the potential impact on Tesla’s business. Tesla shares (TSLA) fell by more than 6.5% yesterday, accompanied by a broad bearish gap.
Technical Analysis of Tesla (TSLA) Stock Chart
On 2 July, our technical outlook for TSLA anticipated the formation of a broad contracting triangle in the near term. Yesterday’s price action appears to confirm this scenario:
→ The sharp move highlighted the lower boundary of the triangle (marked in red);
→ The $317 level — where the previously rising channel (marked in blue) was broken — acted as resistance.
It is worth noting that during yesterday’s session, TSLA did not fall further following the gap down. In other words, the bears were unable to extend the sell-off, suggesting that the stock may attempt a recovery towards the $317 level. This area could potentially act as a central axis within the developing triangle pattern.
This article represents the opinion of the Companies operating under the FXOpen brand only. It is not to be construed as an offer, solicitation, or recommendation with respect to products and services provided by the Companies operating under the FXOpen brand, nor is it to be considered financial advice.

TSLA Options GEX Outlook: Bearish Pressure with Limited Support The GEX (Gamma Exposure) chart signals heavy PUT-dominant sentiment:
* Highest Negative NetGEX / PUT Support is stacked tightly around 295, with major Put Walls between 290 and 275.
* GEX clusters:
* -98.4% at $285
* -74.9% at $280
* -46% at $270
* On the upside, CALL resistance begins around 310–320, with GEX cooling off at 330.
🔍 Interpretation:
* Market makers are likely to hedge against upward price moves, increasing resistance near 310–320.
* Downside movement toward 285–280 could accelerate gamma momentum, causing a potential drop toward 270.
📉 Options Setup Suggestion:
* If price rejects at $297–300, buying PUTS (1–2 DTE) with target at 285 could benefit from GEX tailwinds.
* Avoid CALLs unless price breaks above 310 with volume.
TSLA 1-Hour Chart Technicals: Compression & Reaction Zone at Key Structure
The 1H chart shows:
* A recent Change of Character (ChoCH) and Break of Structure (BOS) near 290–295, indicating an attempt to reverse short-term bearish trend.
* Price is consolidating within a small demand zone (green box) and trying to retest the 295–297 region.
* However, TSLA remains under a macro downtrend with the descending channel intact.
🎯 Key Zones:
* Resistance: $297 → $305 → $310
* Support: $288.77 (LTF BOS) → $285 → $280
* Volume shows weak bullish momentum so far, not strong enough to push through resistance decisively.
⚠️ Trade Setup Ideas:
* PUT Scenario: If price fails to reclaim 297, consider entering near 296–297 with stop above 300. Target: 288 → 285.
* CALL Scenario (Risky): Only consider Calls above close + hold over 300, aiming for 310 with tight stop below 297.
🧠 Final Thoughts:
* Bias: Bearish to Neutral until price shows strong reclaim above 300.
* GEX setup favors PUT plays, especially on weakness below 295.
* If shorting, watch for reaction at 285 — this is the last solid gamma level before an air pocket to 270.
* Stay nimble, use stops, and respect trendline pressure overhead.
Disclaimer: This analysis is for educational purposes only and does not constitute financial advice. Always do your own research and manage your risk before trading.

Tesla: Ticking Higher on Consolidation Breakout Potential
Current Price: $315.35
Direction: LONG
Targets:
- T1 = $322
- T2 = $330
Stop Levels:
- S1 = $310
- S2 = $305
**Wisdom of Professional Traders:**
This analysis synthesizes insights from thousands of professional traders and market experts, leveraging collective intelligence to identify high-probability trade setups. The wisdom of crowds principle suggests that aggregated market perspectives from experienced professionals often outperform individual forecasts, reducing cognitive biases and highlighting consensus opportunities in Tesla.
**Key Insights:**
Tesla’s stock has been consolidating within a narrow range of $305–$320, reflecting investors' cautious optimism ahead of potential catalysts. Technical resistance at $322 is acting as a key breakout point that could open the path to higher price levels. The bullish sentiment is fueled by improving production efficiencies, ongoing expansion in international markets, and Elon Musk’s ambition to transform Tesla into a broader technology conglomerate. However, concerns surrounding increasing competition in the EV market and potential headwinds from regulatory changes remain significant risks.
**Recent Performance:**
Tesla’s recent price action has showcased volatility while maintaining key support levels around $301.11. The stock has demonstrated resilience, holding firm during tech sector corrections. Over the past month, Tesla has seen short-term rallies driven by positive speculation about its EV lineup, alongside broader optimistic movement in the S&P 500. Investors have stayed engaged, with trading volumes suggesting sustained interest despite external pressures.
**Expert Analysis:**
Market experts underscore $322 as a critical resistance level that serves as the decision point for renewed momentum. The stock's recent consolidation pattern signals a possible breakout, assuming macroeconomic conditions remain favorable. Analysts have also cautioned about rising competition from other EV manufacturers like BYD, which intensifies pressure on Tesla's pricing strategy and market share. Nevertheless, Tesla’s ambitious pipeline, including autonomous driving technologies, remains a significant source of long-term investor confidence.
**News Impact:**
Tesla’s near-term outlook is influenced by competing factors. On one hand, reports of a lower-cost EV could dramatically increase its addressable market, while ongoing advances in AI and battery technologies enhance the company’s competitive edge. On the other hand, upcoming expiration of federal EV tax credits and increasing geopolitical scrutiny over Musk’s public statements may weigh on investor sentiment. Despite this, news of expanded production capabilities in Gigafactory Nevada has bolstered optimism regarding Tesla’s capacity to scale effectively.
**Trading Recommendation:**
Taking a long position in Tesla appears favorable as price action signals bullish momentum within its established range. The short-term trade targets $322 followed by $330, with stop-loss levels placed at $310 and $305 to manage downside risk. Traders are advised to monitor any developments in macroeconomic conditions and competitive activity, which remain key influences on price trajectory.
TSLA : A lot of whipsawingThis has been a very volatile stock to hold. However for those who are bullish on this name long term, I can see this expand and impulse out into a larger 3rd wave. A smaller retracement still fits in this narrative to complete the wave 2 bottom. Let's see how earnings play out.

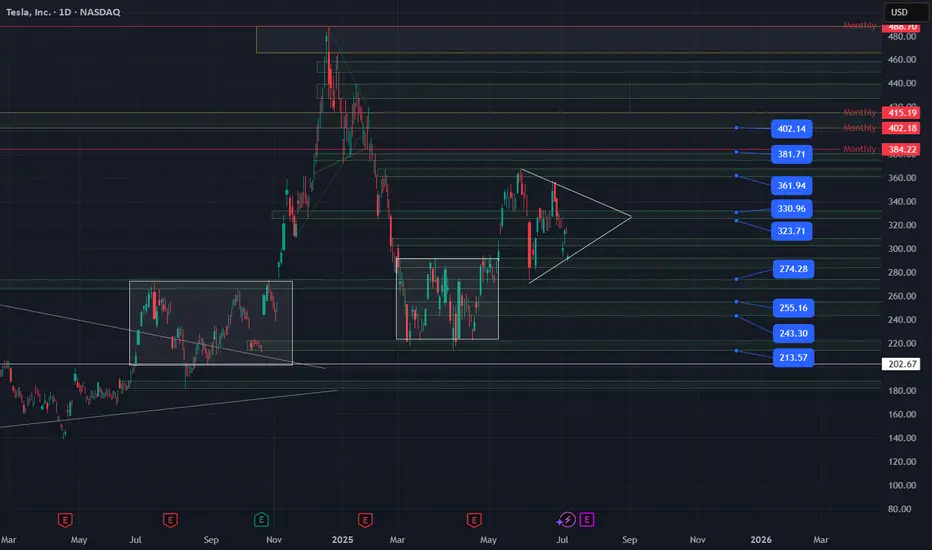
$TSLA Bullish Pennant Forming on Daily – Breakout Loading?Tesla ( NASDAQ:TSLA ) is currently trading within a bullish pennant formation on the daily timeframe — and this one is textbook.
It entered the pennant from lower prices, forming a clear flagpole. Since then, price has been compressing between:
📉 Two descending resistance levels → Lower highs
📈 Two ascending support levels → Higher lows
This symmetrical tightening creates a classic bullish continuation setup — if the breakout confirms. Also found support at horizontal level of support/resistance $229.
What I’m watching:
⇒ Break above pennant resistance with volume
⇒ Reaction to any macro or Tesla-specific news during this compression (earnings July 23)
TSLA has a habit of explosive moves after consolidation. Keep this one on high alert.
#TSLA #Tesla #technicalanalysis #bullishpennant #tradingview #DisciplineTrading
