TSX trade ideas
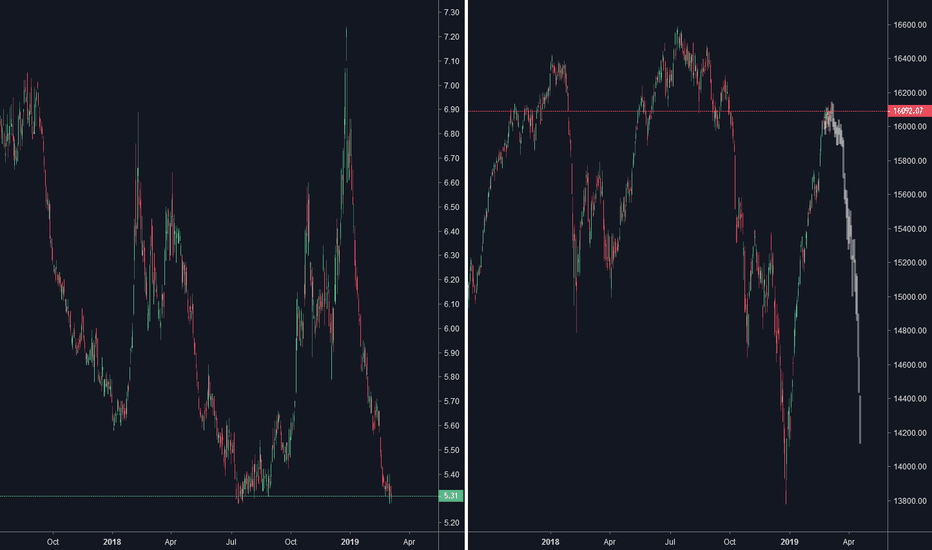
TSX, good chance for a short opportunity.Significant money has been made the last time the market had a hard correction with the 2X inverse ETF. Now with Canada holding interest rates and worldwide trade difficulties there's lots of fundamentals backing another short-term bear run. This is a good time to short the markets as you cant really lose money from shorting the top, worldwide economic growth has slowed significantly therefore a next All-Time-High not likely. The ETF has also reached a critical low point, at the same price point as when TSX hit ATH.
S&P/ TSX Composite Index Intraday Analysis: Bulls in trouble…Price action closed on December 24, 2018 below major support between 14,947.58 and 14,330.16. Moreover same close on December 24, 2018 saw price action close below its bullish trendline that has lasted over a decade.
Both scenarios above do call for a huge caution and/or warning for the current uptrend in the TSX. The market condition for the TSX in this case is therefore a downtrend to a side trend at best.
Resistance or overhead supply lies between 16,586.46 and 16,299.69.
The sideways market condition for the TSX considered in this analysis is better referred to as a rectangle top formation (tentative) that exists mainly between the upper boundary of support i.e. 16,586.46 and lower boundary of resistance i.e. 16,299.69.
Price breaking out above the high made on July 13, 2018 of 16,586.46 marks the resumption of the uptrend in the TSX.
Strong Bullish Pull BackStock Pick of the Day for North Bud Farms (NBUD) strong buying opportunity. LP candidate undervalued at .42$ per share (22 million$ market cap). Going rate at current stage is 65$ million based on previous acquisitions. Stock poised for significant gains in the coming weeks. Easy four bagger in the next 5 months. January 1st, 2019 stock will be likely valued between 1.50 - 2$ per share.
TSX closes below the 200 simple moving average. Bond yields, and the new trade deal the TSX looks very bearish. lets chat about it what are your thoughts? I think we will trend lower and continue this trend through RED October. The high in January looks like a shoulder and the recent high looks like the head. I have been thinking we would hit a correction in October and one more bull rally December and January to finish off the 2nd shoulder. I am %70 percent cash and %30 in the market currently waiting on the week to see what happens if the tsx pulls up or drops lower below the 200. Any thoughts
Tightening Ranges for TSX Indicative of Major Pull BackSimilar to the hx recessions of the past, tightening ranges have been a red flag for an upcoming catastrophic index price drop. By my calculations, we have 2 - 3 months before a crash and burn scenario. I will remain bullish until the index drops below 15,500. At which point, I will be shorting each and every sector on the index. This will be the one of the greatest opportunities for shorters from the past 60 years. I will not miss this opportunity. My first stock pick in the next couple months will be to short Air Canada, as raising Oil prices will surely effect profit margins on the sector. I do believe we are on the cusp of a major recession and there is nothing that will stop it. I am keeping a close eye on the Turkish lira as a default from banks in turkey will be systemic.
Black Swan - Beginning stages of Recession - Below 14,000 points14,900 - 15,200 support range. Negative impact will be felt throughout markets. US overly optimistic in winning trade War. Hx shows no one wins. All trade wars have resulted in extended medium to long term loses. Continued pressure after today's close will drop index to first support range of 15,500 (100%), but will ultimately not hold true support until 14,900 - 15,200 (50%). At this point, Writer will have to do further analysis for bear or bull market scenarios. Depending on resistance and global sentiment, a drop below 14,900 would indicate the start of a global recession.


