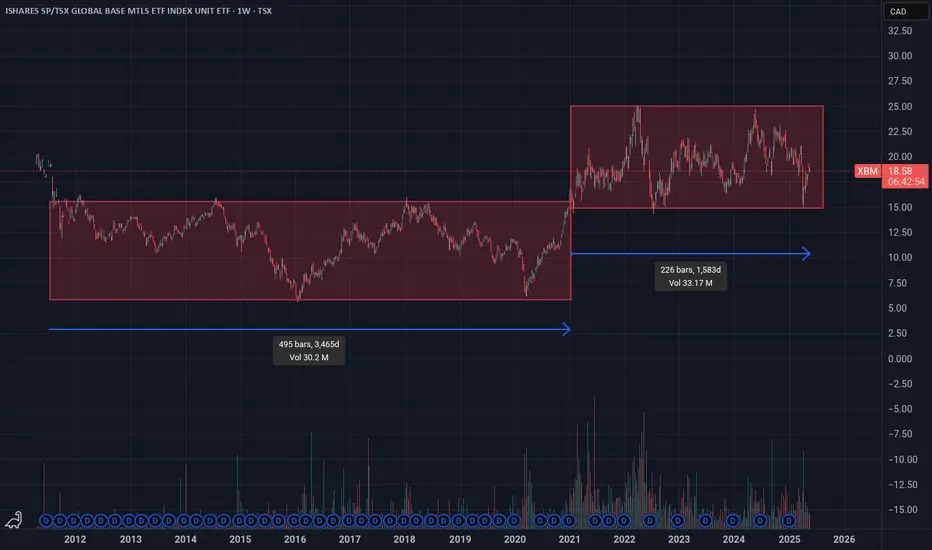
XBM - Long term Consolidation above it's previous consolidationI charted XBM (iShares S&P/TSX Global Base Metals Index Fund) and it's been consolidating above it's previous multi-year consolidation.
Previously, it touched the bottom twice before breaking out. Currently, it's already touched the low end of it's consolidation zone three times.
Maybe it's due fo
BLACKROCK ASSET MANAGEMENT CA LTD ISHARES S&P/TSX GLOBAL BASE METALS INDEX
No trades
Key stats
About BLACKROCK ASSET MANAGEMENT CA LTD ISHARES S&P/TSX GLOBAL BASE METALS INDEX
Home page
Inception date
Apr 12, 2011
Structure
Canadian Mutual Fund Trust (ON)
Dividend treatment
Distributes
Distribution tax treatment
Ordinary income
Income tax type
Capital Gains
Primary advisor
BlackRock Asset Management Canada Ltd.
The fund provides exposure to global companies engaged in the production or extraction of base metals. The underlying index is a subset of the S&P/TSX Global Mining Indexa market-cap-weighted index of global companies in the mining industry, listed on either US or Canadian exchanges. XBM specifically includes companies that are classified in any of the three GICS sub-industries: aluminum, copper, and diversified metals and mining. In addition, firms must also meet certain size and liquidity screens to be selected. Holdings are weighted by market-cap and are constrained such that no individual security exceeds 10% weight of the portfolio. The index is rebalanced quarterly.
Related funds
Classification
What's in the fund
Exposure type
Non-Energy Minerals
Stock breakdown by region
Top 10 holdings
XBM - iShares S&P/TSX Global Base Metals Index ETFWe are bullish on XBM-T in the short to medium term. XBM has broken out of the July 2014 and March 2018 resistance level. We like the trading channel and believe the price action will continue upward. The relative strength is pushing up against overbought. Our sell target is between $21.00 and $23.0


base metalsstarting to lag, gold to follow ??? down to red line good spot to monitor. zoom in on hrly/ 15 min charting for clues as it gets closer.

XBMenergy starting to drop, trend line resistance, similar pattern from before. gold miners bullish percent index at 100% , stocks could push for bit more like 2016 rally, dji still under 200ma so will it drag the others? Q2 reporting soon which should be disastrous.


See all ideas
Summarizing what the indicators are suggesting.
Oscillators
Neutral
SellBuy
Strong sellStrong buy
Strong sellSellNeutralBuyStrong buy
Oscillators
Neutral
SellBuy
Strong sellStrong buy
Strong sellSellNeutralBuyStrong buy
Summary
Neutral
SellBuy
Strong sellStrong buy
Strong sellSellNeutralBuyStrong buy
Summary
Neutral
SellBuy
Strong sellStrong buy
Strong sellSellNeutralBuyStrong buy
Summary
Neutral
SellBuy
Strong sellStrong buy
Strong sellSellNeutralBuyStrong buy
Moving Averages
Neutral
SellBuy
Strong sellStrong buy
Strong sellSellNeutralBuyStrong buy
Moving Averages
Neutral
SellBuy
Strong sellStrong buy
Strong sellSellNeutralBuyStrong buy
Displays a symbol's price movements over previous years to identify recurring trends.
Frequently Asked Questions
An exchange-traded fund (ETF) is a collection of assets (stocks, bonds, commodities, etc.) that track an underlying index and can be bought on an exchange like individual stocks.
XBM trades at 21.00 CAD today, its price has fallen −1.50% in the past 24 hours. Track more dynamics on XBM price chart.
XBM net asset value is 21.23 today — it's risen 9.26% over the past month. NAV represents the total value of the fund's assets less liabilities and serves as a gauge of the fund's performance.
XBM assets under management is 241.23 M CAD. AUM is an important metric as it reflects the fund's size and can serve as a gauge of how successful the fund is in attracting investors, which, in its turn, can influence decision-making.
XBM price has risen by 8.93% over the last month, and its yearly performance shows a 3.55% increase. See more dynamics on XBM price chart.
NAV returns, another gauge of an ETF dynamics, have risen by 9.26% over the last month, showed a 15.76% increase in three-month performance and has increased by 4.79% in a year.
NAV returns, another gauge of an ETF dynamics, have risen by 9.26% over the last month, showed a 15.76% increase in three-month performance and has increased by 4.79% in a year.
XBM fund flows account for −41.81 M CAD (1 year). Many traders use this metric to get insight into investors' sentiment and evaluate whether it's time to buy or sell the fund.
Since ETFs work like an individual stock, they can be bought and sold on exchanges (e.g. NASDAQ, NYSE, EURONEXT). As it happens with stocks, you need to select a brokerage to access trading. Explore our list of available brokers to find the one to help execute your strategies. Don't forget to do your research before getting to trading. Explore ETFs metrics in our ETF screener to find a reliable opportunity.
XBM invests in stocks. See more details in our Analysis section.
XBM expense ratio is 0.63%. It's an important metric for helping traders understand the fund's operating costs relative to assets and how expensive it would be to hold the fund.
No, XBM isn't leveraged, meaning it doesn't use borrowings or financial derivatives to magnify the performance of the underlying assets or index it follows.
In some ways, ETFs are safe investments, but in a broader sense, they're not safer than any other asset, so it's crucial to analyze a fund before investing. But if your research gives a vague answer, you can always refer to technical analysis.
Today, XBM technical analysis shows the buy rating and its 1-week rating is buy. Since market conditions are prone to changes, it's worth looking a bit further into the future — according to the 1-month rating XBM shows the buy signal. See more of XBM technicals for a more comprehensive analysis.
Today, XBM technical analysis shows the buy rating and its 1-week rating is buy. Since market conditions are prone to changes, it's worth looking a bit further into the future — according to the 1-month rating XBM shows the buy signal. See more of XBM technicals for a more comprehensive analysis.
Yes, XBM pays dividends to its holders with the dividend yield of 1.31%.
XBM trades at a premium (0.19%).
Premium/discount to NAV expresses the difference between the ETF’s price and its NAV value. A positive percentage indicates a premium, meaning the ETF trades at a higher price than the calculated NAV. Conversely, a negative percentage indicates a discount, suggesting the ETF trades at a lower price than NAV.
Premium/discount to NAV expresses the difference between the ETF’s price and its NAV value. A positive percentage indicates a premium, meaning the ETF trades at a higher price than the calculated NAV. Conversely, a negative percentage indicates a discount, suggesting the ETF trades at a lower price than NAV.
XBM shares are issued by BlackRock, Inc.
XBM follows the S&P/TSX Base Metals. ETFs usually track some benchmark seeking to replicate its performance and guide asset selection and objectives.
The fund started trading on Apr 12, 2011.
The fund's management style is passive, meaning it's aiming to replicate the performance of the underlying index by holding assets in the same proportions as the index. The goal is to match the index's returns.