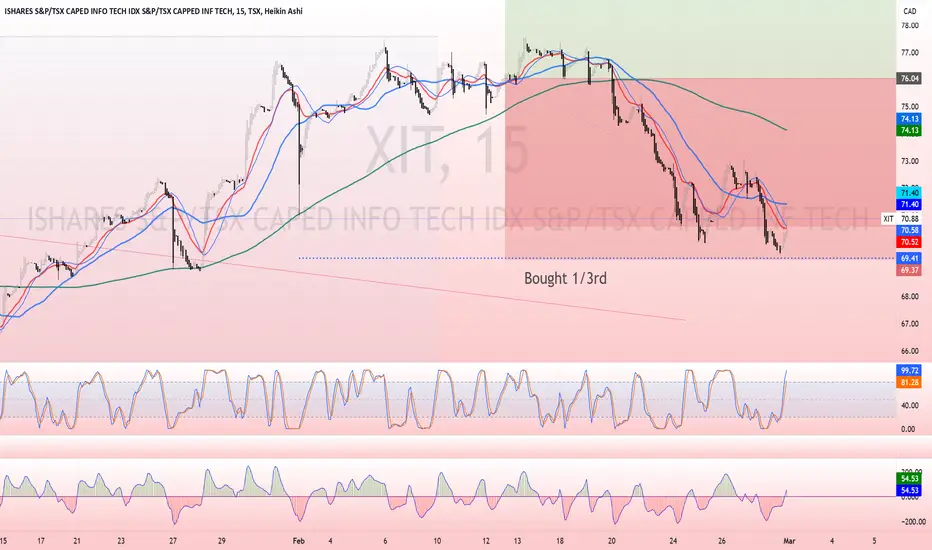
XIT LongStarting to edge back into a few ETF's now the 1 hour MA's have flipped. Nothing fancy here, small position looking to ride the waves. Expecting resistance as we go. Will move SL in stages giving it time to rise.
BLACKROCK ASSET MANAGEMENT CA LTD ISHARES S&P/TSX CAPPED INFORMATION TECHN
No trades
Key stats
About BLACKROCK ASSET MANAGEMENT CA LTD ISHARES S&P/TSX CAPPED INFORMATION TECHN
Home page
Inception date
Mar 19, 2001
Structure
Canadian Mutual Fund Trust (ON)
Dividend treatment
Distributes
Distribution tax treatment
Eligible dividends
Income tax type
Capital Gains
Primary advisor
BlackRock Asset Management Canada Ltd.
The fund provides a total market exposure to the Canadian technology sector. The underlying index draws stocks from both the S&P/TSX Composite and the S&P/TSX SmallCap Index that are classified by GICS as an information technology company, more specifically GICS Sector 45. The underlying index is market-cap-weighted, it applies a 25% cap to single constituents and usually undergoes quarterly rebalance. XIT currently employs a replicating strategy wherein it invests in securities in considerably the same proportions as they are represented in the underlying index.
Related funds
Classification
What's in the fund
Exposure type
Technology Services
Commercial Services
Electronic Technology
Stock breakdown by region
Top 10 holdings

XIT LongBeen on the road since late January, so I haven’t been updating much.
Entry on this one is currently going against me. That long black wick to the left marks the last stop-out location — some really poor trading here. Just when you think it’ll never pull back and finally let you in, you enter… an
XIT LongRe entry on this ETF, Tech is doing what it does, for some reason XIT is out performing TEC and XQQ. I am thinking the Canadian tech market is being pulled up by the Crypto ETF's. Will trail SL as usual on weekly HK candles. Being cautions as it feels a little like a revenge trade due to being stopp

XIT longWell Tech just keeps going, at the Canadian markets are out preforming the US so are the ETF's reflecting them. This is now my preferred ETF vs XQQ and TEC.

XIT ETF: potential rebound towards 57-58 targetXIT (iShares S&P/TSX Capped Information Tech Index ETF) is currently consolidating, with potential for a 10% upside if the price reaches the range of 52 to 53. The target zone for this possible move is approximately 57 to 58, with a potential pullback expected at that level.


Time to offload the techs?Less than two months ago, I suggested it was okay to buy TECH ETF's (they'd reached an earlier target I'd published). One I highlighted, the XIT (Canadian) has climbed dramatically and now that it's largest holding, Shopify has a market cap bigger than the Royal Bank of Canada, I figure enough is e


The XIT (Canadian TECH ETF) got down below my buy target of $25I suggested in an earlier post that I'd buy tech ETF's if they dropped to my target of $25. In this case, it got there and is rebounding nicely. Suggest it is okay to own.

Buy Canadian Tech ETF at $25Tech stocks beating may meet resistance soon. This ETF may be bought at $25 based on my interpretation of chart.

See all ideas
Summarizing what the indicators are suggesting.
Oscillators
Neutral
SellBuy
Strong sellStrong buy
Strong sellSellNeutralBuyStrong buy
Oscillators
Neutral
SellBuy
Strong sellStrong buy
Strong sellSellNeutralBuyStrong buy
Summary
Neutral
SellBuy
Strong sellStrong buy
Strong sellSellNeutralBuyStrong buy
Summary
Neutral
SellBuy
Strong sellStrong buy
Strong sellSellNeutralBuyStrong buy
Summary
Neutral
SellBuy
Strong sellStrong buy
Strong sellSellNeutralBuyStrong buy
Moving Averages
Neutral
SellBuy
Strong sellStrong buy
Strong sellSellNeutralBuyStrong buy
Moving Averages
Neutral
SellBuy
Strong sellStrong buy
Strong sellSellNeutralBuyStrong buy
Displays a symbol's price movements over previous years to identify recurring trends.
Frequently Asked Questions
An exchange-traded fund (ETF) is a collection of assets (stocks, bonds, commodities, etc.) that track an underlying index and can be bought on an exchange like individual stocks.
XIT trades at 73.31 CAD today, its price has fallen −2.58% in the past 24 hours. Track more dynamics on XIT price chart.
XIT net asset value is 73.39 today — it's risen 1.99% over the past month. NAV represents the total value of the fund's assets less liabilities and serves as a gauge of the fund's performance.
XIT assets under management is 631.41 M CAD. AUM is an important metric as it reflects the fund's size and can serve as a gauge of how successful the fund is in attracting investors, which, in its turn, can influence decision-making.
XIT price has risen by 2.59% over the last month, and its yearly performance shows a 34.44% increase. See more dynamics on XIT price chart.
NAV returns, another gauge of an ETF dynamics, have risen by 1.99% over the last month, showed a 12.01% increase in three-month performance and has increased by 34.51% in a year.
NAV returns, another gauge of an ETF dynamics, have risen by 1.99% over the last month, showed a 12.01% increase in three-month performance and has increased by 34.51% in a year.
XIT fund flows account for −188.67 M CAD (1 year). Many traders use this metric to get insight into investors' sentiment and evaluate whether it's time to buy or sell the fund.
Since ETFs work like an individual stock, they can be bought and sold on exchanges (e.g. NASDAQ, NYSE, EURONEXT). As it happens with stocks, you need to select a brokerage to access trading. Explore our list of available brokers to find the one to help execute your strategies. Don't forget to do your research before getting to trading. Explore ETFs metrics in our ETF screener to find a reliable opportunity.
XIT invests in stocks. See more details in our Analysis section.
XIT expense ratio is 0.63%. It's an important metric for helping traders understand the fund's operating costs relative to assets and how expensive it would be to hold the fund.
No, XIT isn't leveraged, meaning it doesn't use borrowings or financial derivatives to magnify the performance of the underlying assets or index it follows.
In some ways, ETFs are safe investments, but in a broader sense, they're not safer than any other asset, so it's crucial to analyze a fund before investing. But if your research gives a vague answer, you can always refer to technical analysis.
Today, XIT technical analysis shows the neutral rating and its 1-week rating is buy. Since market conditions are prone to changes, it's worth looking a bit further into the future — according to the 1-month rating XIT shows the buy signal. See more of XIT technicals for a more comprehensive analysis.
Today, XIT technical analysis shows the neutral rating and its 1-week rating is buy. Since market conditions are prone to changes, it's worth looking a bit further into the future — according to the 1-month rating XIT shows the buy signal. See more of XIT technicals for a more comprehensive analysis.
XIT trades at a premium (0.10%).
Premium/discount to NAV expresses the difference between the ETF’s price and its NAV value. A positive percentage indicates a premium, meaning the ETF trades at a higher price than the calculated NAV. Conversely, a negative percentage indicates a discount, suggesting the ETF trades at a lower price than NAV.
Premium/discount to NAV expresses the difference between the ETF’s price and its NAV value. A positive percentage indicates a premium, meaning the ETF trades at a higher price than the calculated NAV. Conversely, a negative percentage indicates a discount, suggesting the ETF trades at a lower price than NAV.
XIT shares are issued by BlackRock, Inc.
XIT follows the S&P/TSX Capped Information Technology Index - CAD. ETFs usually track some benchmark seeking to replicate its performance and guide asset selection and objectives.
The fund started trading on Mar 19, 2001.
The fund's management style is passive, meaning it's aiming to replicate the performance of the underlying index by holding assets in the same proportions as the index. The goal is to match the index's returns.