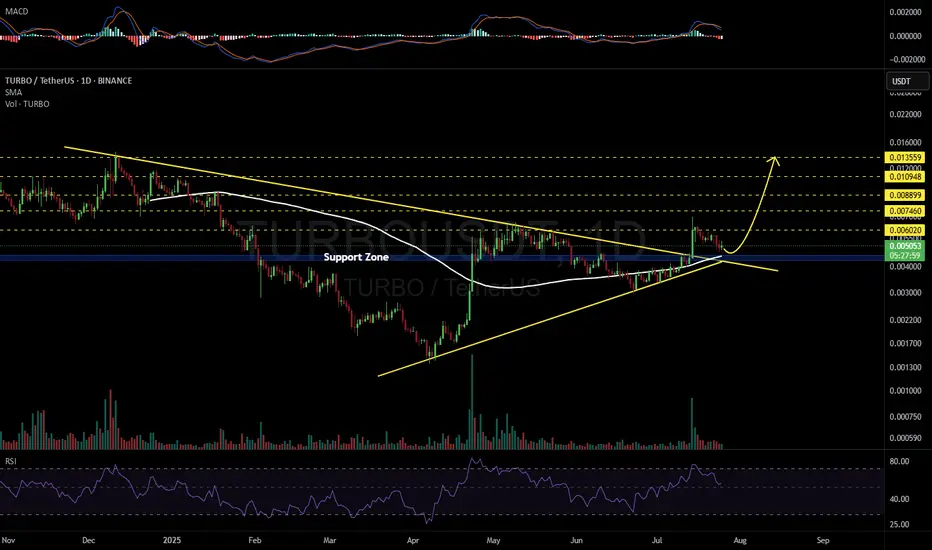
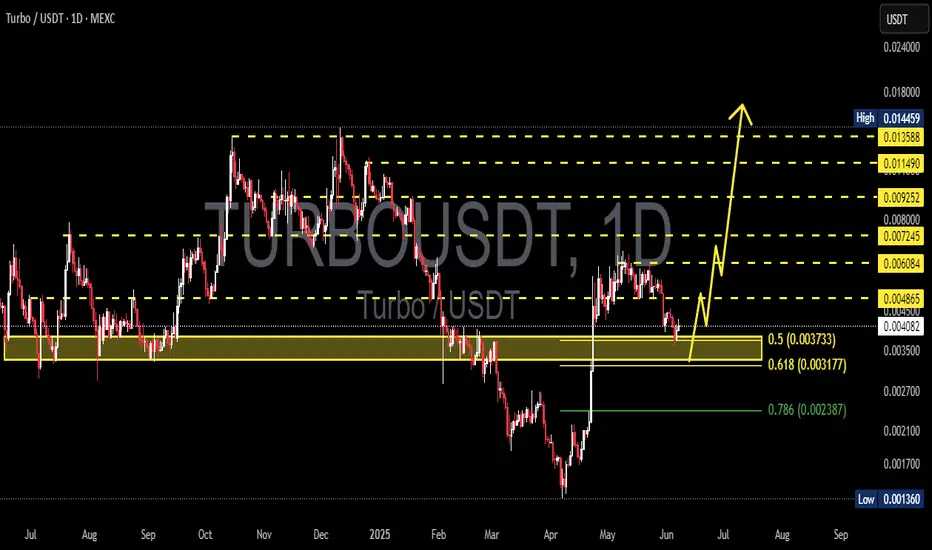
TURBOUSDT 1D#TURBO has broken above the symmetrical triangle and is now testing the support zone. This zone is further strengthened by multiple layers of support, including the Ichimoku Cloud and the SMA100 — making it a strong area for a potential bounce. We're expecting a price reversal from this zone. In case of a successful bounce, the targets are:
🎯 $0.006020
🎯 $0.007460
🎯 $0.008899
🎯 $0.010948
🎯 $0.013559
⚠️ As always, use a tight stop-loss and apply proper risk management.
TURBOUSDT trade ideas
Cup and handle on TOSHIEvery time I look at the TURBO chart I can't help but see this cup and handle formation.
TURBOStill in a corrective wave with larger wave up, the correction may have ended already at 0.004842
The confirmation would be the break out of the corrective wave channel
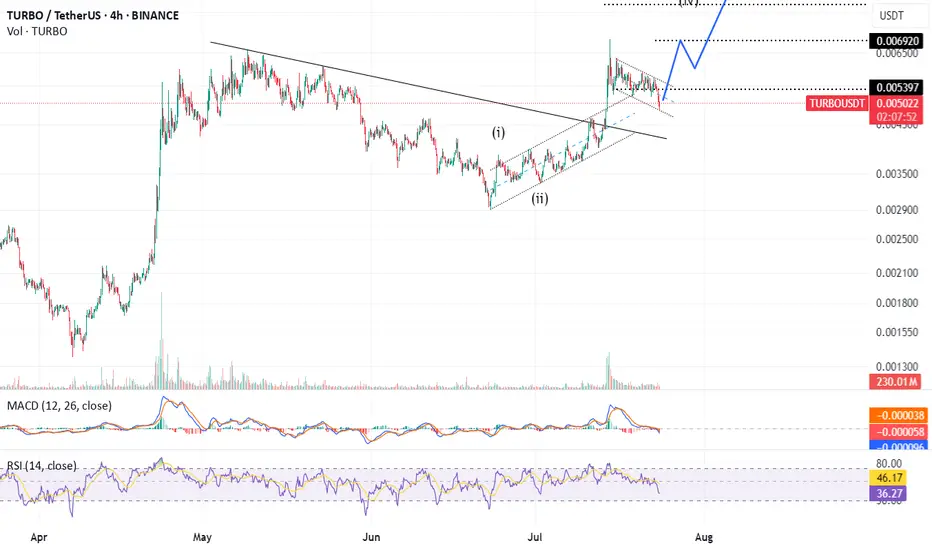
TURBO/USDT - H4 - Wedge Breakout (29.06.2025)The TURBO/USDT pair on the H4 timeframe presents a Potential Buying Opportunity due to a recent Formation of a Wedge Breakout Pattern. This suggests a shift in momentum towards the upside and a higher likelihood of further advances in the coming Days.
Possible Long Trade:
Entry: Consider Entering A Long Position around Trendline Of The Pattern.
Target Levels:
1st Resistance – 0.005173
2nd Resistance – 0.005994
🎁 Please hit the like button and
🎁 Leave a comment to support for My Post !
Your likes and comments are incredibly motivating and will encourage me to share more analysis with you.
Best Regards, KABHI_TA_TRADING
Thank you.

Just a couple of lines.Depending on what waves of liquidity will be pumped from bitcoin to slagcoins,
many things are possible. Faster? Lower price.
Slower? More accumulation, stronger level protection.
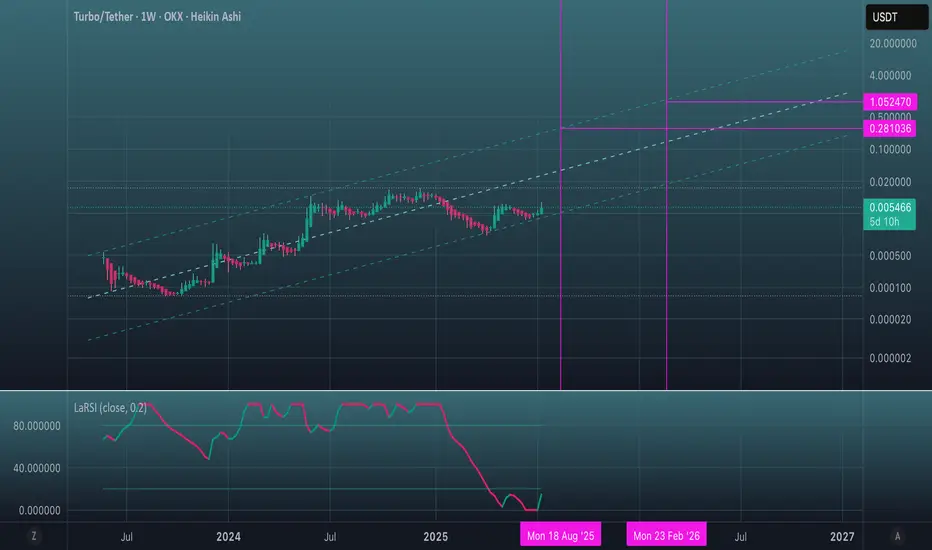
LaRSI may be preparing to storm the 20 line on the weekly chart.
Positive.
You may agree or disagree, at your discretion.
TURBOThe price may pull back and appears to be approaching a key support level around 0.003100 USDT, which was also a previous area of interest. There's an indicated potential for the price to find support within zone 0.003100 USDT and then rebound towards the 0.005600 USDT level. This suggests that while there might be further short-term volatility, the market could be looking for a base before attempting another move higher. Use stop loss at 0.002266 to manage your risk.

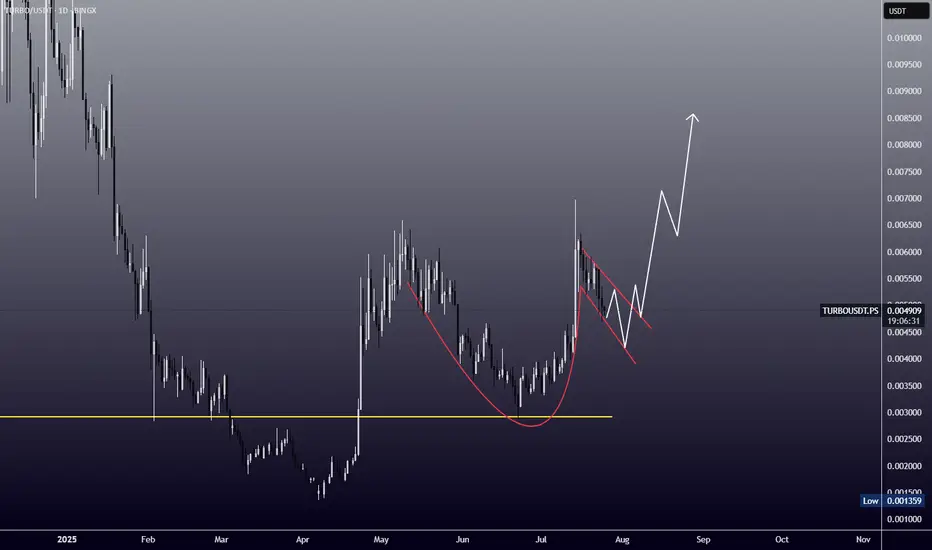
Turbousdt trade ideaTURBOUSDT has made a significant move following a breakout from a cup and handle formation. This classic bullish pattern indicates strong potential for upward momentum. The price is currently approaching the final target of this setup, which corresponds to the height of the cup.
We anticipate that this level will serve as a strong supply zone, where a price correction is likely to occur. We should be prepared for this potential correction and look to the handle level, as shown on the chart, for immediate support.
This handle level is expected to act as a key area for immediate buy back zone, potentially providing a favorable entry point for those looking to capitalize on the next phase of the trend. Careful monitoring of price action around these critical levels will be essential for effective trading decisions.

TURBO - Nailed the dropCalled this short setup last month we just hit target. A swing 45% drop happened!
Check it out here
Please support this idea with a LIKE👍 if you find it useful🥳
Happy Trading💰🥳🤗

TURBO BEAR FLAG PATTERN - TIME TO SELLSeen here is MYX:TURBO breaking the support trendline and signal a downtrend. You may want to take profit here or pick a short position. For Turbo short,
Entry price: $0.005713
Stop loss: $0.006562
Take profit 1: 0.004845
Take profit 2: 0.003944
Take profit 3: $0.0031
Not a financial advice.
Please support this idea with a LIKE👍 if you find it useful🥳
Happy Trading💰🥳🤗

TURBOUSDT 1D#TURBO — Ready to Explode? 💥
#TURBO has formed a Megaphone Pattern on the daily chart, and a golden cross looks set to form soon — a strong bullish signal.
A breakout above the pattern resistance could trigger a massive bullish wave. If that happens, the targets are:
🎯 $0.006371
🎯 $0.007918
🎯 $0.009466
🎯 $0.011670
🎯 $0.013561
⚠️ Always use a tight stop-loss to manage risk and protect your capital.

TURBOUSDT 1D AnalysisTURBO ~ 1D Analysis
#TURBO Buy gradually from here if you still have confidence in this coin with a short term target of at least 15%+ from here. Long term target $0.0145
TURBO ANALYSIS📊 #TURBO Analysis
✅There is a formation of Falling Wedge Pattern on daily chart and currently pullback around its major support zone🧐
Pattern signals potential bullish movement incoming after sustain above the major support zone and breaks the pattern with good volume
👀Current Price: $0.004050
🚀 Target Price: $0.004470
⚡️What to do ?
👀Keep an eye on #TURBO price action and volume. We can trade according to the chart and make some profits⚡️⚡️
#TURBO #Cryptocurrency #TechnicalAnalysis #DYOR

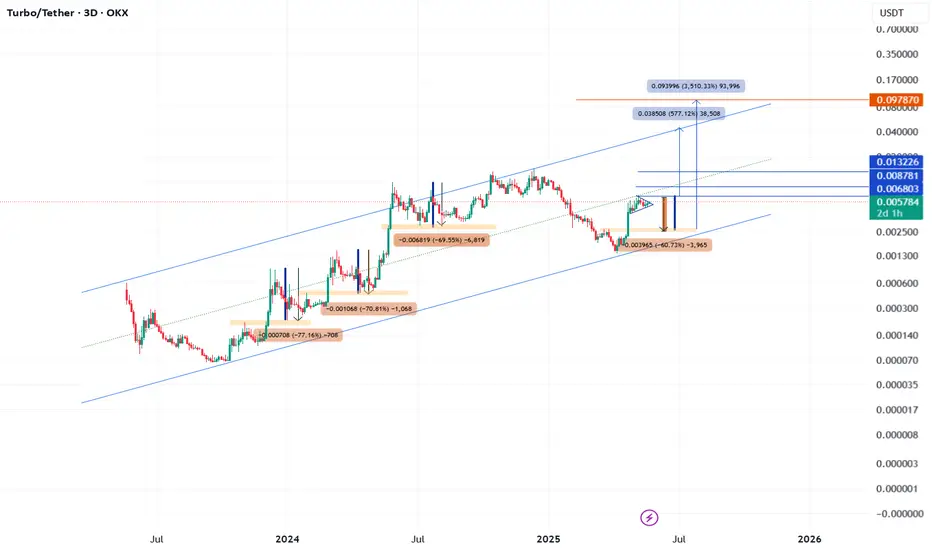
TURBO USDT UPDATE The currency is being updated, but there is a warning for those who have entered it and those who want to enter it now. If you look back at its old indicators, you'll notice that it always corrects between 65% and 70%.
I wanted to point out that if it closes weekly above 0.0061.5, we'll see the targets specified above.
However, if it closes weekly below 0.0050, escape from it and you'll be headed for a 65% correction.
Buy in fear, sell in greed.Hello dears
Due to the price growth, now in the pullback you can buy in support areas in steps and move with it to the specified targets, of course with capital management.
*Trade safely with us*

TurboTurbo is cryptocurrency with low volume be careful
Entry price
0.0036
stop loss 0.0009
take profit
0.012
0.031
#TURBO/USDT#TURBO
The price is moving within a descending channel on the 1-hour frame, adhering well to it, and is heading for a strong breakout and retest.
We are seeing a bounce from the lower boundary of the descending channel, which is support at 0.005170.
We have a downtrend on the RSI indicator that is about to be broken and retested, supporting the upward trend.
We are looking for stability above the 100 moving average.
Entry price: 0.005466
First target: 0.005592
Second target: 0.005746
Third target: 0.005962

TURBOUSDT.P coin is forming a Head & Shoulder Pattern on the 1H TURBOUSDT.P coin is forming a Head & Shoulder Pattern on the 1H Time Frame.
After the chart pattern breakout, we can enter a Short Position.
According to our CGI Indicator, the 5M, 15M & 240M Time Frames are showing Bearish Tag and the 1H and 1D Charts are still showing Bullish Tag. From those two Bullish tags, 1H or Bearish Tag comes
After the Golden Cross occurs and the Short Tag comes, we can enter a Short Position.

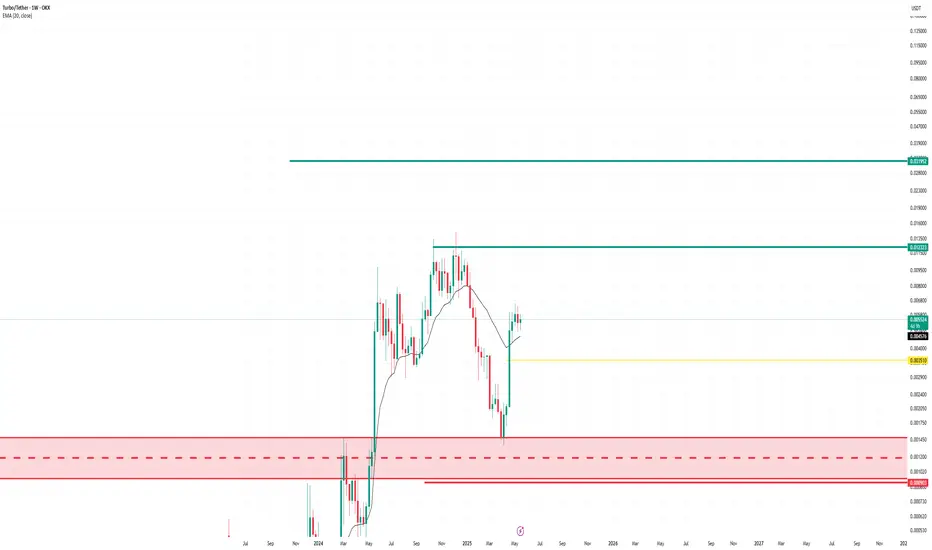
TURBO USDTTurbo coin has finished testing the support, especially the support of 0.0012, and now it has rebounded upon touching the bottom of the channel, so I believe its next target is 0.036.

$TURBO Loading Up — Breakout Incoming?🚀 MYX:TURBO – Breakout Loading…
MYX:TURBO is showing serious signs of strength. Price has been consolidating just below key resistance, forming a classic compression zone — and higher lows continue to step in with conviction.
🟢 Key Structure:
Consistent higher lows
Tight range consolidation
Building volume = Pressure cooker setup
Once this upper resistance breaks, we could see a strong move toward $0.01+, potentially kicking off the next leg up.
📌 Watching for:
Break and retest of resistance zone
Surge in volume on breakout
Quick momentum toward target
This setup screams low-risk, high-reward with a clean invalidation below recent swing lows.
Breakout season is here. Don’t sleep on $TURBO.

TURBOUSDT Forming an Ascending Triangle | Breakout Incoming?Hey traders! 👋
TURBOUSDT has been catching some serious attention lately, and for good reason. After a sharp rally, it’s now forming one of the most powerful bullish continuation patterns out there — an ascending triangle.
Let’s take a closer look at what’s happening here 👇
📐 Technical Structure: Ascending Triangle
The chart clearly shows higher lows pressing against a horizontal resistance — a classic ascending triangle. This often signals that buyers are building pressure and a breakout could be around the corner.
Key Observations:
Flat Resistance: Around the 0.00629 area. Price has tapped it multiple times, showing strong supply.
Rising Support Trendline: Buyers are stepping in at higher levels, tightening the range.
Volume: There's a noticeable increase in volume near the resistance, which could fuel the breakout.
🎯 Target Levels if Breakout Occurs
If price breaks above the horizontal resistance with strong momentum, here are the potential targets based on recent structure and extension zones:
TP1: 0.008846
TP2: 0.010783
TP3: 0.013338
TP4 (Stretch Target): 0.014000
Each level aligns with key psychological or historical resistance zones.
⚠️ What Could Go Wrong?
Not every triangle breaks upward — here's what to watch for:
False Breakouts: A wick above the resistance without follow-through could be a trap.
Break of Ascending Trendline: If price falls below the rising support, this could invalidate the pattern and trigger a deeper pullback.
Volume Drops: Weak volume during breakout attempts often signals a lack of conviction.
🛠️ How to Approach This Trade
Wait for Confirmation: Look for a candle close above 0.00629 with increased volume.
Manage Risk: Set a stop-loss just below the ascending trendline or recent swing low.
Scale Out: Take partial profits at each target level to lock in gains.
📌 Final Thoughts
TURBO is gearing up for a potential explosive move. Whether it breaks out or fakes out, this pattern is one to watch closely. Keep alerts on the breakout zone and be ready for action — but as always, protect your capital first.
📢 Do you think it’ll explode from here, or is this another bull trap? Let me know in the comments below and share your own analysis!

Turbo Trade!!!Turbo is getting ready for the next Leg Up
I think is a good time to add some using SL.
DYOR
TURBO ANALYSIS🔆#TURBO Analysis : Channel Following ⛔️⛔️
As we can see that #TURBO is following ascending channel on 4h time frame. We can see a bullish formation here. And if it trade with good volume then we can see a proper bullish move in #TURBO📈📈
🔖 Current Price: $0.005610
⏳️ Target Price: $0.006160
⁉️ What to do?
- Keep your eyes on the chart, observe trading volume and stay accustom to market moves.🚀💸
#TURBO #Cryptocurrency #ChartPattern #DYOR
