TURBOUSDT Triangle Breakout! TURBOUSDT technical analysis update
TURBOUSDT has formed a symmetrical triangle pattern and is now breaking the triangle resistance with high volume on the daily chart. The price is also trading above the 100 and 200 EMAs, which could signal a strong bullish move ahead.
Regards
hexa
TURBOUSDT trade ideas

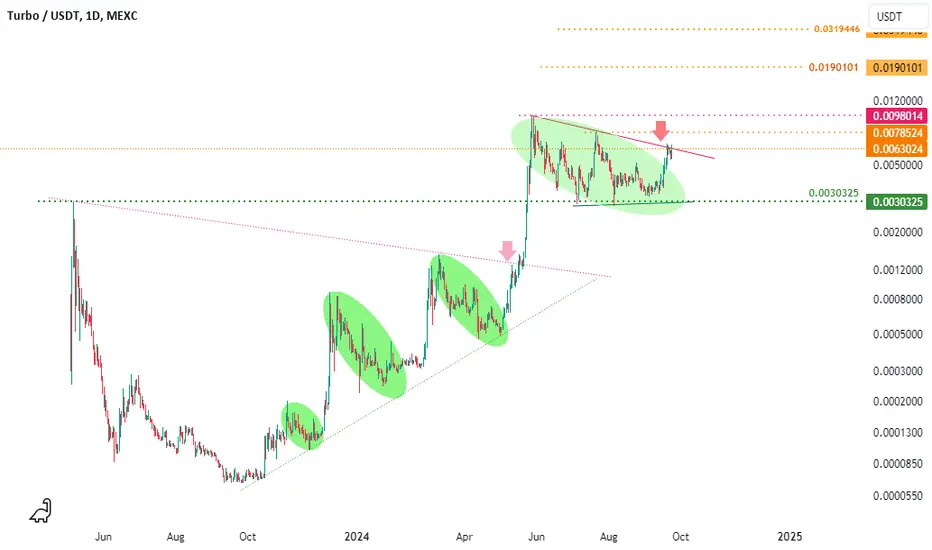
Turbo price get ready to... #TURBO price has just surged upwards by +20%.
and this is after a prolonged consolidation that lasted all summer.
Generally speaking, if you look at the OKX:TURBOUSDT chart, you'll see that consolidations in this formation are a specialty of MMs who control the price.
1 If you have been sitting in the position all summer, then at the chart you can see the levels where you can take profits.
2 If you want to buy #TURBO, we think it's safe to do so when the #TURBOUSD price manages to gain a foothold above the trend line, as indicated by the blue arrow.
Be careful! Below 0.0033, there is a 60% gap!

TURBOUSDTWe can attempt to buy TURBOUSDT from specified level as it makes HL , also 0.618 FIB level occur indicate that it moves upward.
SL , TP mention in chart.

TURBOUSDT LONG POSITIONThis currency is pulling back after a strong upward movement in the daily time frame. A pink range can be a very strong support

TURBO is really preparing for Turbo mode (TA + trade plan by BF)Technical Analysis by Blaž Fabjan
Falling Wedge Pattern:
The chart displays a falling wedge, which is a bullish continuation pattern. Typically, this pattern signifies a potential breakout to the upside as the price consolidates before resuming its upward trend.
The wedge is identified with the resistance (upper line) and support (lower line) converging. The price is nearing the apex, suggesting that a breakout may be imminent.
Volume:
The volume seems to be relatively stable. A breakout from the wedge with a corresponding increase in volume would confirm the strength of the move.
In falling wedge patterns, diminishing volume during the consolidation phase is common, which aligns with the current scenario. Traders should watch for volume spikes on a breakout.
Indicators:
VMC Cipher_B Divergences:
The indicators at the bottom are showing several divergences. Notably, the green dots (or divergence indicators) suggest potential bullish momentum building up.
RSI (Relative Strength Index):
The RSI is around the 47.49 mark, suggesting a neutral zone, neither oversold nor overbought. An upward movement in RSI above 50 would signal increased bullish momentum.
Stochastic Oscillator:
The Stochastic Oscillator is at 62.61 (with the signal line at 58.17), indicating moderate bullish momentum. The oscillator has moved upward from a lower level, which could be a prelude to a potential bullish breakout.
Support and Resistance:
Support: The lower line of the falling wedge around 0.00625 USDT acts as a key support zone.
Resistance: The upper line of the wedge around 0.00685 USDT acts as resistance. A break above this level could lead to significant price appreciation.
If the price breaks the 0.00685 USDT resistance with strong volume, it could test the 0.0075 USDT area and beyond.
Trading Plan:
Entry:
Aggressive Entry: Consider entering the trade now, near the bottom of the falling wedge, around the 0.0064 USDT area, expecting the wedge to break out soon.
Conservative Entry: Wait for a confirmed breakout above the wedge's resistance at 0.00685 USDT. Look for a close above this level with a volume spike to confirm the breakout.
Stop Loss:
Place a stop-loss below the support of the wedge, around 0.0062 USDT. This gives room for minor price fluctuations but protects against a downside breakout.
Take Profit Targets:
First Target: 0.0075 USDT (measuring the height of the wedge and projecting it from the breakout point).
Second Target: 0.0080 USDT (psychological resistance level).
Final Target: If momentum continues strong, 0.0085-0.0090 USDT.
Risk Management:
Risk 1-2% of your portfolio on this trade.
Ensure a risk/reward ratio of at least 1:3 for a favorable setup.
Monitor the RSI and Stochastic:
If the RSI rises above 50 and the Stochastic Oscillator continues to trend upward, the likelihood of a breakout increases.
Exit Strategy:
In case the wedge pattern fails and the price breaks down below 0.0062 USDT, exit the trade to avoid larger losses.
If the price hits the first target (0.0075 USDT), consider taking partial profits and moving your stop loss to break-even to secure the trade.
Summary:
Potential breakout: The chart is indicating a falling wedge continuation pattern with a potential breakout to the upside. Indicators are showing neutral-to-bullish signals, and volume is crucial for confirming any upcoming breakout.
Risk/Reward:
Set up your entry points based on either a more aggressive or conservative approach, but ensure proper risk management and stop-loss placement.
Monitor the price action closely as it approaches the resistance, and act accordingly based on confirmation signals.

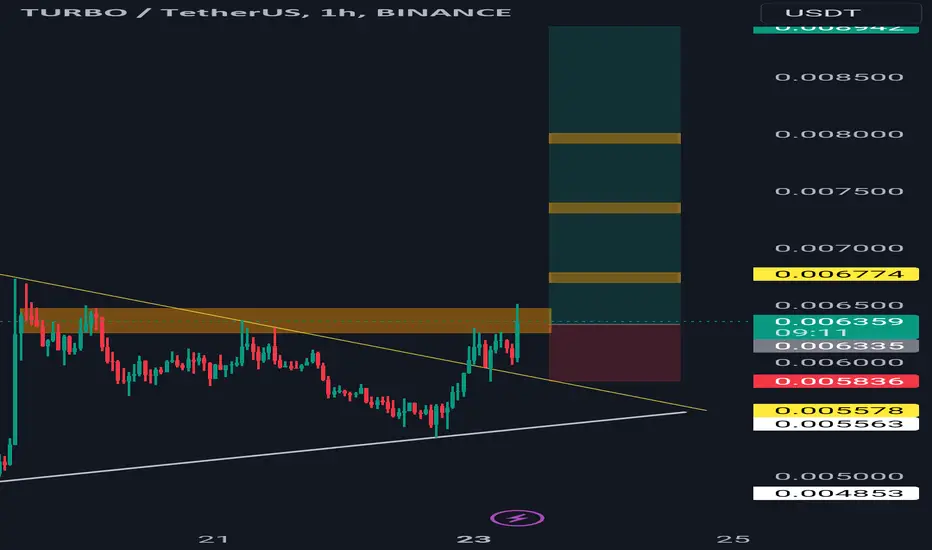
TURBO ANALYSIS🔮 #TURBO nalysis 💰💰
📊 #TURBO is making perfect and huge rounding bottom pattern in 4hr time frame, indicating a potential bullish move. If #TURBO breakout the pattern with high volume then we will get a bullish move📈
🔖 Current Price: $0.006200
⏳ Target Price: $0.007170
⁉️ What to do?
- We have marked crucial levels in the chart . We can trade according to the chart and make some profits. 🚀💸
#TURBO #Cryptocurrency #Pump #DYOR

Turbo Breakout and Upcoming Cycle Low StrategyTurbo has broken out of its narrowing wedge and most likely flipped it into support. This could be a breakout-retest-resumption, but its next cycle low is coming up quickly around October 4th. I have a feeling the cycle low will extend to October 6th to sync up with BTC and stocks. I’ve made my core allocations, and my strategy is to add exposure during the next cycle low, between October 4-6 (though it could happen a few days before or after). It should be easy to identify when you see a price drop—unless there's a very big rally, in which case the dip will be harder to spot. Another buying opportunity will arise around November 9, with a 3-4 day window on either side.
Looking forward to seeing what Turbo can deliver.

Turbo looks good for midterm Turbo Looks Good For Midterm Breakout & Retest Has Already Confirmed Check Recent Chart Data When Turbo Breaks Consolidation Its Gives Strong Bullish Rally In Look At Last Breakout It Gives 1400% After Breakout
As Of Now Breakout & Retest Has Already Confirmed Im Expecting 200%+ Bullish wave In Coming Days

Turbo Looking Great Turbo/USDT appears to be poised for a breakout, as it tests horizontal resistance. If successful, a bullish move of 20-40% could be on the horizon in the short term. Remember to do your own research—this is not financial advice.


#TURBOUSDT ( GREEN CYCLES )
The previous analysis
()
ended with a growth of over 900% (exiting the third green cycle).
Now it has completed another green cycle and seems to break the ceiling.
Be aware of this in the next day or two
Turbo/Usdt Plan Turbo/USDT looks promising for a potential short-term bullish move. Remember, this isn't financial advice; always do your own research and manage your risks accordingly.
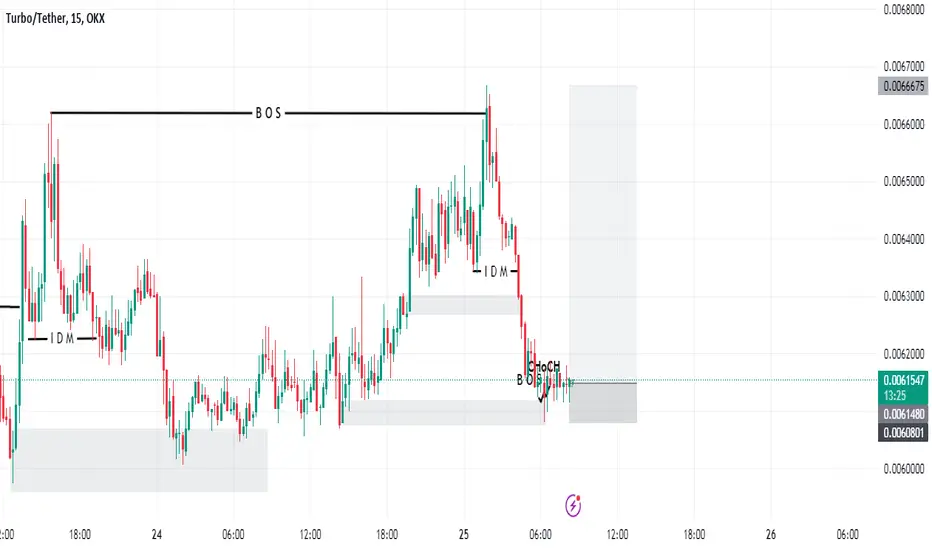
LONG #TURBOUSDT15m TF. The instrument has formed a cascade of several resistance levels, behind each of which I expect to see the stops of the shorts of the participants who opened positions from them. Active compression and local increase of lows indicates the interest and strength of buyers.
I expect to see the formation of consolidation and an increase in activity in the glass with a tape of transactions before the breakdown of each of the levels.
1TP — 0,0063437
2TP — 0,0063977
3TP — 0,0064547

TURBO/USDT technical analysis and a trading plan by BFTechnical Analysis by Blaž Fabjan
Chart Pattern (Falling Wedge): The chart shows a falling wedge pattern, which is typically a bullish reversal signal. This is evidenced by the downward sloping trendlines converging towards each other with decreasing price swings.
Support and Resistance:
Resistance Line (Upper Trendline): The price has tested this level multiple times but has failed to break through convincingly. A break above this resistance could signal a bullish move.
Support Line (Lower Trendline): The price has respected the support line, and it appears to be nearing another test of this level. If the price bounces from this support, it could confirm the bullish trend continuation.
RSI (Relative Strength Index):
The RSI is currently around 62, indicating that the price is in the neutral-to-slightly-overbought territory. However, it is not yet in the overbought zone (>70), meaning there could still be room for an upward movement.
Stochastic Oscillator:
The stochastic is around 82, suggesting that the market may be overbought in the short term. There could be a minor pullback before a larger move upward.
Volume:
There is moderate volume, but there isn't a significant volume spike yet to confirm a breakout. A notable increase in volume would be a good confirmation signal for a breakout.
MACD (VMC Cipher B):
The MACD-like indicator shows a potential bullish divergence. The oscillator is showing signs of reversal upward, further supporting the idea of a potential upward move.
Trading Plan:
Entry Strategy:
Aggressive Entry: Consider entering near the current price or slightly lower if the price bounces off the support trendline. This could offer an early position before the potential breakout.
Conservative Entry: Wait for a confirmed breakout above the resistance line (above the wedge pattern), ideally accompanied by a volume increase. This reduces risk but could result in entering at a higher price.
Take Profit (TP):
First TP: Set your first target around $0.0075 to $0.0080, near previous local highs, where sellers might emerge.
Second TP: If the breakout is strong and volume supports it, the next target can be around $0.0090, which is the level indicated by the large arrow on the chart, signaling the longer-term upward move.
Stop Loss (SL):
Place your stop loss slightly below the support line (around $0.0050) to limit downside risk in case of a bearish breakdown.
Risk Management:
Risk no more than 1-2% of your trading capital per trade.
Adjust your position size based on your risk tolerance and the distance between your entry point and stop loss.
Summary:
The TURBO/USDT chart shows a bullish setup with the potential for a breakout from a falling wedge pattern.
A conservative trader might wait for a confirmed breakout above resistance, while an aggressive trader could enter on a bounce from support.
The primary risk is a breakdown below support, which would invalidate the bullish thesis.
This strategy assumes that market conditions remain favorable, and the wedge pattern holds up. Keep an eye on the volume and other indicators to validate your decisions.

TURBOUSDTWe can attempt to buy TURBOUSDT from specified level as it make HL , also 0.618 FIB level intact indicate that it moves upward.
SL , TP mention in chart.

TURBO ANALYSIS📊 #TURBO Analysis
✅There is a formation of Descending triangle pattern on daily chart with a perfect breakout🧐
Pattern signals potential bullish movement incoming after a small retest 📉
👀Current Price: $0.005770
🚀 Target Price: $0.009400
⚡️What to do ?
👀Keep an eye on #TURBO price action and volume. We can trade according to the chart and make some profits⚡️⚡️
#TURBO #Cryptocurrency #TechnicalAnalysis #DYOR

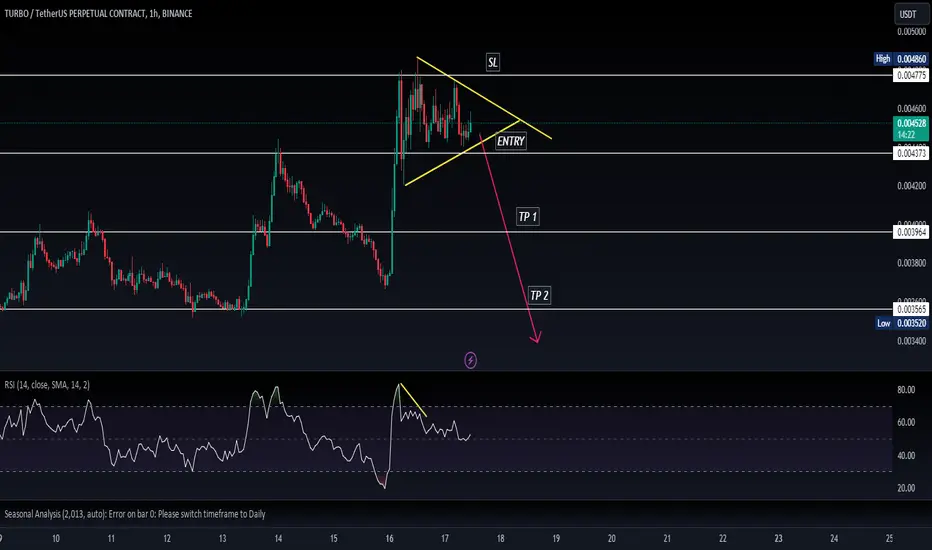
TURBOUSDT.PTURBOUSDT.P is in reversal zone.
Bearish divergence also shown in RSI.
We wait for more confirmation.
If price will break the last LL then we will enter the trade.


TURBOUSDTTURBO ~ 1D
#TURBO The bulls will regain control after successfully breaking through the resistance line of this pattern.

TUBROUSDT.PTURBOUSDT.P is in reversal mode.
Bearish divergence also shown in RSI.
symetric triangle also formed .
If price will broke from lower side then trend must be going down .
we wait and watch for the breakout of symetric triangle pattern.
Buy Trade Idea for TURBO TURBO is a rapidly emerging cryptocurrency that has captured the attention of investors due to its unique technological advancements and promising market potential. Key fundamentals include:
- **Innovative Protocol Design:** TURBO’s architecture is built for speed and efficiency, allowing it to process transactions faster than many other blockchain networks, which makes it ideal for high-frequency applications and DeFi solutions.
- **Scalability:** TURBO is designed to scale effortlessly, accommodating increasing transaction volumes without compromising performance. This scalability positions it as a strong contender for long-term adoption as demand grows.
- **Active Developer Community:** A thriving and active development community continues to innovate on the TURBO platform, bringing new updates and ensuring the sustainability of the network’s growth.
- **Partnerships and Use Cases:** TURBO has already secured significant partnerships with key players in various industries, further driving its utility and integration into the broader blockchain ecosystem.
Given these robust fundamentals, TURBO presents a compelling buy opportunity for investors seeking exposure to an innovative cryptocurrency with strong growth potential.
Disclaimer
Trading and investing in cryptocurrencies involve significant risks, including the potential for substantial losses. The content provided here is for informational purposes only and should not be considered financial advice. Always conduct thorough research, evaluate your risk tolerance, and consult a financial advisor before making any investment decisions. Past performance is not indicative of future results, and cryptocurrency prices can be highly volatile.

TURBO: Verge of Bullish pennant breakout!! (Gain: 7x to 10x)Join our community and start your crypto journey today for:
In-depth market analysis
Accurate trade setups
Early access to trending altcoins
Life-changing profit potential
Hello everyone,
I'm curating a list of promising projects to hold for the upcoming bull run.
1. FETUSDT (already posted)
2. ONDOUSDT (already posted)
3. AAVEUSDT (already posted)
4. ANKRUSDT (already posted)
5. ORDIUSDT (already posted)
6. TURBOUSDT
Let's analyse TURBOUSDT both fundamentally and technically.
FUNDAMENTAL ANALYSIS:
This first ever memecoin created by AI. Turbo Token began as a bold experiment in cryptocurrency creation. Inspired by the power of artificial intelligence, the project's founder turned to GPT-4 with a simple challenge: create the next great meme coin.
TECHNICAL ANALYSIS:
TURBO Token is exhibiting a bullish pattern, trading within a bullish pennant on the weekly timeframe. This pattern often signals a continuation of an uptrend.
Technical indicators supporting a bullish outlook include:
Price Support: The price is currently supported by the 200-day moving average.
Breakout: A recent breakout above the 100-day moving average on the daily timeframe suggests growing momentum.
Volume Spike: A significant increase in 24-hour trading volume indicates rising interest.
Buying Levels:
$0.0036236 to $0.0030795
Target Level:
$0.0096940 (short term)
Hold for 7x - 10x (long term)
If you find this analysis helpful, please hit the like button to support my content! Share your thoughts in the comments and feel free to request any specific chart analysis you’d like to see.
Happy Trading!!
