TURBO/USDT LOOKS READY FOR AN ATH!!Hey everyone!
If you're enjoying this analysis, a thumbs up and follow would be greatly appreciated!
TURBO looks very good in the daily time frame. Breaking out from the descending triangle pattern and a retest is also done. Now, it looks ready for a big pump. Buy some here and add more in the dip.
Entry range:- $0.0036-$0.0042
Targets:- $0.00495/$0.0067/$0.0082/$0.0095
SL:- $0.0030
What are your thoughts on TURBO's current price action? Do you see a bullish pattern? Share your analysis in the comments below!
TURBOUSDT trade ideas

TURBO = Bullish Breakout is Coming!
On Balance Volume shows that whales have been accumulating.
Price made a Double Bottom Reversal pattern.
Price is above 4H 200 Simple Moving Average.
Price looks to make a breakout above it's downtrend of resistance.

Crypto has no love for you my friend....... Crypto has no love for you my friend, she will chew you up and spit you out on the floor and laugh. You think you know her ? You don't. She will looking lovingly to the right at you, and then move quickly to the left, leaving you standing there with you pants down around you ankles as she laughs. You think you will get rich with her. You won't. She will drain you of your money and then leave you laying on the floor after she has kicked you in the groin several times, only to move on to her next lover. She sleeps only with one, and that is the Devil.
Go ahead, invest heavily in this one. She will turn around soon and then take you to the moon for your honeymoon. Of course she will, you will dream of your trip with her, but did she tell you, there is no air on the moon. Why is she laughing ?
Right now she is hungry my friend, very hungry and she lusts for only one thing and that is your liquidity and she will not be denied. Tonight deep in the forest we shall hear your screams and know this to be true.
Good night.

Turbo Longbreaking the descending triangle. we can expect a bullish trend from here. Also back supported by ETH.

Turbo the memes beeing memes I think turbo will rise soon we see the support still droping the price but memes are memes so we rise soon

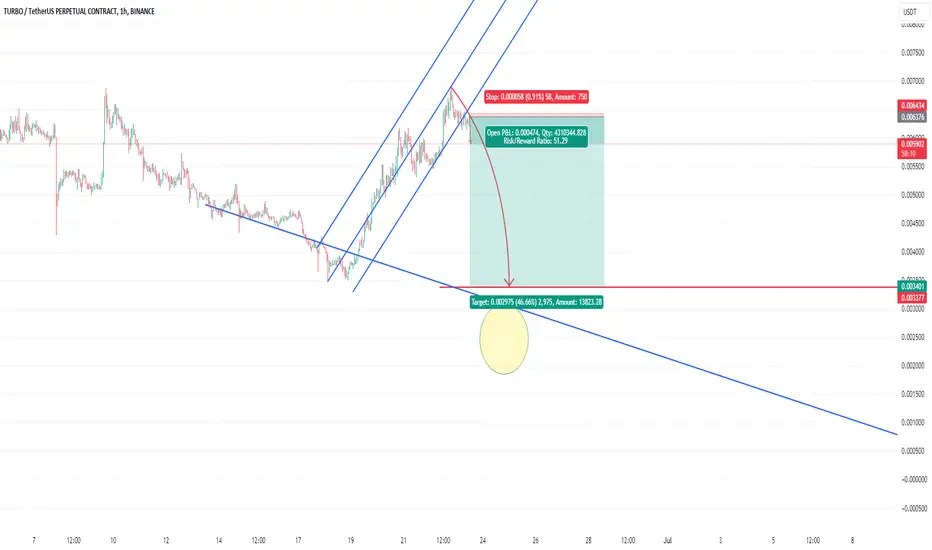
TURBOUSDT - Time for a Retracement (SHORT)Hey Turbo traders! Turbo experienced a rapid surge within a single day and now it's time to analyze the next potential moves. Let's dive into the latest price action and what to expect next.
Surge and Retest
Rapid Surge: Turbo surged dramatically within one day, showcasing impressive bullish momentum.
Retest of mOpen: After the surge, the price retested the mOpen, a key area of interest.
Formation of a Head and Shoulders Pattern
Head and Shoulders Pattern: It looks like Turbo is forming a Head and Shoulders pattern, a classic bearish reversal signal.
Right Shoulder Formation: Now, we need to cool down and form the right shoulder of this pattern.
Key Levels and Trading Strategy
1.) Short Trade Setup:
Entry Point: We placed a short trade at the monthly open (mOpen) as it presents a great risk-to-reward (R:R ratio)
Target Profit (TP): The TP for this short trade is the Fibonacci 0.382 level, around $0.0042. This level also coincides with a previous daily support level, making it a significant target.
2.) Support Area:
Fib 0.382 Level: This level is where we expect the price to retrace and find support.
3.) Monitoring Volume and Price Action:
Volume Trends: Monitor the volume closely. Decreasing volume during the retracement would support the formation of the right shoulder.
Price Action: Watch for bullish signals and price action patterns that indicate a potential long trade opportunity after closing the short.
Strategy: Executing the Short and Preparing for the Next Move
Executing the Short: Enter the short trade at the monthly open with a TP at the Fib 0.382 level around $0.0042.
Potential Long Trade: If we see bullish confirmation at the support area, it might be a good opportunity to open a new long trade. Keep an eye on the volume and price action for entry signals.
What are your thoughts on this analysis? Are you in on the short trade and preparing for a long entry? Share your insights below!

Alikze »» TURBO | 4H descending channel🔍 Technical analysis: Moving in the descending channel
- The daily frame time is moving in an upstream channel.
- But in the 4H frame time, there is a corrective form that is moving within a downtrend.
- This correction can first touch the range of 0.003052 if it is below the supply area and can extend this correction to the middle of the channel if continued.
💎 Alternative scenario: Also, if it can break the 0.0061 area, it could form an upward flag pattern that can continue the uptrend and continue its growth channel as much as the channel supply.
If the behavior and structure of the post will be updated, it will be updated.
»»»«««»»»«««»»»«««
Please support this idea with a LIKE and COMMENT if you find it useful and Click "Follow" on our profile if you'd like these trade ideas delivered straight to your email in the future.
Thanks for your continued support.
Best Regards,❤️
Alikze.
»»»«««»»»«««»»»«««

Turbo short chartThis is done using an experimental method based on Da Vinci. The price should dump while under the red line. Once it goes on top of it there is the potential that the down movement is invalidated.
#TURBO/USDT rejecting from the diagonal Trendline multiple times#TURBO/USDT rejecting from the diagonal Trendline multiple times in 1-Hour TF!
MYX:TURBO needs to break the Diagonal Trendline to turn bullish. #TURBOUSDT holding PMH $0.004085 as support. Wait for BO to long it.

TURBO LONG SETUP ALL trading ideas have entry point + stop loss + take profit + Risk level.
hello Traders, here is the full analysis for this pair, let me know in the comment section below if you have any questions, the entry will be taken only if all rules of the strategies will be satisfied. I suggest you keep this pair on your watchlist and see if the rules of your strategy are satisfied. Please also refer to the Important Risk Notice linked below.
Disclaimer

$TURBO inverse H&S potentially forming.as long as the current correction stabilizes around .0044ish it would be forming a inverse head and shoulders which has a very high probability of a move up well past all time highs. RSI and Stochastic are also supportive of this potential.

Turbo chart - where next?Hello, this is a chart for Turbo inspired by Da Vinci. At this moment in time the price is in the circle trying to decide the direction that it wants to take. The circles act as support and resistance. There are also diagonal trendlines but I did not included those in the chart as sometimes they tend to go way above or way under.
This is an interesting chart for observation to see if it works and how it works. This is not financial advice.

Short term $Turbo tradeTurbo is currently testing the lowside of the support level. My hypotesis is that the level will hold and we will see a 10% bump in 24 hours.

Turbo buy in opportunityTurbo recently experienced a strong upswing and established a new angle, getting rejected at the remaining Fibonacci level. A brief consolidation is expected in the short term towards the previous Fibonacci level. I see a good buying opportunity during the day for a test of the new uptrend line, which could propel Turbo to around 0.007 by Thursday.

Great buy in opportunity todayTurbo recently experienced a strong upswing and established a new angle, getting rejected at the remaining Fibonacci level. A brief consolidation is expected in the short term towards the previous Fibonacci level. I see a good buying opportunity during the day for a test of the new uptrend line, which could propel Turbo to around 0.007 by Thursday.

Turbo break outTurbo is closing above resistance levels and is about to hit an uptrend Fibonacci sequence. With BTC bouncing from a low of $58,400, this could be a great setup if BTC remains stable.
For those who are not familiar, Turbo is the new meme coin for this bull run. This AI coin has shown great potential and still has a low market cap of only $350 million. With a market cap of $4.2 billion, we can expect a price of $0.6 (11 times the current price).

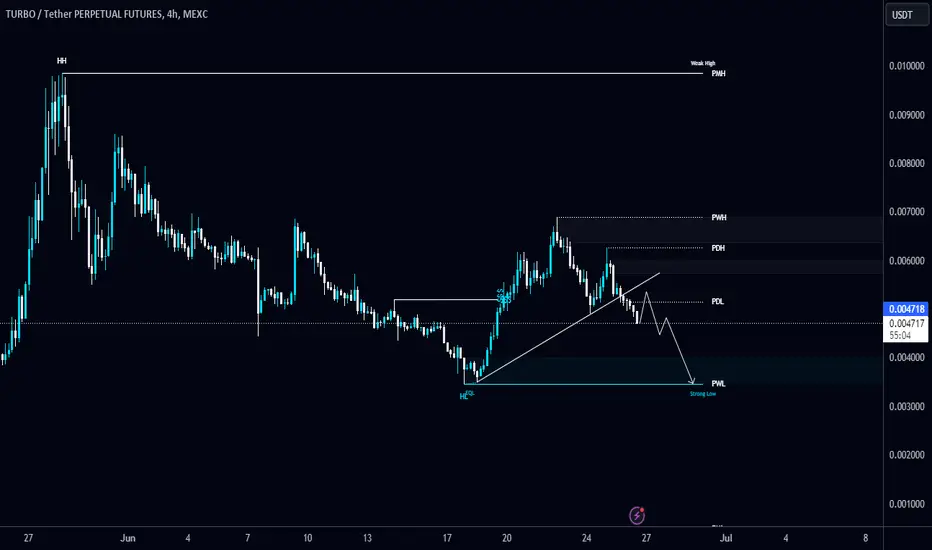
#TURBO/USDT looking heavy in 4-Hour TF!#TURBO/USDT looking heavy in 4-Hour TF!
MYX:TURBO breaks the diagonal Trendline too, and heading towards PWL $0.003475. Wait for a little retest to open a short position.
TURBOUSDT going another leg down?Hi there traders
We received a new signals from the EnF Breakout Strategy:
SHORT on TURBOUSDT
See idea for breakout entry, targets and stoploss
Only enter the trade when the price breaks below entry
Check out more on the script:
To get access to this script, DM me

NowAs a follow on from the previous posts. This is a zoom in to a 15 min chart with a little color to help as a visualization on the travel down to the black line symbolizing the (fractural) low.
Please remember that charts as in life do not always go as anticipated and the occasional loss is to be expected.
Be ready to change your strategy as needed. Which would suggest one would have more than one strategy available. (up opposite to down))

And the bigger picGoing from memory now as I made this for you.
The black Verticle lines are the lows. The blue verticle lines are the highs.
The orange are the trending low for sequence, with the red the previous. The purple is the previous high.
Um. I can't refer to the pic as I write this. I think I left the little black lines to show my 5 min chart analysis.
I put two lines to show how low I think it could go before entering the next ATH, marked in blue.
We should hit the lowest point of either yellow or orange (really, this is just a guess) around the last black mark before entering an upswing to ATH. Or at least a good upswing of magnitude.
Hope this helps.
Basically. Turbo is in a downtrend. Go with it.
Look for entry in the continuation of the downtrend (pullbacks, local highs), take your profits and go again.
Around the time of the black verticle line. Hodl.
When you see a serious break in structure (before or after the black verticle), the uptrend has begun.
Once this happens. Get in to the upside and hold on!

Futher analisys as askedThis is a shot of the previous high and subsequent low. With the orange as the two lows (notice the lower before the high)
The two black vertical lines gives us some idea how fast this system is moving. From high to low is around two months. From each high to the next is around 3 months (no guarantee this will continue)
I THINK we are somewhere in the green box.

Last chance to get in. Falling wedge breakout!!! Baby Pepe back tested it’s breakout of the wedge perfectly. For conservative traders wait see to see if we close above the 50 ema on the 12hr. Not FA
