TUSDT Forming Descending Channel TUSDT is currently trading within a clearly defined descending channel pattern, which is a classic bullish reversal signal when identified in the right market context. After a prolonged period of correction, the price is now consolidating within the lower boundary of the channel, signaling that a po
Related pairs

TUSDT 1W AnalysisTUSDT ~ 1W Analysis
#TUSDT This trade is very high risk. Buy if you still have confidence in this coin with a short term target of at least 20%++

#T/USDT#T
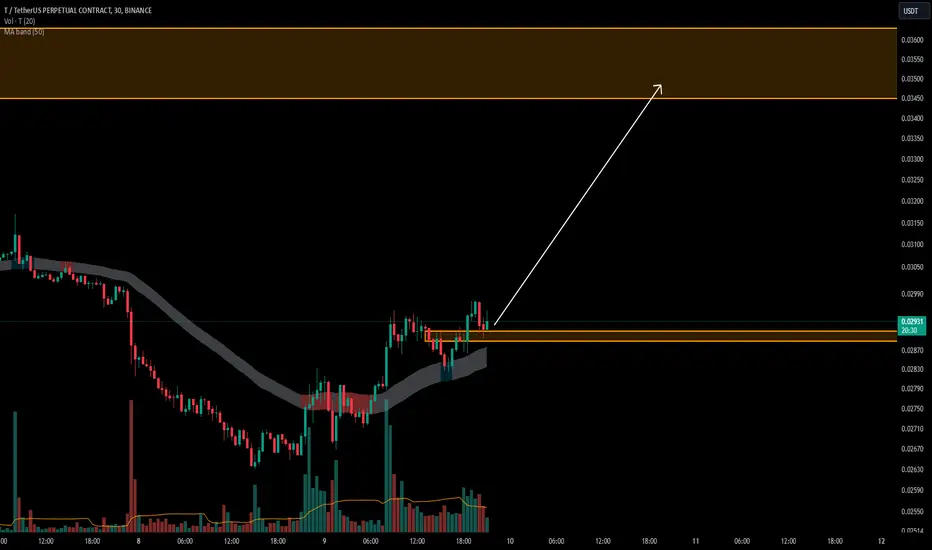
The price is moving within a descending channel on the 1-hour frame, adhering well to it, and is heading for a strong breakout and retest.
We are seeing a bounce from the lower boundary of the descending channel, which is support at 0.01704.
We have a downtrend on the RSI indicator that is abou

Threshold Network(T) Analysis: From Bear Trap to Bullish TrendAs long as Bitcoin ( BINANCE:BTCUSDT ) and Ethereum ( BINANCE:ETHUSDT ) are in a range, it is a good opportunity to take advantage of the movement of other tokens and take a look at their charts.
Today, I want to analyze the Threshold( BINANCE:TUSDT ) project for you, which has increased by

TUSDT 1WT ~ 1W Analysis
#T This trade is very high risk. Buy from here with a short -term target of at least 20%+. This is the lowest support for now.
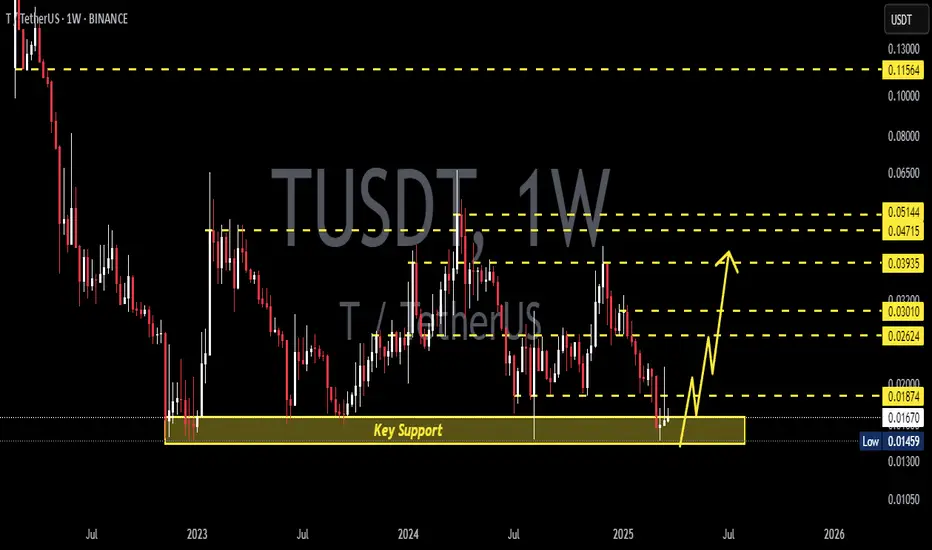
T USDT Simple AnalyisisBuying Condition-- If Weekly Candle closes above 0.015
Stoploss Condition-- If Weekly Candles closes below 0.015
Just Very Simple Myth
Targets are shown in the graph with Red lines TP-01 and TP-02

TUSDT 1D#T has broken the falling wedge pattern on the daily chart and is now facing the MA50. In case of a breakout above the MA50, the targets are:
🎯 $0.03401
🎯 $0.03684
🎯 $0.03967
🎯 $0.04370
🎯 $0.04884

T/USDTKey Level Zone : 0.02888 - 0.02910
HMT v4.1 detected. The setup looks promising, supported by a previous upward/downward trend with increasing volume and momentum, presenting an excellent reward-to-risk opportunity.
HMT (High Momentum Trending):
HMT is based on trend, momentum, volume, and market
#T (SPOT) entry (0.026- 0.032) T.(0.13600) SL(0.02579)BINANCE:TUSDT
entry range (0.026- 0.032)
Targets ( .034 - .045 - .048 - .059 - 0.065 - 0.095 - 0.1149 - 0.136 )
SL .4H close below (0.02579)
______________________________________________________________
Golden Advices.
********************
* collect the coin slowly in the entry range.

Is the threshold coin ready for intergalactic flight?Dear Traders,
I would like to bring your attention to a promising opportunity, the NYSE:T coin. As you may have observed, the triangle breakout occurred successfully last week, followed by a positive retest. Currently, we are witnessing a significant increase in daily trading volume and a favorab

See all ideas
Summarizing what the indicators are suggesting.
Oscillators
Neutral
SellBuy
Strong sellStrong buy
Strong sellSellNeutralBuyStrong buy
Oscillators
Neutral
SellBuy
Strong sellStrong buy
Strong sellSellNeutralBuyStrong buy
Summary
Neutral
SellBuy
Strong sellStrong buy
Strong sellSellNeutralBuyStrong buy
Summary
Neutral
SellBuy
Strong sellStrong buy
Strong sellSellNeutralBuyStrong buy
Summary
Neutral
SellBuy
Strong sellStrong buy
Strong sellSellNeutralBuyStrong buy
Moving Averages
Neutral
SellBuy
Strong sellStrong buy
Strong sellSellNeutralBuyStrong buy
Moving Averages
Neutral
SellBuy
Strong sellStrong buy
Strong sellSellNeutralBuyStrong buy
Displays a symbol's price movements over previous years to identify recurring trends.
Frequently Asked Questions
The current price of T / Tether USD (T) is 0.0179 USDT — it has risen 4.12% in the past 24 hours. Try placing this info into the context by checking out what coins are also gaining and losing at the moment and seeing T price chart.
T / Tether USD price has risen by 5.99% over the last week, its month performance shows a 12.74% increase, and as for the last year, T / Tether USD has decreased by −9.14%. See more dynamics on T price chart.
Keep track of coins' changes with our Crypto Coins Heatmap.
Keep track of coins' changes with our Crypto Coins Heatmap.
T / Tether USD (T) reached its highest price on Jan 31, 2023 — it amounted to 0.1800 USDT. Find more insights on the T price chart.
See the list of crypto gainers and choose what best fits your strategy.
See the list of crypto gainers and choose what best fits your strategy.
T / Tether USD (T) reached the lowest price of 0.0117 USDT on Apr 7, 2025. View more T / Tether USD dynamics on the price chart.
See the list of crypto losers to find unexpected opportunities.
See the list of crypto losers to find unexpected opportunities.
The safest choice when buying T is to go to a well-known crypto exchange. Some of the popular names are Binance, Coinbase, Kraken. But you'll have to find a reliable broker and create an account first. You can trade T right from TradingView charts — just choose a broker and connect to your account.
Crypto markets are famous for their volatility, so one should study all the available stats before adding crypto assets to their portfolio. Very often it's technical analysis that comes in handy. We prepared technical ratings for T / Tether USD (T): today its technical analysis shows the buy signal, and according to the 1 week rating T shows the neutral signal. And you'd better dig deeper and study 1 month rating too — it's sell. Find inspiration in T / Tether USD trading ideas and keep track of what's moving crypto markets with our crypto news feed.
T / Tether USD (T) is just as reliable as any other crypto asset — this corner of the world market is highly volatile. Today, for instance, T / Tether USD is estimated as 1.69% volatile. The only thing it means is that you must prepare and examine all available information before making a decision. And if you're not sure about T / Tether USD, you can find more inspiration in our curated watchlists.
You can discuss T / Tether USD (T) with other users in our public chats, Minds or in the comments to Ideas.