NETHERLANDS 25 ON ITS WAY DOWN?We have reached the top of the rising wedge which has acted as a reversal point numerous of times previously and I'm expecting a similar instance once again.
Daily, weekly and Monthly RSI are all overbought and are calling for a breather.
My minimal targer is 720 which is roughly a 6% reversal.
AEX trade ideas

AEX Index - Flash crash ahead? The AEX index seems overbought. The weekly RSI indicator is at the top, flashing red signs.
Buy range 540 - 615.


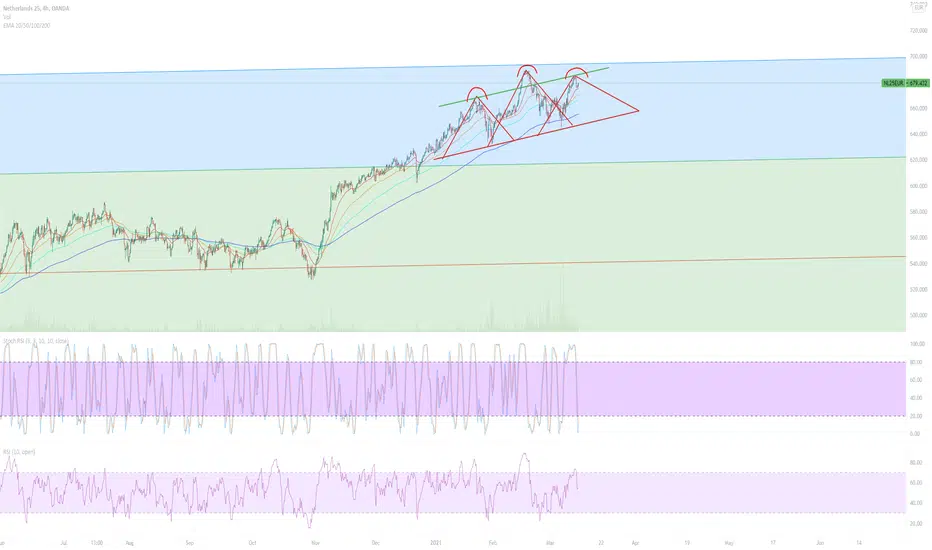
NL25EUR, at support level, GO Long One the price touches our red zone and do not brake 697,255 we going long as it will form head and shoulders. Good luck


Bullish day start NL25EURWe are already in a bullish divergence on the 5 min chart.
Today we reach at least 683,28 becouse we started the day with a gap.
Normally we go for the gapfill in the few first hours.

Bearish H&S Formation - Market crash ahead?A very neat H&S pattern is forming and would wait this out until it breaks before making any commitments.


AEX longWe came to the support zone and ready for a new wave to the upside as long he don't brake the support.

AEX25 (NL25EUR) Long OpportunityHello traders !
As you can see,we have another indice analysis. Today you can see AEX25 which is an indice from Netherlands. We have a lot of nice confirmations here.
Let‘s start !
Price is now moving down but this only correction. Where will it be done ? I recommend you to focus on actual support level.
Why ??
Because this level nicely fits with 0.618 fibonacci retracement and 200 SMA.
You can also see a "Kill Zone". This is zone,where I expect the second bottom of Double Bottom pattern. If price closes below this zone,then I am not any more interested because it won‘t be a valid Double Bottom. It can be wicked but price mustn‘t close below. This is very important !
Also fundamentals are good for us. If mutated COVID-19 doesn‘t attack NL,we will be fine 😀
If all of these criteria are met,we can simply enter a long position.
Thank you for reading !


AEX : 2021 --> buy the dips : target 700HI everyone,
I'd like to start the year with a look at the long-term chart and it's pretty impressive. Last year we dived below the MA50 in March and then came back above it in May thanks to the stimulus, which avoided a MA20 / MA50 cross as in 2008 and 2002, this is very special because this time it avoided a long-term crash scenario whereby the bull market has remained intact since 2009. Another important signal is the RSI !!! Note that the negative divergence has disappeared due to the recent breakthrough through the falling resistance line that may now serve as a support in the coming months. This is expected to continue the uptrend for 2021. A target of 700 must be possible, note that the top of the trend channel only really gives room for this by the end of the year! Corrections offer an opportunity to take or buy new positions, support is at the bottom around 573/550. MA20 and MA50 !! as long as these levels are not broken, it is not recommended to purchase shorts. Also, don't be tempted by the many doom stories that will always keep circulating, these are usually the ones that are left with great frustration for whatever reason! I wish you a successful positive year with a bit more tolerance and less fears !!
Good luck !
Regards,
TT

AEX fractal for Jan/FebHi all,
This is my expectation for the near future. A top within a few days would be logical. I am waiting for the signal in my trading system.
I will try to play some monthly/weekly AEX put options as always. :)
Shalom,
Im
Disclaimer: as always, think for yourself and search for the truth!

AEX: longer-term it won't end well part 2Hi Traders!
I was not planning on posting anything, but I did not want to keep this gem (I found it yesterday) for myself. :)
Guarantees? ZERO... ;)
Shalom,
Immanuel Koning
Disclaimer: as always, think for yourself and search the truth!

Abandoned baby on AEX day graphAbandoned Baby pattern (on day graph) indicate bearish move and certainly if today price moves below 8EMA (black T-line)


Upcoming Head & shoulder in 15mins AEX graph? Target=607.9Upcoming Head & shoulder in 15mins AEX graph? Target=607.9


AEX : new way up ---> target 615Unbelievable what an increase since October 30, the importance of not breaking through 530 was enormous, the bulls did an excellent job. With the breaking of zone 575 even the sideways trend has been done and there is again upward space. If you look closely, the zone 575 can also be seen as the neckline of an inverted SHS pattern. If you reverse the size of the head you get a target of 615! This is also the level of the gap that arose on 21/02/20. This can now start to work as a pulling magnet, this will be my focus in the coming weeks.
Today's gap can be a run-away gap, but also count on it that it can still be closed, a test of the neckline is plausible.
It is actually necessary to cool down to use the zone 575 as a springboard. If the springboard breaks, the consequences can be major, but we are not that far, a trend is a trend and the target of 613 is there!
Resistance: 603/613
Support: 583/580/575
As I always do, I regularly provide updates on this idea according to the hourly chart, follow it if you find it interesting!
Success Traders!
Greetings TT
