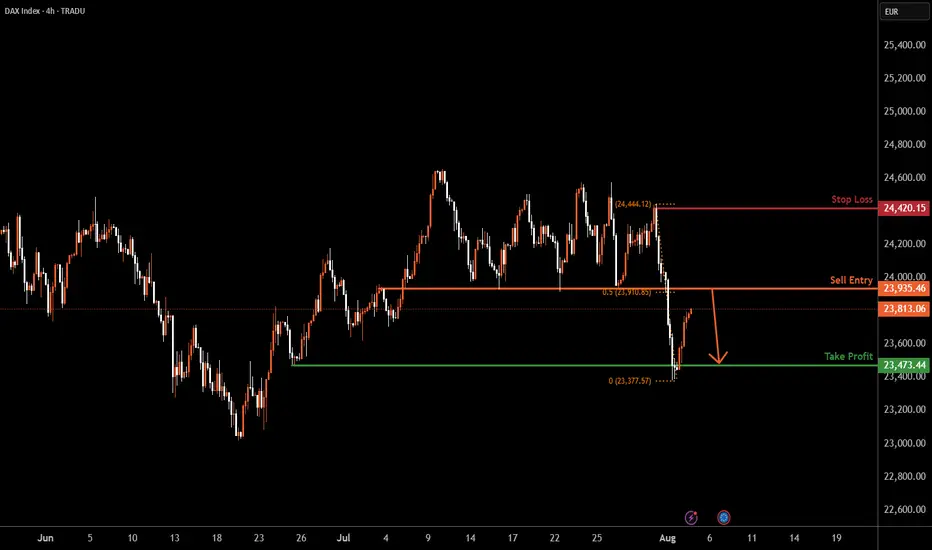
GER30 H4 | Bearish reversal off pullback resistanceBased on the H4 chart analysis, we can see that the price rises towards the sell entry, which acts as a pullback resistance that lines up with the 50% Fibonacci retracement and could potentially reverse to the downside from this level.
Sell entry is at 23,935.46, which is a pullback resistance that aligns with the 50% Fibonacci retracement.
Stop loss is at 24,420.15, which is a swing high resistance.
Take profit is at 23,473.44, which is a multi-swing low support.
High Risk Investment Warning
Trading Forex/CFDs on margin carries a high level of risk and may not be suitable for all investors. Leverage can work against you.
Stratos Markets Limited (tradu.com ):
CFDs are complex instruments and come with a high risk of losing money rapidly due to leverage. 65% of retail investor accounts lose money when trading CFDs with this provider. You should consider whether you understand how CFDs work and whether you can afford to take the high risk of losing your money.
Stratos Europe Ltd (tradu.com ):
CFDs are complex instruments and come with a high risk of losing money rapidly due to leverage. 66% of retail investor accounts lose money when trading CFDs with this provider. You should consider whether you understand how CFDs work and whether you can afford to take the high risk of losing your money.
Stratos Global LLC (tradu.com ):
Losses can exceed deposits.
Please be advised that the information presented on TradingView is provided to Tradu (‘Company’, ‘we’) by a third-party provider (‘TFA Global Pte Ltd’). Please be reminded that you are solely responsible for the trading decisions on your account. There is a very high degree of risk involved in trading. Any information and/or content is intended entirely for research, educational and informational purposes only and does not constitute investment or consultation advice or investment strategy. The information is not tailored to the investment needs of any specific person and therefore does not involve a consideration of any of the investment objectives, financial situation or needs of any viewer that may receive it. Kindly also note that past performance is not a reliable indicator of future results. Actual results may differ materially from those anticipated in forward-looking or past performance statements. We assume no liability as to the accuracy or completeness of any of the information and/or content provided herein and the Company cannot be held responsible for any omission, mistake nor for any loss or damage including without limitation to any loss of profit which may arise from reliance on any information supplied by TFA Global Pte Ltd.
The speaker(s) is neither an employee, agent nor representative of Tradu and is therefore acting independently. The opinions given are their own, constitute general market commentary, and do not constitute the opinion or advice of Tradu or any form of personal or investment advice. Tradu neither endorses nor guarantees offerings of third-party speakers, nor is Tradu responsible for the content, veracity or opinions of third-party speakers, presenters or participants.
DEU40 trade ideas
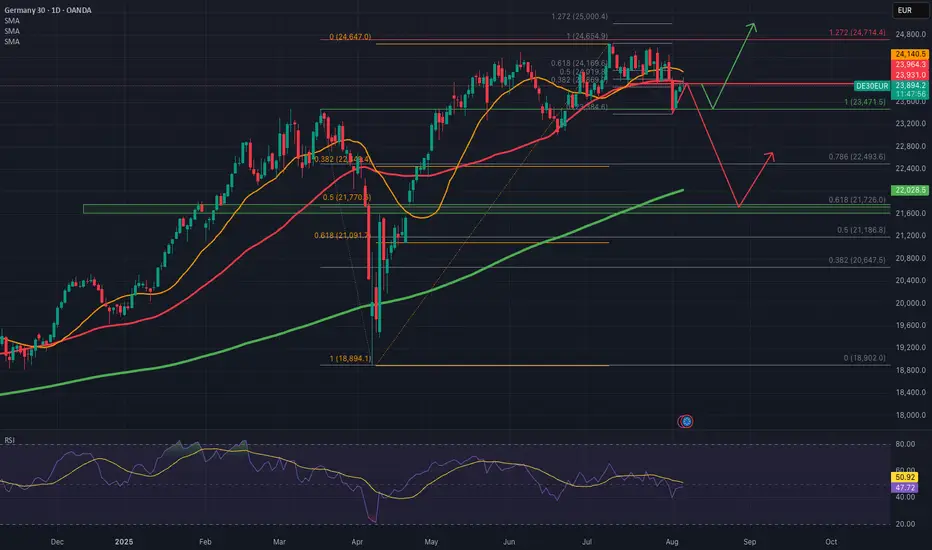
GER40 - the way forward uncertainMain German Index has always had an excellent reputation of ever-gainer.
Now however, German economy has been slowing down for years and the outlook is far from bright. At least in my view.
The price has reached the technical resistance at FR 127.2 and reacted to it. It has been consolidating in between FR 127.2 and FR 100 since June 5th, and on July 31st it broke the SMA 50 with a strong move down. Now the price is testing the SMA 50 from below. If it holds and price breaks down below FR 100, we may see a significant correction on this instrument.
Just my humble opinion.
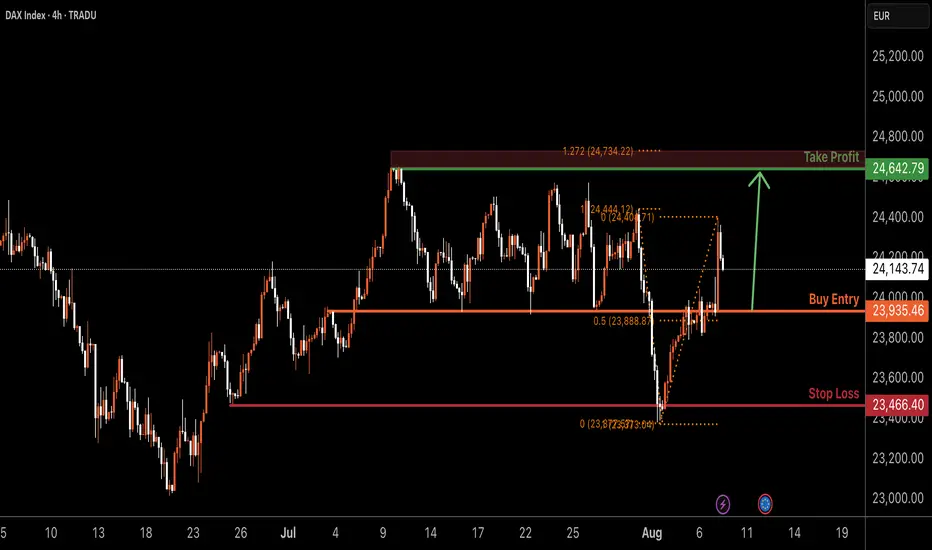
GER30 H4 | Bullish bounce off overlap supportGER30 is falling towards the buy entry at 23,935.46, which is an overlap support that lines up with the 50% Fibonacci retracement and could bounce from this level to the upside.
Stop loss is at 23,466.40, which is a multi-swing low support.
Take profit is at 24,642.79, which is a swing high resistance that is slightly below the 127.2% Fibonacci extension.
High Risk Investment Warning
Trading Forex/CFDs on margin carries a high level of risk and may not be suitable for all investors. Leverage can work against you.
Stratos Markets Limited (tradu.com ):
CFDs are complex instruments and come with a high risk of losing money rapidly due to leverage. 65% of retail investor accounts lose money when trading CFDs with this provider. You should consider whether you understand how CFDs work and whether you can afford to take the high risk of losing your money.
Stratos Europe Ltd (tradu.com ):
CFDs are complex instruments and come with a high risk of losing money rapidly due to leverage. 66% of retail investor accounts lose money when trading CFDs with this provider. You should consider whether you understand how CFDs work and whether you can afford to take the high risk of losing your money.
Stratos Global LLC (tradu.com ):
Losses can exceed deposits.
Please be advised that the information presented on TradingView is provided to Tradu (‘Company’, ‘we’) by a third-party provider (‘TFA Global Pte Ltd’). Please be reminded that you are solely responsible for the trading decisions on your account. There is a very high degree of risk involved in trading. Any information and/or content is intended entirely for research, educational and informational purposes only and does not constitute investment or consultation advice or investment strategy. The information is not tailored to the investment needs of any specific person and therefore does not involve a consideration of any of the investment objectives, financial situation or needs of any viewer that may receive it. Kindly also note that past performance is not a reliable indicator of future results. Actual results may differ materially from those anticipated in forward-looking or past performance statements. We assume no liability as to the accuracy or completeness of any of the information and/or content provided herein and the Company cannot be held responsible for any omission, mistake nor for any loss or damage including without limitation to any loss of profit which may arise from reliance on any information supplied by TFA Global Pte Ltd.
The speaker(s) is neither an employee, agent nor representative of Tradu and is therefore acting independently. The opinions given are their own, constitute general market commentary, and do not constitute the opinion or advice of Tradu or any form of personal or investment advice. Tradu neither endorses nor guarantees offerings of third-party speakers, nor is Tradu responsible for the content, veracity or opinions of third-party speakers, presenters or participants.

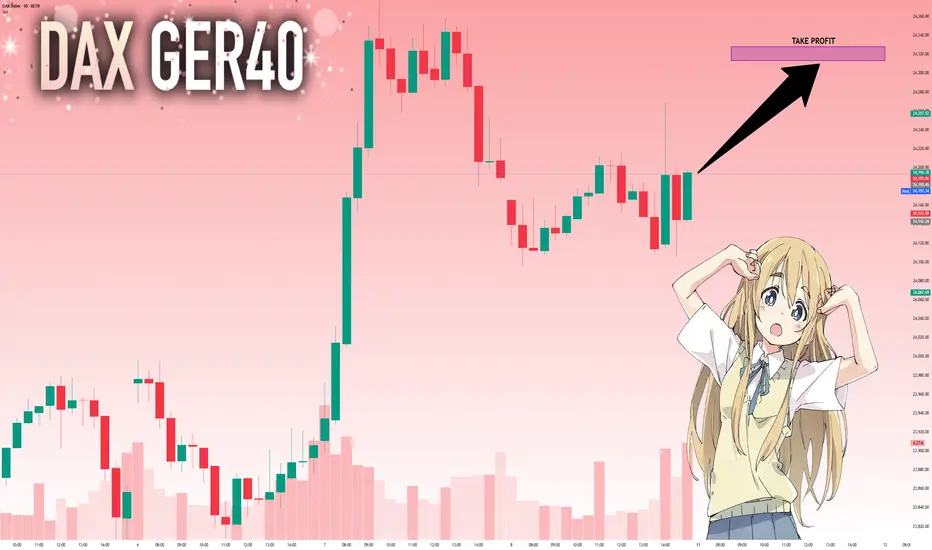
DAX: Next Move Is Up! Long!
My dear friends,
Today we will analyse DAX together☺️
The in-trend continuation seems likely as the current long-term trend appears to be strong, and price is holding above a key level of 24,194.78 So a bullish continuation seems plausible, targeting the next high. We should enter on confirmation, and place a stop-loss beyond the recent swing level.
❤️Sending you lots of Love and Hugs❤️
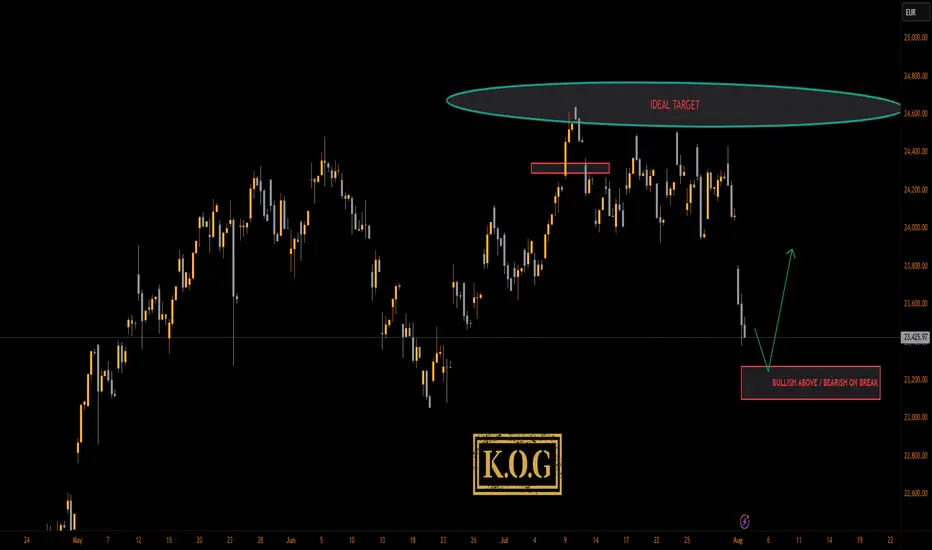
KOG - DAXWe hit the target nicely on this and then got the reversal trade we wanted which gave our traders and extra bonus.
Now, we have key level below and a RED BOX lining up, if attempted, we may just test that level for a long on the retracement.
As always, trade safe.
KOG
Rob the DAX! GER40 Bullish Mission Begins Now!🏴☠️GER40 Bullish Vault Heist! Target: 25400 🎯💼
🚨Mission Briefing: Robbery in Progress - DE40 / Germany40 Index Heist!
🎯 Plan: Bullish
🗂️ Asset: DE40 / GER40 “Germany40” Index
📦 Strategy: Thief’s signature Layered Limit Orders 🧱 (Multi-entry precision loading)
🔑 Entry Point:
"The vault is open 24/7! Thief goes in anytime 🔓💰"
Place multiple buy limit orders at recent swings / lows on the 15m-30m chart.
📲 Tip: Set alerts at breakout zones. Be early. Be greedy.
🚨 Stop Loss:
🎯 SL at 23,300 🔐 – beneath 4H structure (swing low wick-based).
Adjust SL based on lot size and number of active entries.
🏆 Escape Point (Target):
💼 25,400 = Target stash 💰
🔥 Use Trailing SL and ride the wave – exit before the trap if market hesitates!
📈 Scalpers / Swingers Alert:
💎 Only Long-side loot allowed!
💸 Small capital? Join the swing team 🚀
💰 Big capital? Front-run the breakout!
🎯 Trailing SL = Smart thieves protect profits.
🧠 Why Bullish?
The index is warming up after consolidation. Neutral bias flipping bullish 🔄 due to:
📰 Weakening macro shock absorbers
💣 Risk appetite reviving
💡 Institutional positioning + COT shift
🔄 USD reaction + EU equity flow
💼 Check all macro + intermarket juice for full confidence 📊🔗
⚠️ Risk Management Tips for Robbers:
🕰 Avoid news hour trades
🔄 Use Trailing SL always
📉 Don't chase… let the market come to you
👀 Eyes on economic calendar and VIX movement
❤️ Support the Robbery Crew!
💥 Hit that BOOST button if you love making money the Thief Way 🏴☠️
🎯 Help us grow the robbery empire & take over the charts 📈💰
🧨 Another Heist Plan coming soon! Stay sneaky, stay funded 🤑🐱👤💼
#ThiefTrader #GER40Plan #IndexHeist #LayeredLoot #MarketRobbery #FTSEStyleRobbery

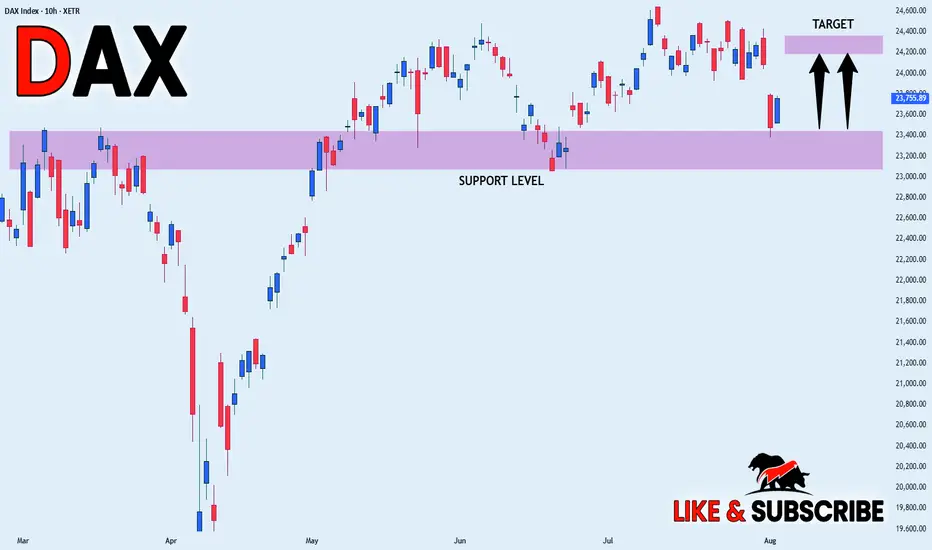
DAX WILL GROW|LONG|
✅DAX is trading in an
Uptrend and the index made
A bullish rebound from the
Horizontal support of 23,400
Which reinforces our bullish
Bias and we will be expecting
A further bullish move up
LONG🚀
✅Like and subscribe to never miss a new idea!✅
GER40 Will dumpFUSIONMARKETS:GER40 Is rushing to retest a very strong resistance. So as it is now, i expected GER40 to dump heavily from the indicated sell zone. Sell GER40

DAX Potential Short! Sell!
Hello,Traders!
DAX went up nicely
But is now about to hit
A horizontal resistance
Around 24,000 so after
The retest we will be
Expecting a local pullback
Sell!
Comment and subscribe to help us grow!
Check out other forecasts below too!
Disclosure: I am part of Trade Nation's Influencer program and receive a monthly fee for using their TradingView charts in my analysis.
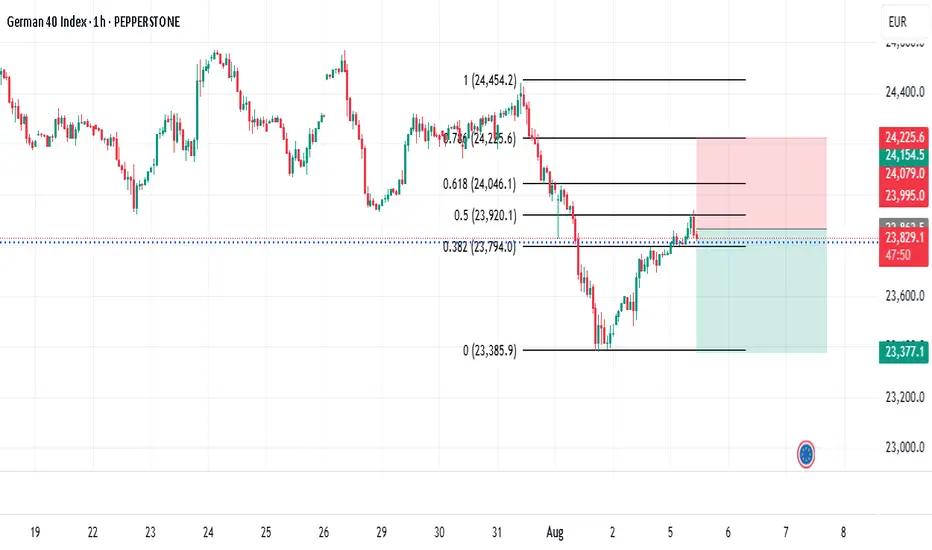
Heading into 61.8% Fibonacci resistance?GER40 is rising towards the resistance level which is a pullback resistance that aligns with the 61.8% Fibonacci retracement and could reverse from this level to our take profit.
Entry: 24,006.71
Why we like it:
There is a pullback resistance level that lines up with the 61.8% Fibonacci retracement.
Stop loss: 24,405.92
Why we like it:
There is a swing high resistance.
Take profit: 23,498.13
Why we like it:
There is a multi swing low support.
Enjoying your TradingView experience? Review us!
Please be advised that the information presented on TradingView is provided to Vantage (‘Vantage Global Limited’, ‘we’) by a third-party provider (‘Everest Fortune Group’). Please be reminded that you are solely responsible for the trading decisions on your account. There is a very high degree of risk involved in trading. Any information and/or content is intended entirely for research, educational and informational purposes only and does not constitute investment or consultation advice or investment strategy. The information is not tailored to the investment needs of any specific person and therefore does not involve a consideration of any of the investment objectives, financial situation or needs of any viewer that may receive it. Kindly also note that past performance is not a reliable indicator of future results. Actual results may differ materially from those anticipated in forward-looking or past performance statements. We assume no liability as to the accuracy or completeness of any of the information and/or content provided herein and the Company cannot be held responsible for any omission, mistake nor for any loss or damage including without limitation to any loss of profit which may arise from reliance on any information supplied by Everest Fortune Group.

DAX40 Pivotal trading zone at 23900The DAX remains in a neutral trend, with recent price action showing signs of a corrective pullback within the broader uptrend.
Support Zone: 23375 – a key level from previous consolidation. Price is currently testing or approaching this level.
A bullish rebound from 23375 would confirm ongoing upside momentum, with potential targets at:
23900 – initial resistance
24215 – psychological and structural level
24430 and 24620 – extended resistance on the longer-term chart
Bearish Scenario:
A confirmed break and daily close below 23375 would weaken the bullish outlook and suggest deeper downside risk toward:
23195 – minor support
23035 – stronger support and potential demand zone
Outlook:
Neutral bias remains intact while the Dax trades around pivotal 23900 level. A sustained break below or above this level could shift momentum.
This communication is for informational purposes only and should not be viewed as any form of recommendation as to a particular course of action or as investment advice. It is not intended as an offer or solicitation for the purchase or sale of any financial instrument or as an official confirmation of any transaction. Opinions, estimates and assumptions expressed herein are made as of the date of this communication and are subject to change without notice. This communication has been prepared based upon information, including market prices, data and other information, believed to be reliable; however, Trade Nation does not warrant its completeness or accuracy. All market prices and market data contained in or attached to this communication are indicative and subject to change without notice.


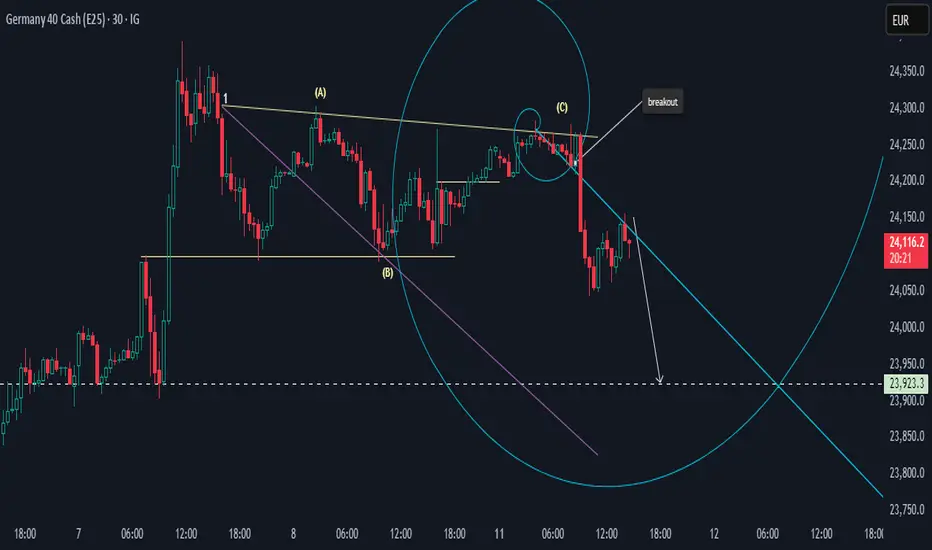
About Dax 40 CFDTime is approaching for a correction. We have clear price action support levels. According to Larry Williams' principle, I believe that the end of the correction will be around the end of September.

DAX Resilience To Shine ThroughThe DAX Index continues to hold strength just beneath all-time highs, popping higher above 24,000 after three consecutive sessions of gains.
Bulls are keeping control through strong earnings in tech and auto sectors, combined with supportive macro tailwinds. However, the major resistance and previous ATH remain to be tested.
U.S. Interest Rate Path in Focus
The Federal Reserve held rates steady at its July meeting but left the door open for a possible cut in September, should inflation and labor market data soften.
Markets are pricing in an increasing probability of a cut, which is fueling optimism across global equities.
A dovish Fed supports global risk sentiment and weakens the USD, indirectly benefiting European exporters.
ECB Holds, But Dovish Undertone Grows
The European Central Bank left rates unchanged in its latest decision, but ECB President Christine Lagarde acknowledged that “disinflation is progressing” and that further tightening is unlikely.
Forward guidance was interpreted as dovish, with the market now expecting a cut by December, possibly sooner if economic activity remains sluggish.
A dovish ECB lowers borrowing costs and improves equity risk premiums, especially for cyclical-heavy indices like the DAX.
EU–U.S. Trade Tensions
Recent rhetoric from U.S. officials, including renewed tariff threats on European pharmaceutical and automotive exports, has reignited trade tensions.
The EU has signaled its willingness to respond proportionally, but negotiations are ongoing.
While no measures have been enacted yet, uncertainty over trade policy is capping some upside momentum in European equities.
German automakers and industrial exporters are vulnerable to tariffs. Continued trade uncertainty may limit gains unless diplomacy resolves key friction points.
The DAX remains resilient, buoyed by improving fundamentals, strong earnings, and global rate expectations.
The index is coiled just under a key psychological resistance at 24,000, with bulls eyeing a breakout toward the all-time high near 24,639.
Momentum remains favorable, but traders should watch macro headlines and volume closely around resistance zones.


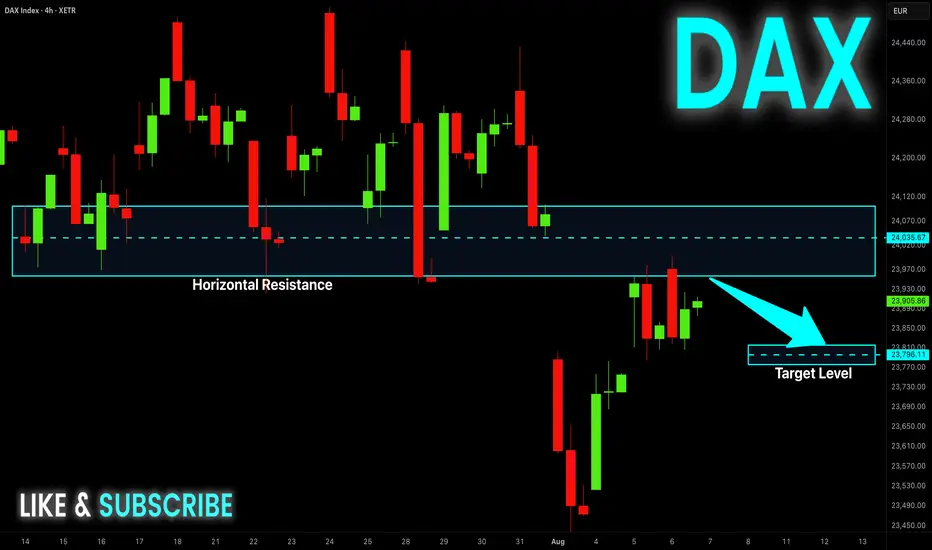
DAX At Resistance Aiming for Lower Lows.Hi there,
The DAX looks bearish at the M30, aiming for the 23923.3 support area. It looks like it needs to be watched because the price could spike higher.
Happy trading, wishing you a lovely week.
Khiwe.
Not trading advice
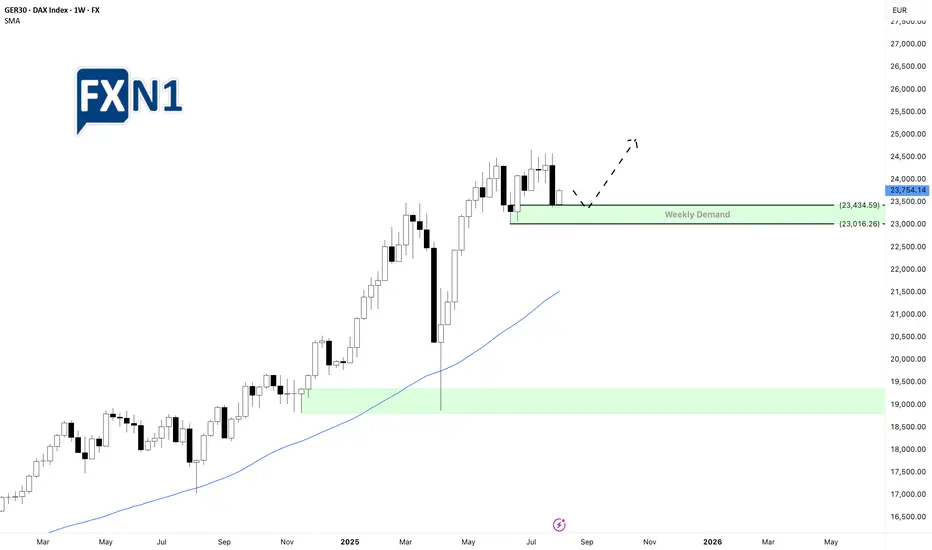
DAX Futures Rebound Amid Shifting US Economic SentimentThe DAX futures are showing a more optimistic tone today, shifting from concerns over weak US labor market data—which initially signaled economic trouble—to a more hopeful outlook that this might prompt the Federal Reserve to consider cutting interest rates, a move that investors see as positive. This shift in sentiment has provided some reassurance as the new week begins.
Following a brief decline on Friday, the market experienced a rebound today, supported by a weekly demand zone. We’re now watching for a retest of key levels within this zone, which could serve as a potential entry point for long positions, aiming for a continuation of the upward momentum driven by the weekly support area.
✅ Please share your thoughts about GER30 in the comments section below and HIT LIKE if you appreciate my analysis. Don't forget to FOLLOW ME; you will help us a lot with this small contribution.
Potential GER40 (DAX) Short SetupHey everyone,
Just wanted to share my personal analysis and the trade plan I've put together for the GER40 on the 1-hour chart. I'm still learning, so a big part of my process is documenting my ideas to see how they play out. I would be grateful for any thoughts or feedback you might have.
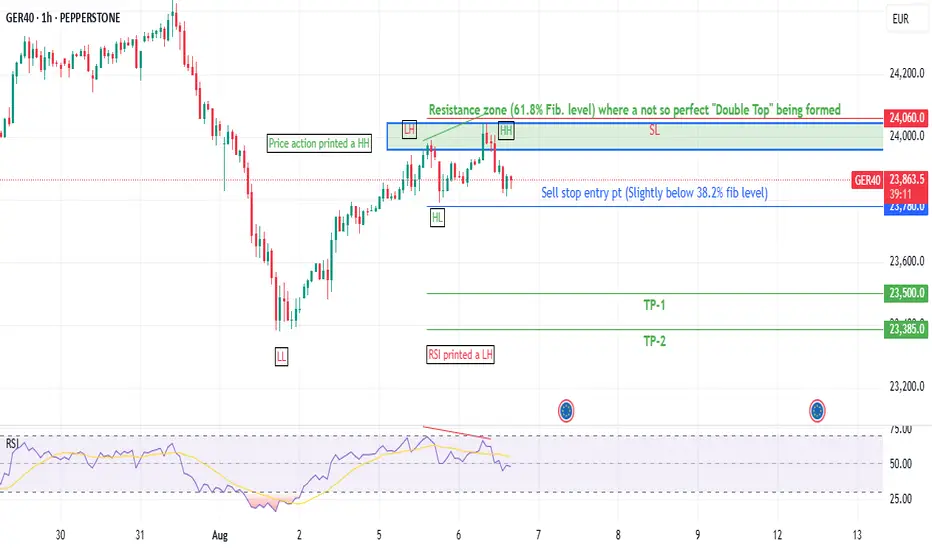
What I'm Seeing on the Chart:
A Potential Double Top: I've spotted what appears to be a double top pattern forming up near the €24,000 - €24,060 area. To me, it looks like the recent rally might be showing signs of exhaustion here.
Bearish Divergence: What makes this setup more interesting to me is the bearish divergence on the RSI. Even though the price pushed to a slightly higher high, the RSI indicator made a lower high. My understanding is that this can suggest fading buying momentum.
Fibonacci Level: I also noticed that this rejection seems to be happening right around the key 61.8% Fibonacci retracement level from the last major down-move. When a few different signs seem to line up like this, I tend to pay closer attention.
My Personal Trade Plan:
My game plan is to be patient and only consider an entry if the price breaks below the recent lows, which would help confirm the bearish idea for me.
Entry (Sell Stop): $23,780
Stop Loss: $24,060 (I'll place this above the recent high, as a move above here would suggest my bearish idea is likely wrong).
Take Profit 1: $23,500
Take Profit 2: $23,385
Important: Please remember, I'm a humble trader from Pakistan still on my learning journey. This is simply me sharing my trade journal and thoughts, and it is not financial advice. Please always do your own analysis. Stay safe out there!
#GER40 #DAX #TechnicalAnalysis #Short #TradingJournal #LearningToTrade #Tradingidea #Sarmaaya