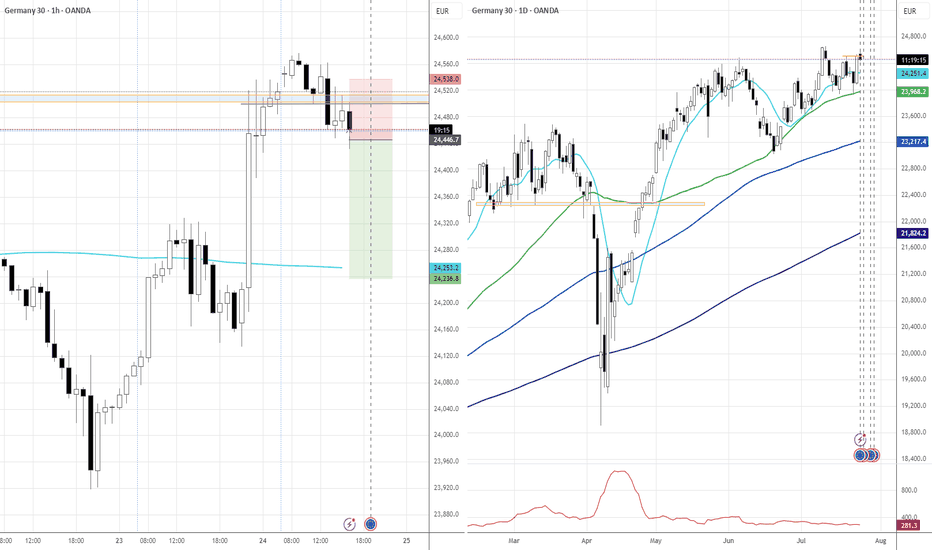
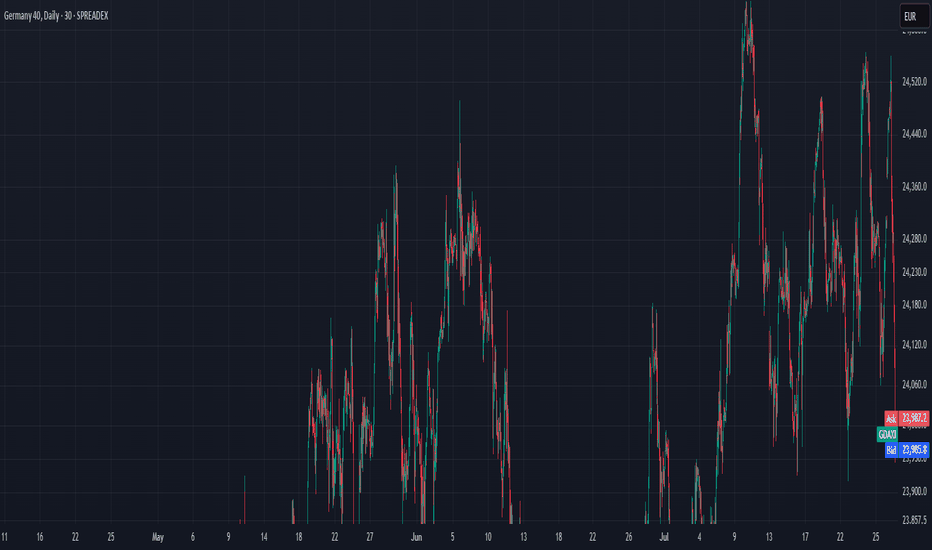
DEU40 trade ideas
#DAX - AUG Quarterly Levels : 3000 Pts SwingDate: 09-08-2025
#DAX - We are here for the interesting moments of the historical period where the trade tariff wars are at it's peak. The markets are not moving based on any fundamentals rather it's on the fear and sentiments factor. At this point, 3000 points swing will not be surprising!
The pivot levels posted in the previous chart remain intact and new these levels add as an extra support and resistance levels along with the new big targets.
#DAX Current Price: 24162.86
#DAX Pivot Point: 23907 Support: 23264 Resistance: 24556
#DAX Upside Targets:
🎯Target 1: 25284
🎯Target 2: 26012
🎯Target 3: 26801
🎯Target 4: 27591
#DAX Downside Targets:
🎯Target 1: 22533
🎯Target 2: 21802
🎯Target 3: 21013
🎯Target 4: 20224
#TradingView #Nifty #BankNifty #DJI #NDQ #SENSEX #DAX #USOIL #GOLD #SILVER
#BHEL #HUDCO #LT #LTF #ABB #DIXON #SIEMENS #BALKRISIND #MRF #DIVISLAB
#MARUTI #HAL #SHREECEM #JSWSTEEL #MPHASIS #NATIONALUM #BALRAMCHIN #TRIVENI
#USDINR #EURUSD #USDJPY #NIFTY_MID_SELECT #CNXFINANCE
#SOLANA #ETHEREUM #BTCUSD #MATICUSDT #XRPUSDT
#Crypto #Bitcoin #BTC #CryptoTA #TradingView #PivotPoints #SupportResistance
SELL GER30 FOR WIFE BIRTHDAYI am already in the sell, will be entering more entries on neckline of triangle. I need to take my wife out tomorrow and I am betting on this tade. I will close the trade at 22:45 exactly before market closes.
Analysis:
1. Daily bearish
2. 4 hr brearish
3. Entered the early position on 1 min timeframe
DAX WILL GO UP|LONG|
✅DAX is going up now
And the index made a
Breakout of the key horizontal
Level of 24,100 which is
Now a support then
Made a retest and a is now
Making a rebound already so
We are bullish biased and we
Will be expecting a further
Bullish move up
LONG🚀
✅Like and subscribe to never miss a new idea!✅
DAX oversold rally resistance at 24540The DAX remains in a bullish trend, with recent price action showing signs of a oversold really within the broader uptrend.
Support Zone: 23790 – a key level from previous consolidation. Price is currently testing or approaching this level.
A bullish rebound from 23790 would confirm ongoing upside momentum, with potential targets at:
24540 – initial resistance
24670 – psychological and structural level
24980 – extended resistance on the longer-term chart
Bearish Scenario:
A confirmed break and daily close below 23790 would weaken the bullish outlook and suggest deeper downside risk toward:
23610 – minor support
23400 – stronger support and potential demand zone
Outlook:
Bullish bias remains intact while the FTSE holds above 23790. A sustained break below this level could shift momentum to the downside in the short term.
This communication is for informational purposes only and should not be viewed as any form of recommendation as to a particular course of action or as investment advice. It is not intended as an offer or solicitation for the purchase or sale of any financial instrument or as an official confirmation of any transaction. Opinions, estimates and assumptions expressed herein are made as of the date of this communication and are subject to change without notice. This communication has been prepared based upon information, including market prices, data and other information, believed to be reliable; however, Trade Nation does not warrant its completeness or accuracy. All market prices and market data contained in or attached to this communication are indicative and subject to change without notice.
GER40CASH (DE40) - potential short - HSThere is a potential head and shoulders continuation pattern.
What I like about this setup is the GER40 is potentially creating a bear flag.
Finding a continuation pattern within the bear flag, like the head and shoulders, is a great entry point for the second part of the downward move.
Still waiting for my system to confirm some variables before I take the trade.
Risk/reward = 4.3
Entry price = 23 905.3
Stop loss price = 23 955.4
Take profit level 1 (50%) = 23 733
Take profit level 2 (50%) = 23 628
GER40 (DE40) SHORT - Double top 15minPotential short on GER40 with a double top on the 15min.
There is negative rsi divergence which is one of the indicators I use to look for double tops.
Still waiting on further confirmation before I take the trade.
Risk/reward = 3.2
Entry price = 23 905
Stop loss price = 23 965
Take profit level 1 (50%) = 23745
Take profit level 2 (50%) = 23684
What do you guys and girls think the GER40 is going to do from here?
Technical Analysis WeeklyGermany 40 is now in a range-bound environment, currently trading at 23,630, below its VWAP of 24,150 and close to StdDev #2 Lower. RSI at 43 reflects weakening momentum. Support lies at 23,630 and resistance is seen at 24,740
UK 100 continues its bullish trend, undergoing a small pullback. Price is at 9,102, just above its VWAP at 9059. RSI at 61 indicates steady bullish interest. Support is at 8,906 and resistance is at 9,212
Wall Street remains bullish but is now in a corrective phase. Price has dropped to 43,786, below its VWAP of 44,407. The RSI of 43 highlights growing downside pressure. Support is at 43,580, and resistance is at 45,253.
Brent Crude continues in a choppy range, albeit with lower volatility, trading at 6,932, right at its VWAP. The RSI at 50 confirms the lack of directional bias. Support sits at 6,631 and resistance at 7,198.
Gold continues to consolidate in a broad triangle pattern - keeping it in a neutral range, with price at 3,357, nearly equal to its VWAP. The RSI at 53 shows a balanced outlook. Support is at 3,280 and resistance at 3,416.
EUR/USD holds a bullish trend but is correcting. The pair trades at 1.1565, slightly below the VWAP of 1.1635. RSI at 45 reflects subdued buying pressure. Support is at 1.1435 and resistance at 1.1834.
GBP/USD has potentially entered a new bearish trend in a quick reversal from the prior uptrend. It trades at 1.3275, below the VWAP of 1.3404. The RSI of 36 signals fresh bearish momentum. Support is at 1.3204 and resistance at 1.3604.
USD/JPY remains neutral and in a range phase but is possibly building a new uptrend with its recent drop back from range resistance. Price is 147.95, aligned with the VWAP. RSI at 53 suggests a balanced tone. Support is near 145.95 and resistance stands at 149.88.
DAX: Next Move Is Up! Long!
My dear friends,
Today we will analyse DAX together☺️
The in-trend continuation seems likely as the current long-term trend appears to be strong, and price is holding above a key level of 23,502.95 So a bullish continuation seems plausible, targeting the next high. We should enter on confirmation, and place a stop-loss beyond the recent swing level.
❤️Sending you lots of Love and Hugs❤️
DAX - potential buyPotential buy on the German index as we are coming out of the 30min correction that followed a first small impulse to the upside. Conservative target is a move equivalent to the first 30 min setup. Optimal target are the break of the top and even better the 24.85 area. Levels on the chart. Trade with care.
DAX: Local Bearish Bias! Short!
My dear friends,
Today we will analyse DAX together☺️
The in-trend continuation seems likely as the current long-term trend appears to be strong, and price is holding below a key level of 24,252.78 So a bearish continuation seems plausible, targeting the next low. We should enter on confirmation, and place a stop-loss beyond the recent swing level.
❤️Sending you lots of Love and Hugs❤️
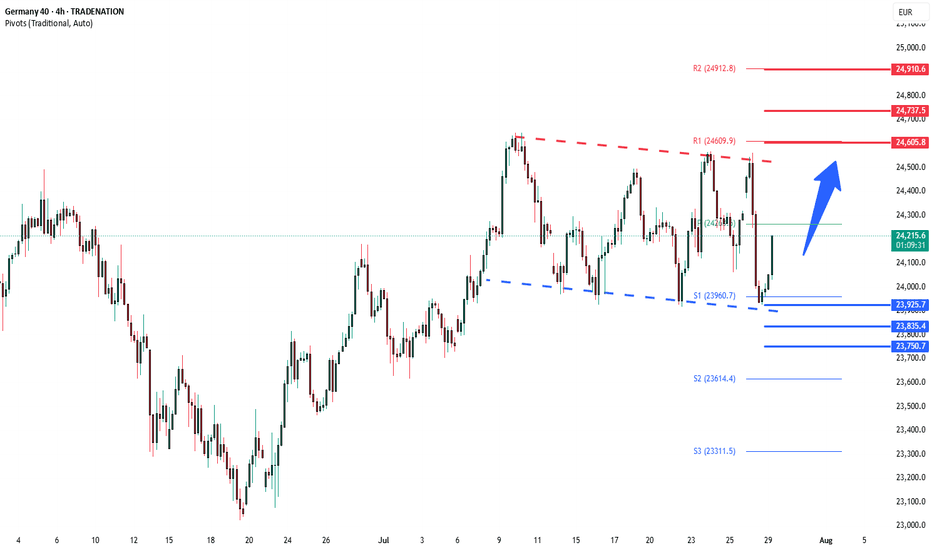
DAX oversold rally support at 23925The DAX remains in a bullish trend, with recent price action showing signs of a corrective pullback within the broader uptrend.
Support Zone: 23925 – a key level from previous consolidation. Price is currently testing or approaching this level.
A bullish rebound from 23925 would confirm ongoing upside momentum, with potential targets at:
24605 – initial resistance
24740 – psychological and structural level
24910 – extended resistance on the longer-term chart
Bearish Scenario:
A confirmed break and daily close below 23925 would weaken the bullish outlook and suggest deeper downside risk toward:
23835 – minor support
23750 – stronger support and potential demand zone
Outlook:
Bullish bias remains intact while the DAX holds above 23925. A sustained break below this level could shift momentum to the downside in the short term.
This communication is for informational purposes only and should not be viewed as any form of recommendation as to a particular course of action or as investment advice. It is not intended as an offer or solicitation for the purchase or sale of any financial instrument or as an official confirmation of any transaction. Opinions, estimates and assumptions expressed herein are made as of the date of this communication and are subject to change without notice. This communication has been prepared based upon information, including market prices, data and other information, believed to be reliable; however, Trade Nation does not warrant its completeness or accuracy. All market prices and market data contained in or attached to this communication are indicative and subject to change without notice.
DAX / GER - ANOTHER ROUND OF ENTRY LONGTeam, we have successfully short DAX.GER earlier today with more than 300 points. both target hit
However the market has exceeding the dropping. We decide to go LONG
at the price range 23964-23945
With STOP LOSS at 23865-82
Once the trade hit above 21030-45 - BRING STOP LOSS TO BE
Target 1 at 21080-24115 = please take 50-70% volume target
30% Target remaining at 24165-24196
Technical Analysis WeeklyGermany 40 remains in a bullish trend and is currently in a pullback phase. It trades at 24,308, almost identical to its VWAP of 24,307.5. The RSI at 54 suggests a pause in momentum. Support is found at 23,786 and resistance at 24,650.
UK 100 is in an impulsive bullish phase, breaking above previous highs with price at 9,145 well above the VWAP at 8,970. The RSI is at 73, indicating strong buying pressure. Support is at 8,748 and resistance is at 9,101.
Wall Street continues its bullish trend, pausing near recent highs. The price is at 44,880, above its VWAP of 44,445. RSI at 63 confirms steady bullish momentum. Support sits at 43,921 and resistance at 44,880.
Brent Crude remains in a broad neutral trend with short-term range-bound action. Price is at 6,768, just under VWAP of 6,866. RSI at 45 reflects a lack of directional conviction. Support is at 6,717 and resistance at 7,015.
Gold continues to trade sideways within a broad range. It trades at 3,337, nearly equal to its VWAP. The RSI at 47 suggests balance. Support is found at 3,290 and resistance at 3,407.
EUR/USD holds a bullish trend while undergoing a correction. It trades at 1.1740, close to its VWAP at 1.1699. The RSI at 59 shows mild positive momentum. Support is at 1.1585 and resistance at 1.1814.
GBP/USD is in a bullish trend but under corrective pressure and seemingly turning rangebound. The price is 1.3433, slightly below the VWAP of 1.3511. RSI is at 42, hinting at waning momentum. Support is 1.3336, resistance at 1.3687.
USD/JPY continues in a neutral trend but could be about to break higher, currently ranging around 147.66 and VWAP at 147.00. RSI at 57 shows a modest bullish bias after having pulled back from overbought territory. Support is at 144.54 and resistance at 149.46.


