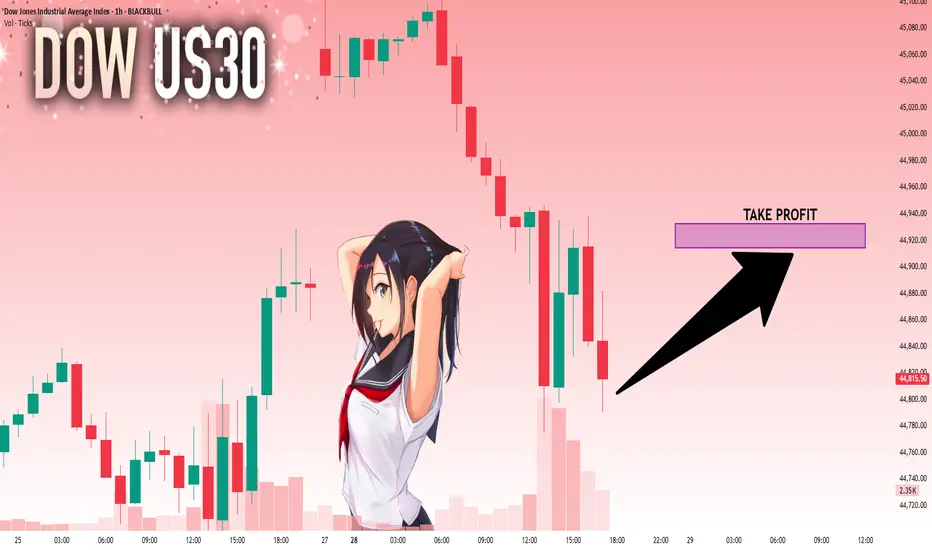
KOG - US30Moving on from the previous chart we shared on DOW you can see our red box worked well and gave us the move we wanted upside, however, we stopped just short of the ideal target level.
For that reason, and after looking at the liquidity indicator we will monitor the boxes here for a possible retracement.
As always, trade safe.
KOG
DJI trade ideas

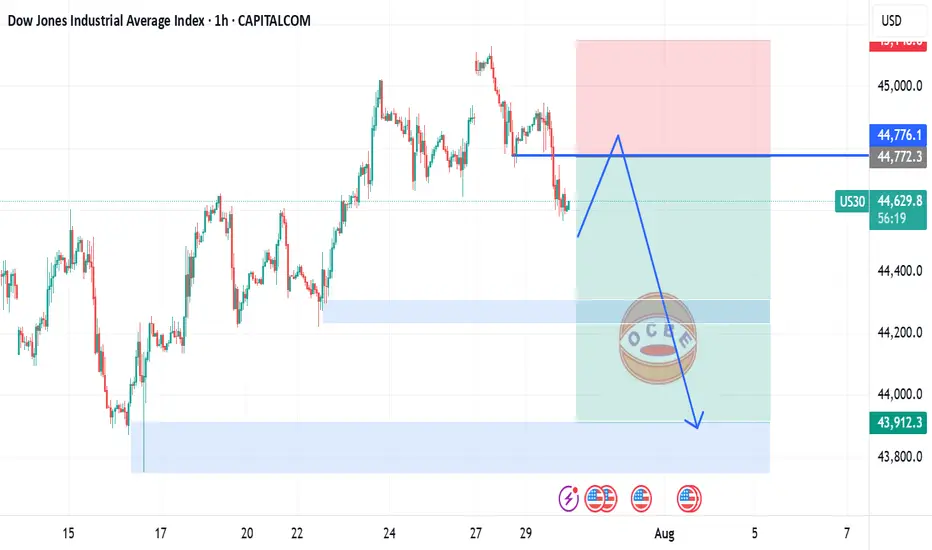
US30 Bearish Breakout!
HI,Traders !
#US30 made a bearish
Breakout of the key horizontal
Level of 44822.3which also
Seems to have been a neckline
Of the small H&S pattern so
We are locally bearish biased
And we will be expecting a
Further bearish move down !
Comment and subscribe to help us grow !

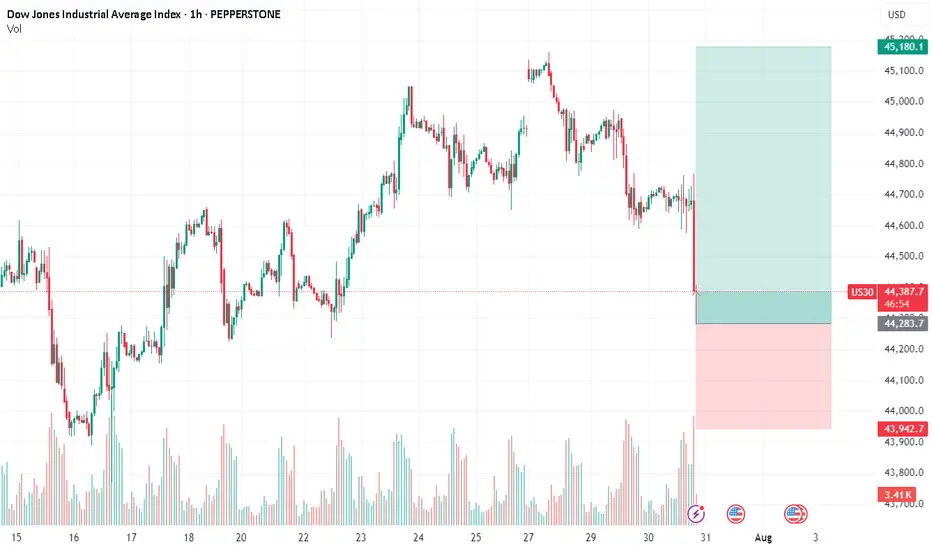
Bullish bounce off overlap support?Dow Jones (US30) is falling towards the pivot and could bounce to the 1st resistance which acts as a swing high resistance.
Pivot: 44,596.08
1st Support: 44,267.57
1st Resistance: 45,106.42
Risk Warning:
Trading Forex and CFDs carries a high level of risk to your capital and you should only trade with money you can afford to lose. Trading Forex and CFDs may not be suitable for all investors, so please ensure that you fully understand the risks involved and seek independent advice if necessary.
Disclaimer:
The above opinions given constitute general market commentary, and do not constitute the opinion or advice of IC Markets or any form of personal or investment advice.
Any opinions, news, research, analyses, prices, other information, or links to third-party sites contained on this website are provided on an "as-is" basis, are intended only to be informative, is not an advice nor a recommendation, nor research, or a record of our trading prices, or an offer of, or solicitation for a transaction in any financial instrument and thus should not be treated as such. The information provided does not involve any specific investment objectives, financial situation and needs of any specific person who may receive it. Please be aware, that past performance is not a reliable indicator of future performance and/or results. Past Performance or Forward-looking scenarios based upon the reasonable beliefs of the third-party provider are not a guarantee of future performance. Actual results may differ materially from those anticipated in forward-looking or past performance statements. IC Markets makes no representation or warranty and assumes no liability as to the accuracy or completeness of the information provided, nor any loss arising from any investment based on a recommendation, forecast or any information supplied by any third-party.

Us30usd sellI entered a sell trade from the LS zone. The PEZ zones were all used up. I set the last one as my TP.

Dow Jones Potential DownsidesHey Traders, in today's trading session we are monitoring US30 for a selling opportunity around 44,300 zone, Dow Jones is trading in a downtrend and currently is in a correction phase in which it is approaching the trend at 44,300 support and resistance area.
Trade safe, Joe.


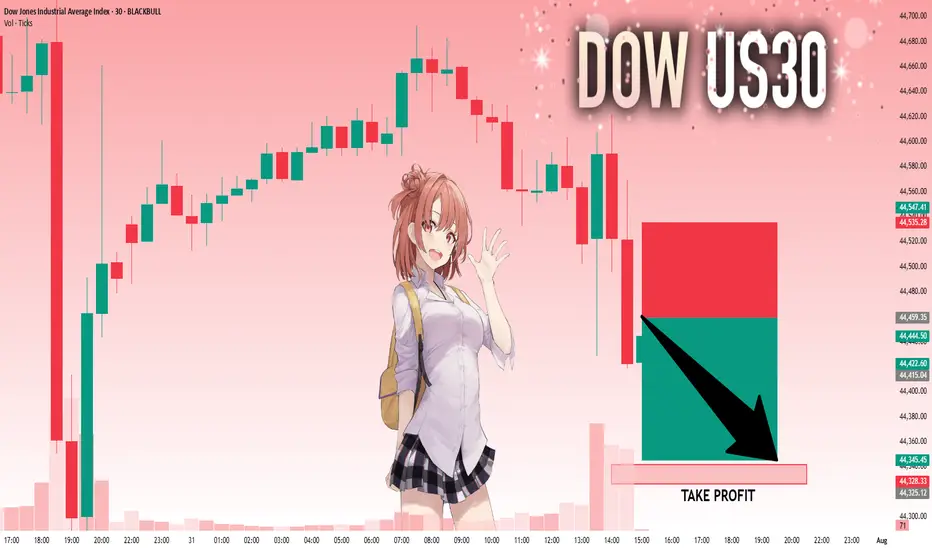
US30: Absolute Price Collapse Ahead! Short!
My dear friends,
Today we will analyse US30 together☺️
The in-trend continuation seems likely as the current long-term trend appears to be strong, and price is holding below a key level of 44,459.35 So a bearish continuation seems plausible, targeting the next low. We should enter on confirmation, and place a stop-loss beyond the recent swing level.
❤️Sending you lots of Love and Hugs❤️
Dow Jones August GameplanNow that the first trading day of August has printed, can one reliably forecast the possible month based on just the first day? I am inclined to believe that one can with a small amount of accuracy. Not perfect.
There are two types of monthly cycles when the first traded day is a bearish candle right from the open of the month.
Type 1 is a bearish trending cycle that trends lower and lower. It is then followed up by small number of bullish pullbacks halfway through the month before rolling back over and closing near the lows.
Type 2, more common, is when the first traded day is bearish right from the get-go as well, trades lower but reverses near the beginning of the month before trading higher than the open and forming a bullish bar.
So, in my opinion, there are only two probably outcomes for August.
Type 1:
Type 2:


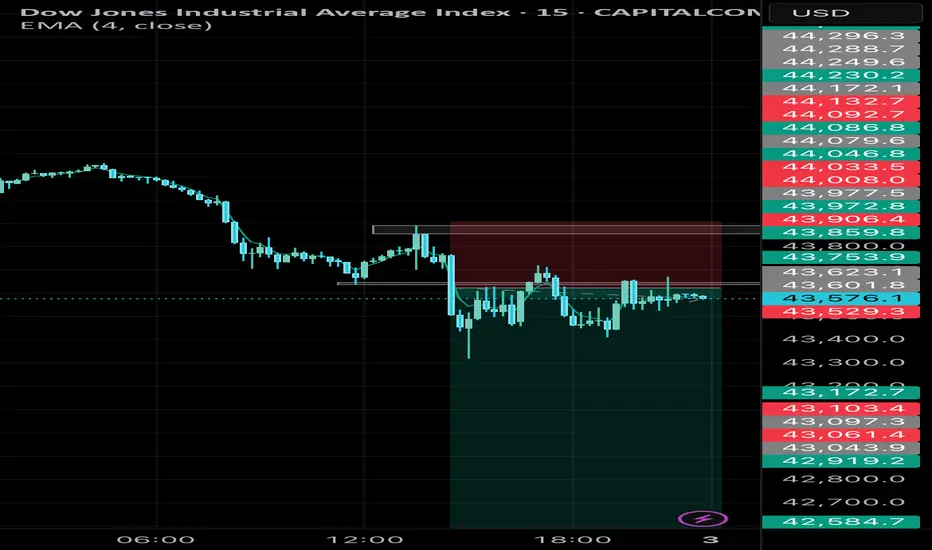
US30 (15M) – Bearish Reversal Setup, Short Opportunity📊 Analysis:
The US30 index on the 15-minute chart is showing signs of a bearish reversal after a recent upward push. Key technical observations:
1. Price Action & Structure
* US30 has been trading in a minor uptrend, but momentum is weakening.
* The latest 15M candles show lower highs forming near resistance, suggesting exhaustion in buying pressure.
2. Resistance Zone
* The price is rejecting a strong intraday resistance zone near 43641.90.
* Multiple failed attempts to break above this level reinforce it as a key barrier.
3. Target Levels
* First support target: 43206.96 – a minor support from previous structure.
* Secondary target: 41911.76.
4. Risk Management
* Suggested stop-loss: Above the recent swing high.
* Risk/reward ratio: Aim for at least 1:2 to ensure proper trade efficiency.
✅ Summary:
US30 on the 15-minute chart is showing a bearish setup.
⚠️ This analysis is for educational purposes only and not financial advice. Always use proper risk management.

DOW/US30 - PATIENCE IS THE KEYTeam, i expect the DOW/ NAS will be selling off due RATE unchange
i am going LONG now at 44335-44300 ranges
STOP LOSS at 44195
Target 1 at 44500-44550
Target 2 at 44600-44630
LETS GO
By the way, if you trade AUS200 today, both target hit on SHORT.
US30 short movePrice had broken our support level and hence i expect a rest to the new formed resistance before resuming its bearish move.
US30: : Local Bullish Bias! Long!
My dear friends,
Today we will analyse US30 together☺️
The recent price action suggests a shift in mid-term momentum. A break above the current local range around 44,802.50 will confirm the new direction upwards with the target being the next key level of 44,914.32 and a reconvened placement of a stop-loss beyond the range.
❤️Sending you lots of Love and Hugs❤️
Dow Jones Triple Top & Critical Trendline Break - Buy The Dip?Potential Tripple Top formation spotted on the Dow. This would represent a full fibonacci retracement, which leads me to believe a 38.2 retest is likely. If this 23.6 level can hold support and price does not close below the fib band (orange channel), then the bullish continuation to new all time highs can still happen in Q3/Q4 of this year. The clear trendline break dating back to April is very concerning (white line), leading me to believe more downside in the coming weeks.
Let me know what you think in the comments!
Thanks

US30 Rejected Support at 43340 – Bearish Below 43960US30 – Overview
The price rejected perfectly from the projected support at 43340 and currently maintains a bearish momentum as long as it trades below the pivot level at 43960.
As long as the price remains under this level, we expect a move toward 43630, and a break below that may lead to a retest of 43340.
However, a 4H candle close above 43960 would shift the outlook to bullish, with upside potential toward 44170 and possibly 44360.
Support: 43630 • 43340
Resistance: 44170 • 44360
Bias:
🔻 Bearish below 43960
🔺 Bullish confirmation on 4H close above 43960

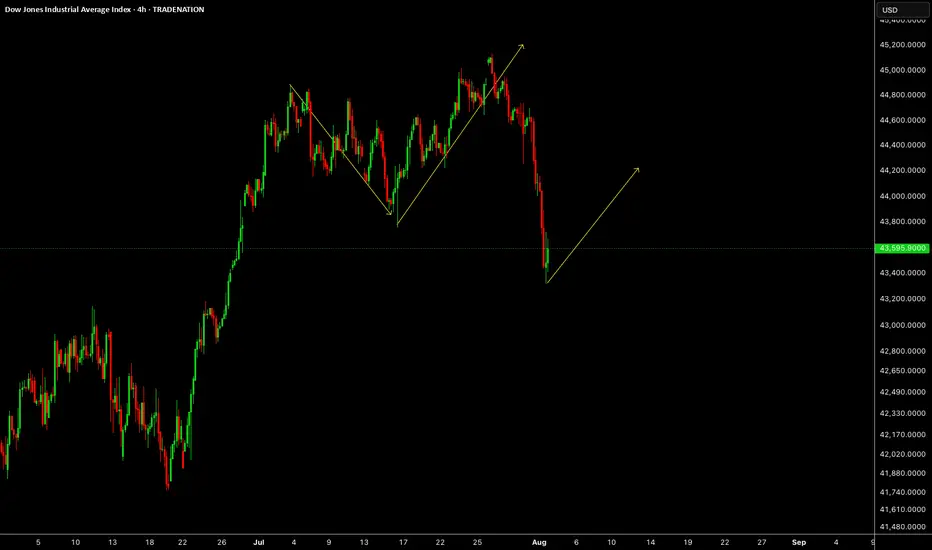
US30US30 was expected to drop last week which is what market has done. This week we need upside correction or impulse.
Disclosure: We are part of Trade Nation's Influencer program and receive a monthly fee for using their TradingView charts in our analysis.
US30 Swing Short!
HI,Traders !
#US30 keeps falling down
And the index broke the
Key wide horizontal level
Around 43924.6 which is now
A resistance and the breakout
Is confirmed so we are very
Bearish biased and we will
Be expecting a bearish
Continuation on Monday !
Comment and subscribe to help us grow !

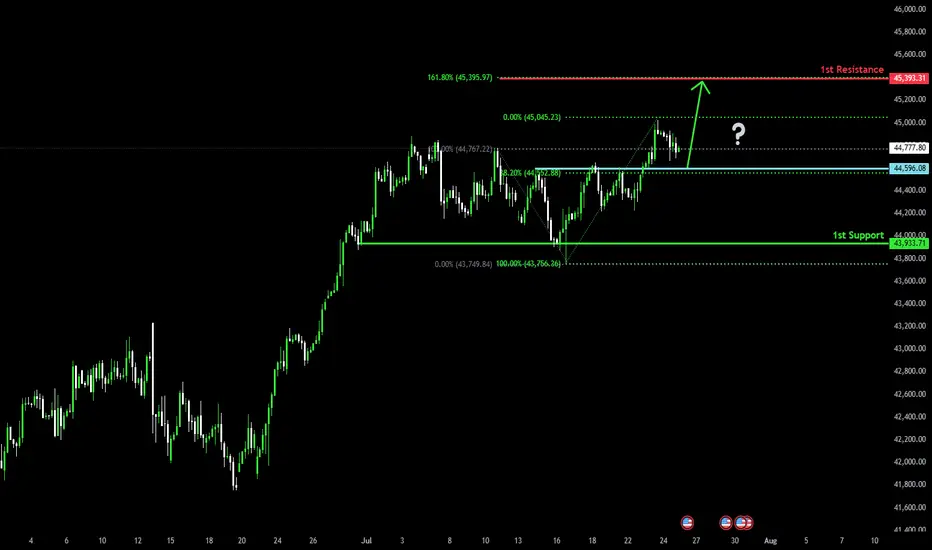
Bullish bounce off pullback support?Dow Jones (US30) is falling towards the pivot and could bounce to the 161.8% Fibonacci resistance.
Pivot: 44,596.08
1st Support: 43,933.71
1st Resistance: 45,393.31
Risk Warning:
Trading Forex and CFDs carries a high level of risk to your capital and you should only trade with money you can afford to lose. Trading Forex and CFDs may not be suitable for all investors, so please ensure that you fully understand the risks involved and seek independent advice if necessary.
Disclaimer:
The above opinions given constitute general market commentary, and do not constitute the opinion or advice of IC Markets or any form of personal or investment advice.
Any opinions, news, research, analyses, prices, other information, or links to third-party sites contained on this website are provided on an "as-is" basis, are intended only to be informative, is not an advice nor a recommendation, nor research, or a record of our trading prices, or an offer of, or solicitation for a transaction in any financial instrument and thus should not be treated as such. The information provided does not involve any specific investment objectives, financial situation and needs of any specific person who may receive it. Please be aware, that past performance is not a reliable indicator of future performance and/or results. Past Performance or Forward-looking scenarios based upon the reasonable beliefs of the third-party provider are not a guarantee of future performance. Actual results may differ materially from those anticipated in forward-looking or past performance statements. IC Markets makes no representation or warranty and assumes no liability as to the accuracy or completeness of the information provided, nor any loss arising from any investment based on a recommendation, forecast or any information supplied by any third-party.
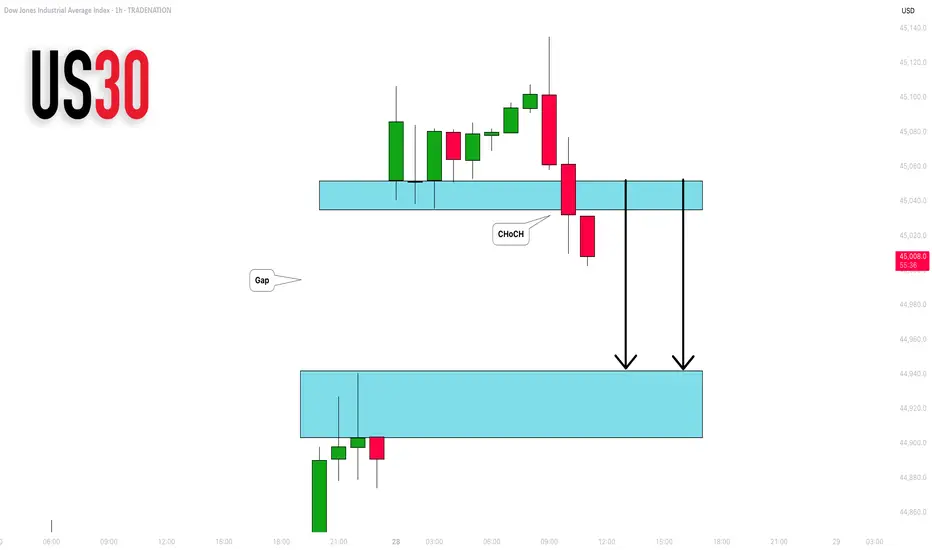
DOW JONES INDEX (US30): Another Gap For Today?
I see another gap up opening on US30 Index.
I think it will be filled today. A formation of an intraday
bearish CHoCH on an hourly time frame suggests
a highly probable bearish continuation.
Goal - 44943
❤️Please, support my work with like, thank you!❤️
I am part of Trade Nation's Influencer program and receive a monthly fee for using their TradingView charts in my analysis.
US30 (Dow Jones) may return to growthThe Dow Jones is declining (correction) following a technical false breakout, as well as local news. The overall trend is upward, with the correction serving as a means to gather liquidity prior to growth. Confirmed support, previously consolidation resistance, at 44600 can be considered a reference point. If buyer interest can keep the price in the buying zone during the retest, the price will continue to rise.
A false break of 44600 - 44620 and consolidation of the price above this level will confirm readiness for growth...

US30 Faces Pressure Below 44610US30 Overview
Technical Outlook:
US30 is showing bearish momentum while trading below the pivot zone at 44610. As long as the price remains under this level, downside pressure may continue toward 44360, with further support at 44180.
However, a confirmed breakout above 44720 would shift the bias to bullish, opening the path toward 44910 and potentially 45100.
Support Levels: 44480 • 44360 • 44180
Resistance Levels: 44720 • 44910 • 45100
Bias: Bearish below 44610, Bullish above 44720

Dow Jones Index Analysis (US30 / Dow Jones):🔹 The index broke below a key support zone yesterday and is now consolidating between 44,720 USD and 44,620 USD.
1️⃣ If bullish momentum leads to a break and close above 44,740 USD, the price may retest the 44,970 USD zone.
2️⃣ However, if the price breaks below 44,600 USD and holds, a decline toward 44,350 USD is likely.
⚠️ Disclaimer:
This analysis is not financial advice. It is recommended to monitor the markets and carefully analyze the data before making any investment decisions.
