DowJones The Week Ahead Key Support and Resistance Levels
Resistance Level 1: 44390
Resistance Level 2: 44720
Resistance Level 3: 45100
Support Level 1: 43360
Support Level 2: 43140
Support Level 3: 42800
This communication is for informational purposes only and should not be viewed as any form of recommendation as to a particular course of action or as investment advice. It is not intended as an offer or solicitation for the purchase or sale of any financial instrument or as an official confirmation of any transaction. Opinions, estimates and assumptions expressed herein are made as of the date of this communication and are subject to change without notice. This communication has been prepared based upon information, including market prices, data and other information, believed to be reliable; however, Trade Nation does not warrant its completeness or accuracy. All market prices and market data contained in or attached to this communication are indicative and subject to change without notice.
DJI trade ideas

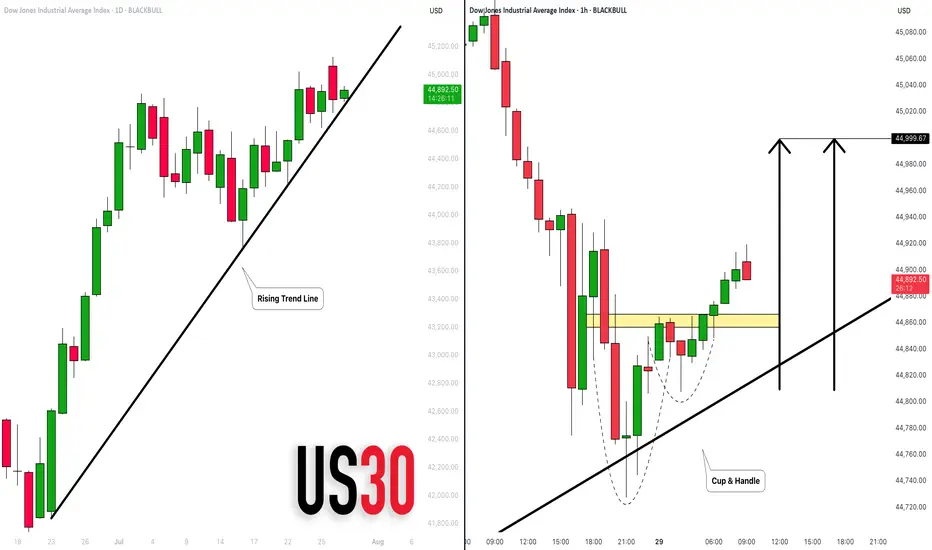
DOW JONES INDEX (US30): Bullish Move From Trend Line
There is a high probability that US30 will continue rising today,
following a test of a solid rising trend line on a daily.
As a confirmation, I see a cup & handle on that after its test
on an hourly time frame.
Goal - 45000
❤️Please, support my work with like, thank you!❤️
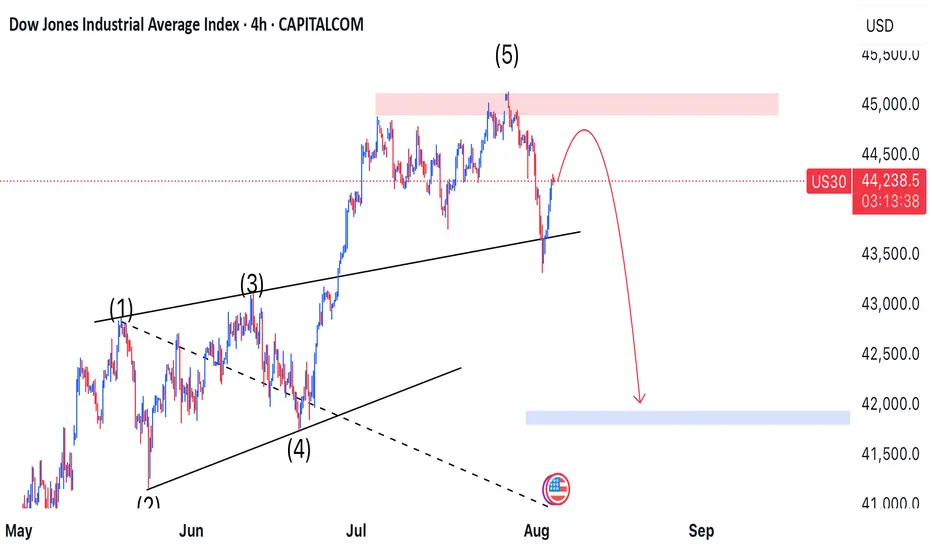
*US30: Fifth Wolfe Wave in Play—Correction Offers Prime Shorting📉 *
The US30 index has completed its **fifth Wolfe Wave**, initiating the expected downward move. While price is currently undergoing a corrective bounce, this retracement is shaping up to be a golden opportunity for sellers.
🔍 **Technical Breakdown**
- ✅ Wolfe Wave structure is confirmed, with wave 5 marking the turning point.
- 🔄 Current price action shows a **corrective pullback**, typical after the initial drop.
- 📌 Any upward movement is viewed as a **strategic entry point for short positions**.
🎯 **Target Zone**
We’re eyeing a descent toward the **41,700 level**, which aligns with the equilibrium line drawn between **waves 1 and 4**—a classic Wolfe Wave target.
⚠️ **Trade Insight**
This setup blends harmonic precision with tactical timing. As long as price remains below the wave 5 peak, the bearish bias holds strong. Sellers are watching for signs of exhaustion in the correction to strike.
---
KOG - US30US30
Looking at this we have a clean reversal in play suggesting we’re going to get lower order regions before a potential RIP. The red boxes have been added and may give us opportunities to capture the tap and bounces on the smaller TFs.
If we can support lower, we could very well see this push up into the ideal target level we have illustrated.
Please do support us by hitting the like button, leaving a comment, and giving us a follow. We’ve been doing this for a long time now providing traders with in-depth free analysis on Gold, so your likes and comments are very much appreciated.
As always, trade safe.
KOG

US 30 Index – Potential Rebound or Deeper Retracement Ahead?Just as the US 30 became the last of the three major US indices to register a new all time high last Monday at 45160, on a final wave of positivity generated by the announcement of a trade deal between the US and EU, it was snatched away again as traders used the up move to take profit on longs.
This initial fall evolved into 5 straight daily declines which took the index from its record high of 45160 on Monday to a Friday close at 43591 as the sell off accelerated, driven by disappointment of a more hawkish than expected Fed, a new wave of trade tariffs from President Trump, weaker Amazon earnings , and on Friday, perhaps the biggest surprise of all, a Non-farm Payrolls release that showed the US labour market may be weakening faster than anticipated.
Looking forward, with the shock of Friday’s data reverberating through markets, US 30 traders still have lots to think about this week. The US ISM Services PMI release is due at 1500 BST on Tuesday. Service activity has been the major driver of growth in the US economy for the last 18 months, so this new update could have a big influence over where the US 30 index moves next. Any reading below 50 = economic contraction, while readings above 50 = economic expansion, and traders could well be focused on how this month’s print stacks up against last month’s reading of 50.8.
The earnings releases of 3 bellwether US corporates may also be relevant, given their US 30 index weightings. Caterpillar reports its Q2 results before the market open on Tuesday, with McDonald’s and Walt Disney reporting before the open on Wednesday. Traders may be looking to compare actual earnings against expected, alongside assessing any future revenue guidance that is provided against the current trade tariff operating environment.
Now, while the US 30 index has opened this new trading week on a more stable footing, currently trading up 0.25% at 43705 at the time of writing (0530 BST), assessing the technical outlook for the week ahead could also be useful for traders.
Technical Update: Deeper Retracement Risk Emerging?
While it might be argued that it was the reaction to the latest US employment data that saw US equities encounter fresh selling pressure, as the chart below shows, prices were already declining into Friday’s payrolls release.
Price weakness was materialising in the US 30 index right after it posted its new all-time high on Monday July 28th at 45160, and traders might now argue that last Thursday’s close below support provided by the Bollinger mid-average, currently at 44412, was the first potential indication that a more extended phase of price weakness was possible. The case was then perhaps strengthened by Friday’s negative reaction to the payrolls data, which saw closing breaks under support provided by the July 16th last correction low at 43770.
There is of course no guarantee that this price action will result in a retracement of the April 7th (36440) to July 28th strength (45160), but assessing what may be the potential support and resistance levels to monitor this week could be helpful, if the recent volatility continues to dominate price action at the start of August.
Possible Support Levels:
Last week’s price decline held at the 43337 level which was the August 1st low, and having previously found buyers at this point, they may be found again. As such, this 43337 level could now prove to be the first support focus for the week ahead.
Closing breaks below 43337, if seen, could lead to the possibility of further price declines, opening potential to test the next support at 41824, which is the 38.2% Fibonacci retracement of April to July 2025 price strength (see chart above).
Possible Resistance Levels:
Having now seen the Bollinger mid-average for the US 30 index turn lower after last week’s fall, this may now be the first resistance level to watch on any subsequent rally higher. It currently stands at 44442 and watching how this level is defended on a closing basis could be useful.
If a more sustained phase of price strength is to materialise, it could be closing breaks above the mid-average at 44442 that increases the possibility of it happening. Such moves could then see retests of the July 28th all-time high at 45160, possibly higher if this level is then breached on a closing basis.
The material provided here has not been prepared accordance with legal requirements designed to promote the independence of investment research and as such is considered to be a marketing communication. Whilst it is not subject to any prohibition on dealing ahead of the dissemination of investment research, we will not seek to take any advantage before providing it to our clients.
Pepperstone doesn’t represent that the material provided here is accurate, current or complete, and therefore shouldn’t be relied upon as such. The information, whether from a third party or not, isn’t to be considered as a recommendation; or an offer to buy or sell; or the solicitation of an offer to buy or sell any security, financial product or instrument; or to participate in any particular trading strategy. It does not take into account readers’ financial situation or investment objectives. We advise any readers of this content to seek their own advice. Without the approval of Pepperstone, reproduction or redistribution of this information isn’t permitted.

US30 Forecast: Target Locked, Buy Zones in Sight!Good morning friends ☀️
I've prepared a fresh analysis for US30 (Dow Jones).
My current target is 45,470. Even if the price dips to 45,050 or 44,800, I fully expect it to reach that 45,470 mark.
These levels represent strong buying zones and powerful retest regions—don’t forget that.
Every like from you is my biggest source of motivation to keep posting these insights. 💬📊
Big thanks to everyone supporting with a thumbs-up.

US 30 Dow Jones Industrial Average Week 32 OutlookUS 30, along with related indices, is likely to range for most of the week with early sells to confirm the support of interest. Best interest is in the bearish sentiment right now.
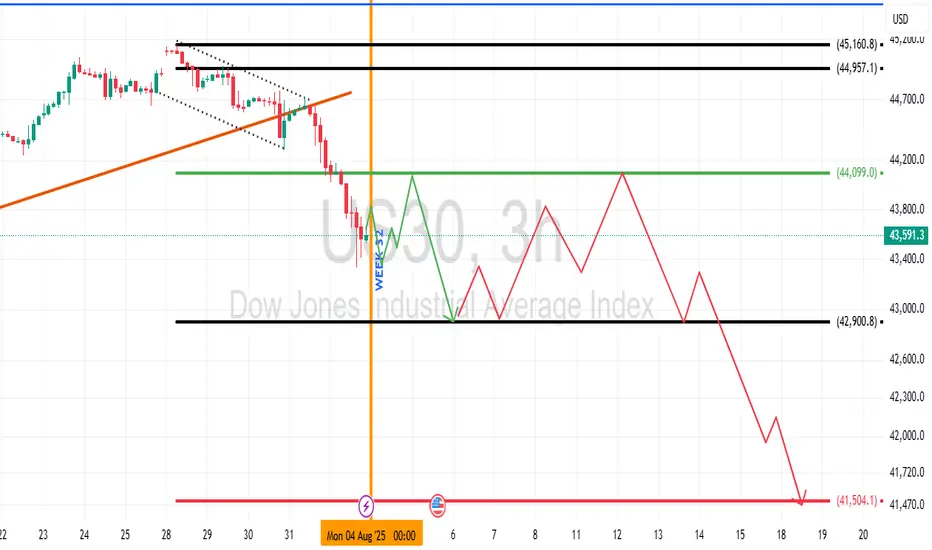
Will the Dow Jones continue its correction?
Hi everyone
The indicator may continue to correct itself by breaking the condition written in the figure (with an orange line). There is a blue box on the figure that shows the place where orders are collected. It is possible that buy orders will be placed in this area and then the downward trend will begin.
What percentage of the probability do you think there is of reaching the specified targets?
Be sure to follow me because you can make good profits from the market.
US30 Bullish Bias!
HI,Traders !
#US30 went down and
Retested a horizontal
Support of 43775.2 from
Where we are seeing a
Bullish rebound so as we
Are bullish biased and we
Will be expecting a further
Bullish move up !
Comment and subscribe to help us grow !

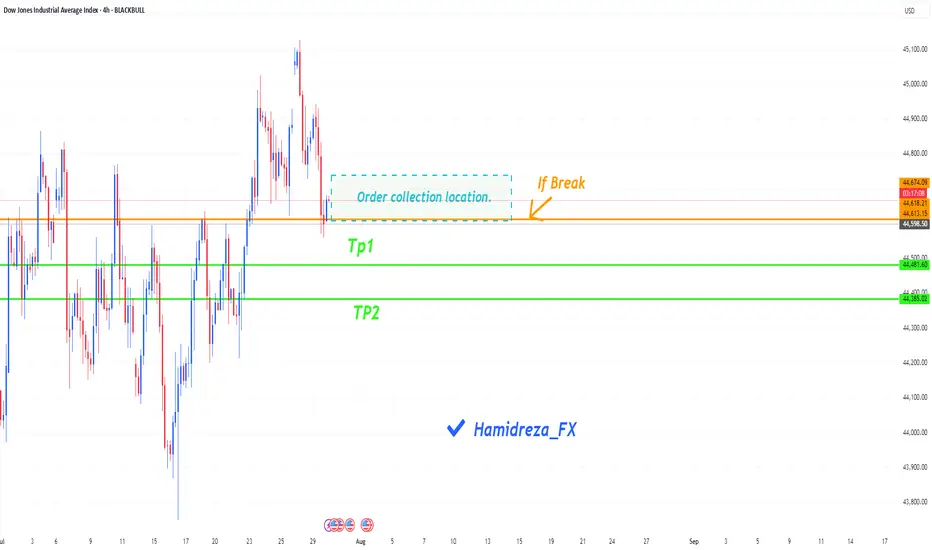
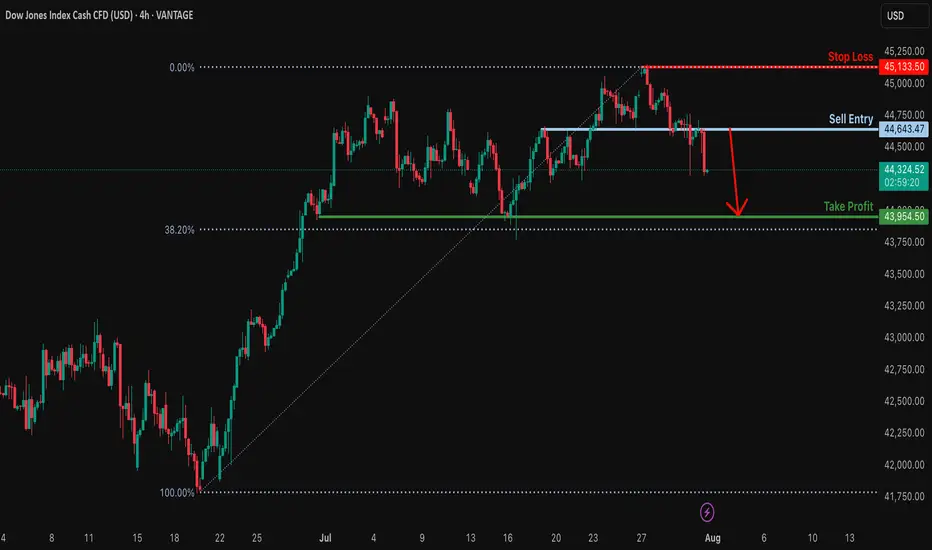
Potential bearish drop?Dow Jones (DJ30) has reacted off the resistance level which is an overlap resitance and could drop from this levle ot our takeprofit.
Entry: 44,643.47
Why we like it:
There is an overlap resistance levle.
Stop loss: 45,133.50
Why we like it:
There is a swing high resistance.
Take profit: 43,954.50
Why we like it:
There is a multi swing low support.
Enjoying your TradingView experience? Review us!
Please be advised that the information presented on TradingView is provided to Vantage (‘Vantage Global Limited’, ‘we’) by a third-party provider (‘Everest Fortune Group’). Please be reminded that you are solely responsible for the trading decisions on your account. There is a very high degree of risk involved in trading. Any information and/or content is intended entirely for research, educational and informational purposes only and does not constitute investment or consultation advice or investment strategy. The information is not tailored to the investment needs of any specific person and therefore does not involve a consideration of any of the investment objectives, financial situation or needs of any viewer that may receive it. Kindly also note that past performance is not a reliable indicator of future results. Actual results may differ materially from those anticipated in forward-looking or past performance statements. We assume no liability as to the accuracy or completeness of any of the information and/or content provided herein and the Company cannot be held responsible for any omission, mistake nor for any loss or damage including without limitation to any loss of profit which may arise from reliance on any information supplied by Everest Fortune Group.
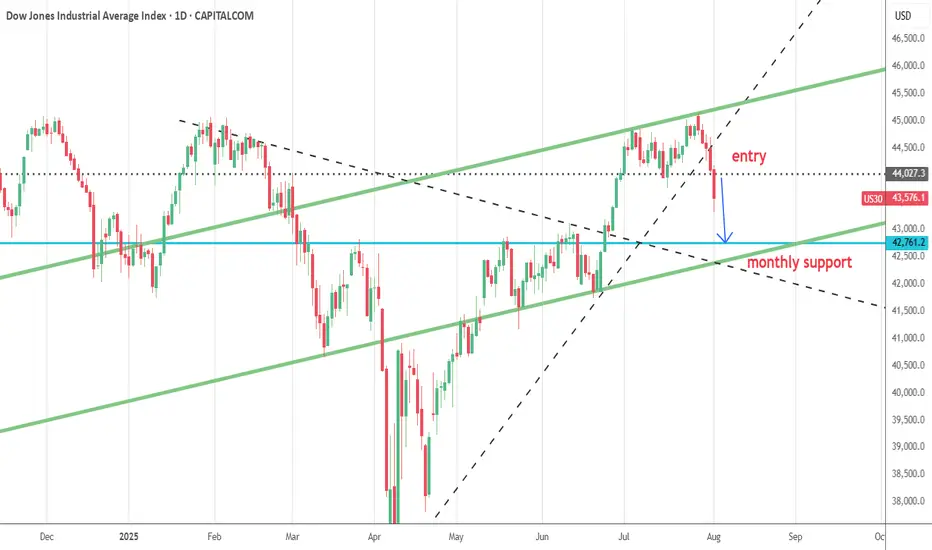
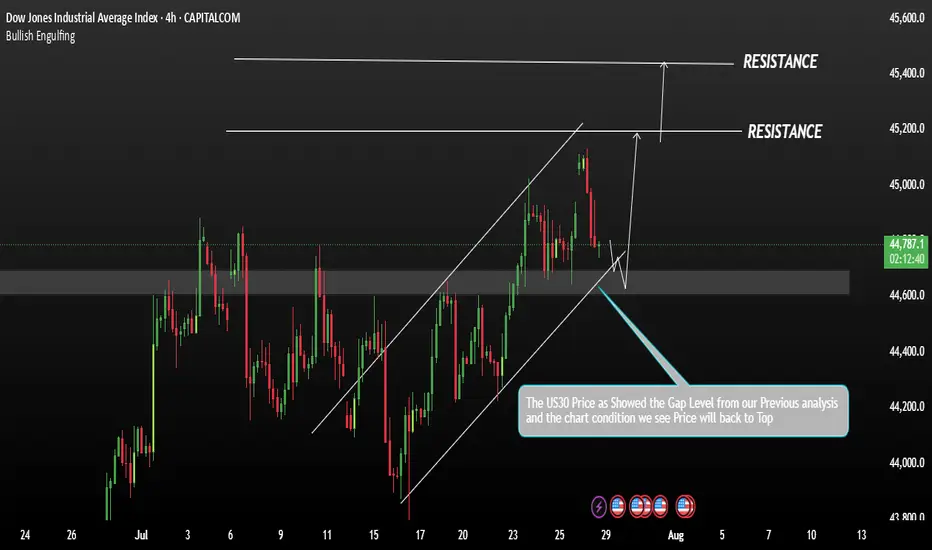
US30 Correction with in a Downtrend ChannelUS30 is currently in a consolidation phase within a broader bullish trend. From our previous analysis, the index has shown strong upward momentum. However, to confirm a potential bearish shift, the price would need to break back below key support levels, potentially leading to a deeper correction.
If the price stabilizes above 44,000 on the 4H timeframe, this would strengthen the bullish momentum. A sustained move above this level could open the path towards the next targets at 45,200 and 45,400.
You May find more details in the chart.
Ps: Support with like and comments for better analysis

Dow Jones US30 Trend Analysis and Trade Plan Breakdown📈 US30 (Dow Jones) is currently in a strong bullish trend 🔥. This is clearly visible on the 4H chart, where we’re seeing a consistent pattern of higher highs and higher lows 🔼🔼.
👀 I’m watching for a potential long opportunity, especially since the higher timeframes remain firmly bullish 🟢.
🎥 In the video, we break it down:
A quick overview of the 4-hour structure
Then dive into a potential trade setup on the 30-minute chart ⏱️🔍
🧠 This is for educational purposes only and not financial advice ⚠️📚

US30: Will Go Down! Short!
My dear friends,
Today we will analyse US30 together☺️
The recent price action suggests a shift in mid-term momentum. A break below the current local range around 47,577.1 will confirm the new direction downwards with the target being the next key level of 43,436.6 .and a reconvened placement of a stop-loss beyond the range.
❤️Sending you lots of Love and Hugs❤️
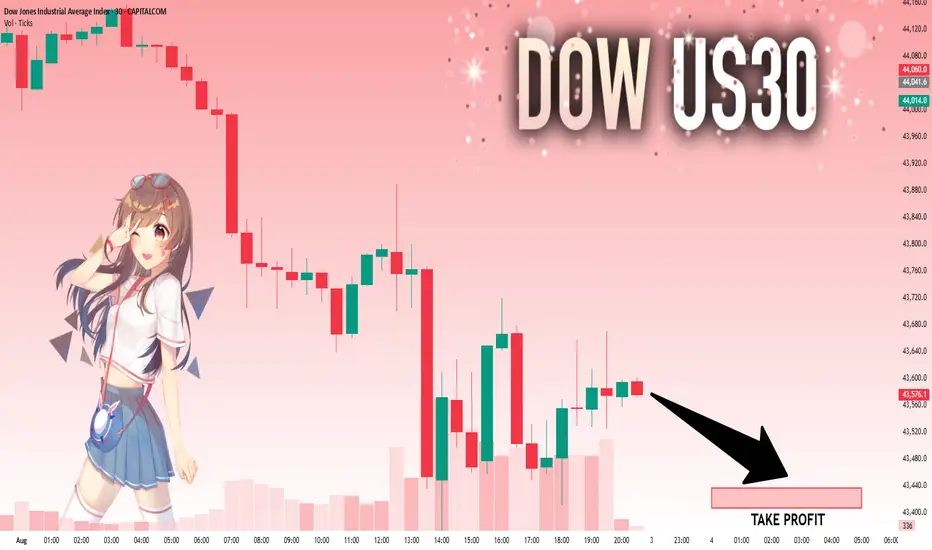
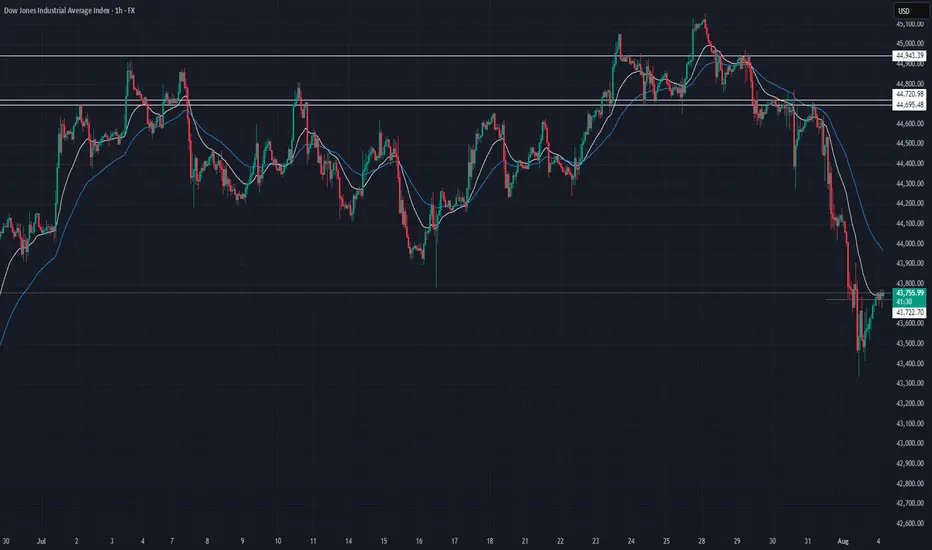
US30 Technical Breakdown – 08/04/2025📍 US30 Technical Breakdown – 08/04/2025
US30 sold off sharply, breaking down from the 44,600–44,700 range and diving as low as 43,500. Price is currently bouncing near 43,750, but the trend remains weak with lower highs and a breakdown structure intact.
The market lost its key support zone and is now attempting a weak relief rally. Bulls must reclaim 44,000 to avoid further selling pressure.
📊 Current Market Behavior:
📉 Sharp downside momentum
🔄 Small bounce after aggressive breakdown
🧱 Old support at 44,600–44,700 now acting as resistance
⚠️ Bearish structure intact unless reclaimed
📌 Key Levels:
🔹 Resistance Zones:
43,950–44,000 → Minor intraday resistance
44,600–44,720 → Major breakdown zone
44,943 → Swing high before selloff
🔹 Support Zones:
43,600 → Intraday bounce zone
43,500 → Recent low
43,200 → Next potential demand area
🧠 Bias:
📉 Bearish Intraday
Market still under heavy pressure with no major reversal signals. Relief rallies likely to be sold until key levels are reclaimed.
US30 _BUY RETRACEMENT-SELL CONTINUATION-HIGHER TIMEFRAME-FVGThe week of July 28th the market reacted off the resistance around the 45,097 level to the sellside creating a downward trend. On the Monthly and the weekly, the market has traded down into a higher timeframe FVG, possibly creating a buy model for the upcoming week. On the 4hour it's possible a continuation will occur to the sellside.

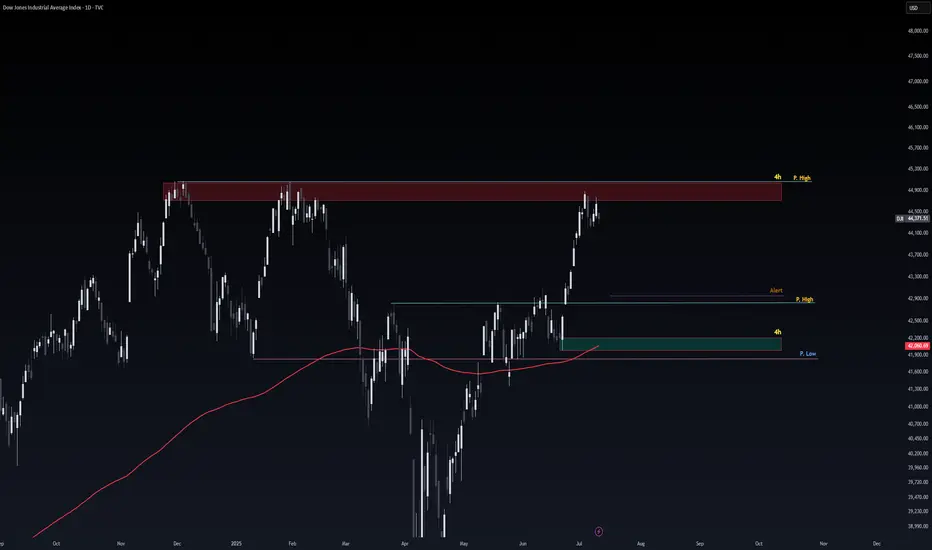
Safe Entry DJIObvious Movement I Guess.
P.High(Previous High) Act As good Support for price to Respect.
Note: 1- Potentional of Strong Buying Zone:
We have two scenarios must happen at The Mentioned Zone:
Scenarios One: strong buying volume with reversal Candle.
Scenarios Two: Fake Break-Out of The Buying Zone.
Both indicate buyers stepping in strongly. NEVER Join in unless one showed up.
2- How to Buy Stock (safe way):
On 1H TF when Marubozu/Doji Candle show up which indicate strong buyers stepping-in.
Buy on 0.5 Fibo Level of the Marubozu/Doji Candle, because price will always and always re-test the
US30 - BUYStrong selling pressure today as price has grabbed a ton of buy side liquidity. As we approach FOMC news tomorrow, I am expecting buyers to take back control and price reach Sundays opening price.

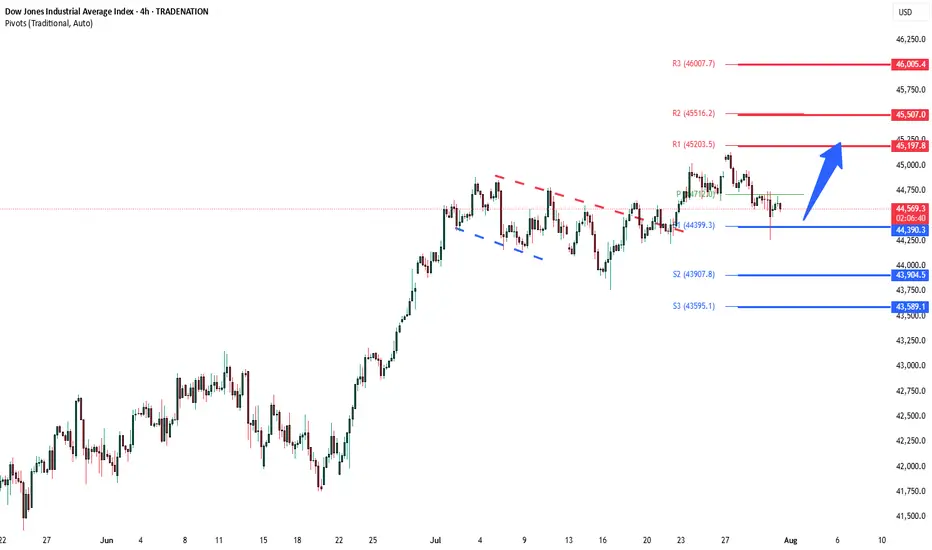
DowJones breakout retest supported at 44390Key Support and Resistance Levels
Resistance Level 1: 45197
Resistance Level 2: 45500
Resistance Level 3: 46000
Support Level 1: 44390
Support Level 2: 43900
Support Level 3: 43590
This communication is for informational purposes only and should not be viewed as any form of recommendation as to a particular course of action or as investment advice. It is not intended as an offer or solicitation for the purchase or sale of any financial instrument or as an official confirmation of any transaction. Opinions, estimates and assumptions expressed herein are made as of the date of this communication and are subject to change without notice. This communication has been prepared based upon information, including market prices, data and other information, believed to be reliable; however, Trade Nation does not warrant its completeness or accuracy. All market prices and market data contained in or attached to this communication are indicative and subject to change without notice.
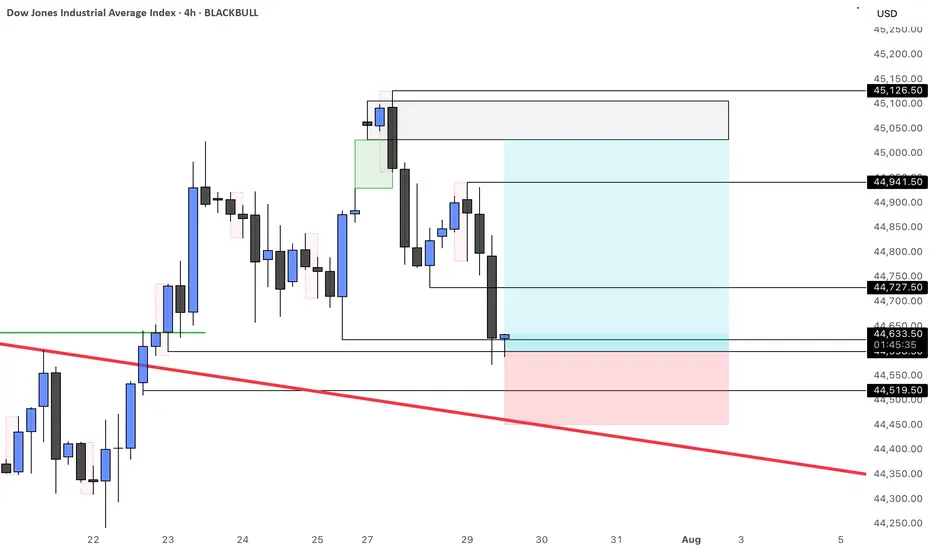
US30 Sell analysis/ideathis trade is based on the 4-hour timeframe and executed using reversal trading and trend formation. Complete explanation in the video!

DJ30/US30 LONG Reason for trade:
1. Expanding flat in play
2. Equal highs (LIQUIDITY)
3. Currently at the order block area (Ready)
Entry: 43647
Stop Loss: 43386
Take Profit: 45246
Strategy: Wait for a 30 minute engulfing candle closure.
Once in profit of 1:1 R, place the trade at BE
Blessings, in CHRIST.
