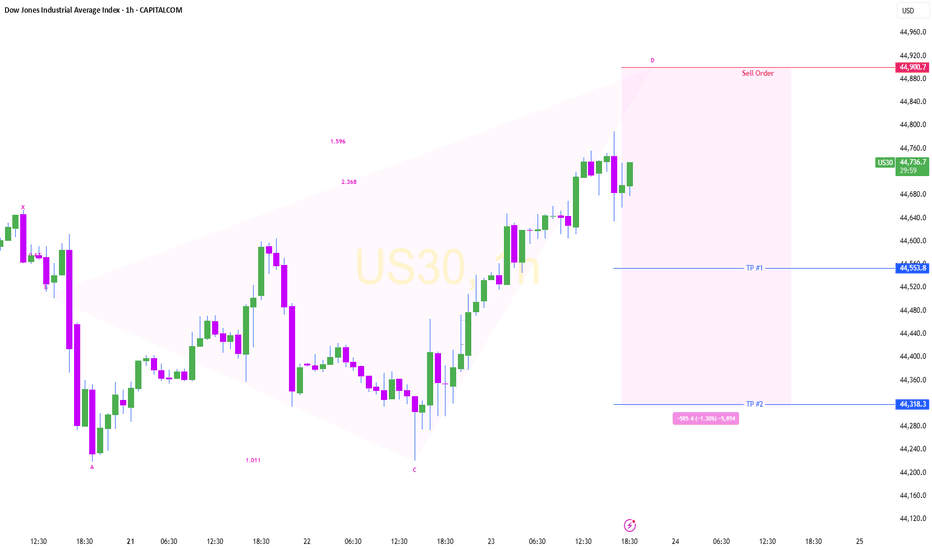
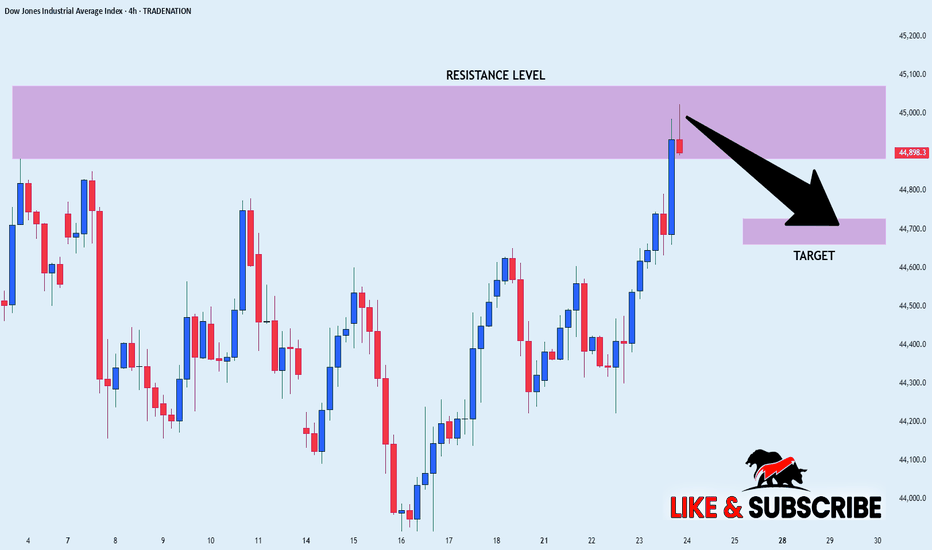
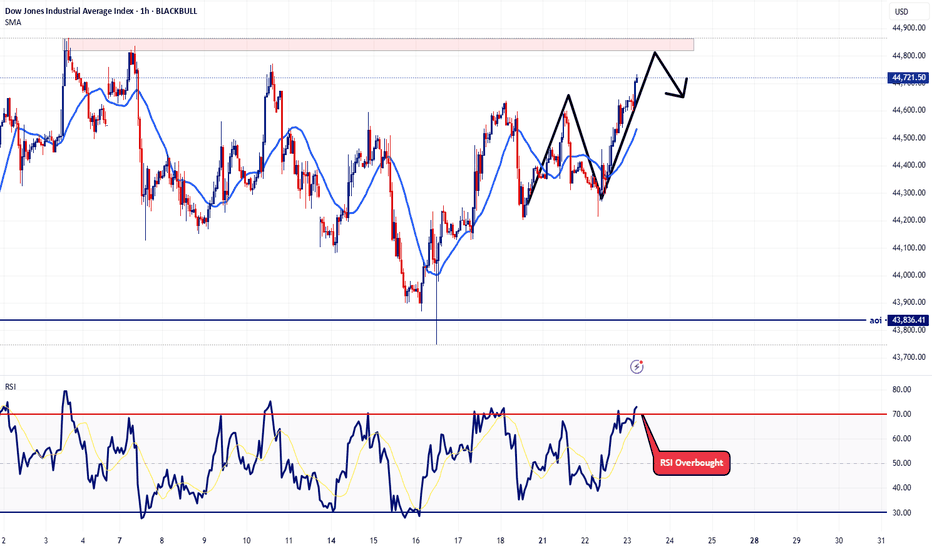
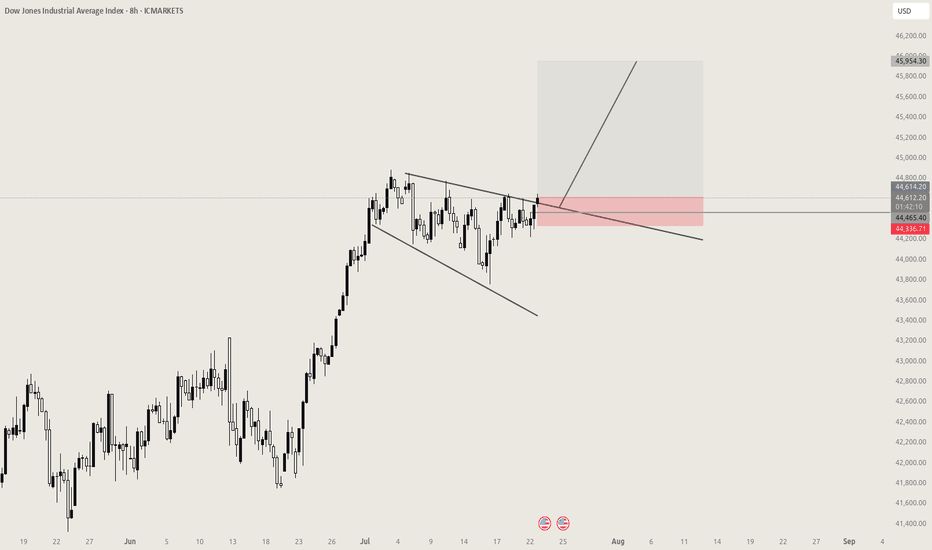
US30 Breaks Out of Wedge – Bulls Eyeing 43,000 Next?Big breakout alert on the Dow Jones Index (US30)!
Key Technical Highlights:
Falling Wedge Breakout: Price broke out of a large falling wedge pattern, often a bullish continuation signal.
Clean Retest: We’ve seen a breakout above the neckline, followed by a minor consolidation – a healthy sign of trend continuation.
Trendline Confluence: Price is now riding the ascending trendline, showing strong bullish structure and momentum.
Next Zone to Watch: Immediate resistance near 43,000 could be the next key level. If bulls maintain momentum, that zone may be tested soon.
Trade Outlook:
Bias: Bullish, as long as price stays above 41,500–41,800 area.
Invalidation: A drop below the ascending trendline would invalidate the breakout and shift sentiment to neutral.
What do you think? Is this a bull trap or is the Dow ready to continue higher? Share your analysis below!
Smash that like button, comment your setup, and follow for more clean technical charts.
#us30 #dowjones #indextrading #priceaction #chartanalysis #breakoutstrategy #technicalanalysis #tradingview
DJI trade ideas
US30 (Dow Jones) – 14 May 2025 Updat📊 US30 (Dow Jones) – 14 May 2025 Update 🚨
Price action is consolidating just below 42,200, forming a tight bullish flag/pennant structure after a clean breakout run. The trend remains firmly bullish, with EMAs aligned and curling up 📈.
🔎 Quick Breakdown:
📍 Current Price: 42,185
⏸ Consolidation Zone: 42,000–42,250
🧠 Market is resting after a strong move — textbook bullish continuation setup
🔥 What to Watch:
Break and hold above 42,250 → 🚀 Expansion move possible toward 42,600–42,800
Failure + close below 42,000 → ⚠️ Minor retrace to 41,700 support (EMA catch zone)
Volume is thinning out — breakout may come soon. Stay sharp. 👀
🧠 Mindset Tip:
Markets move in impulse → correction → impulse. This pause is normal.
✅ Wait for confirmation
❌ Don’t chase inside chop
DJI – Ready for the Final ActAfter the breakdown below the last support on March 11th, the price pulled back and formed P2.
A frightening drop followed, reaching P3, then a sharp V-shaped recovery up to point (4)—just a few points shy of the Center Line.
If P2 doesn’t get taken out, things could turn ugly again. Because in that case, my new target lies below the white Lower Median Line Parallel, at P5.
Nothing is certain—never has been. But these days, *everything* feels off balance.
The moves are insane. Governments trading ahead of the news, making hundreds of millions at the expense of ordinary people. It’s like reality has left the building.
Tiny positions. Tight stops. Very high risk-reward ratios. And absolutely zero FOMO.
That’s how these markets must be traded.
Anything else, and we’re bound to get wrecked.
\#backfromcontemplation
US30 Sell Setup before the BIG MOVE TO THE MOON" US30 has been moonwalking higher like it’s got a VIP pass—thanks to those cozy deals between the US and EU. The bulls are charging like they’ve had one too many energy drinks, and honestly, it’s getting a little too enthusiastic up here.
So, I’m eyeing a sneaky short sale for a quick snack of profit before the long-term feast. But I won’t just dive in like a reckless lemming—oh no, I’ll wait for my trusty confirmations to wave their little green (or red?) flags first.
As for the long game? Once my short-sell shenanigans hit those sweet support levels (and hopefully bounce like a trampoline), I’ll switch teams and ride the buy train. Because why pick a side when you can profit from both?"
Hope that brings a smile while keeping your trading strategy sharp! 😆📈
DOW JONES: Breached the 1D MA200. Tariff War 2018 Recovery aheadDow Jones is on excellent bullish levels on its 1D technical outlook (RSI = 62.103, MACD = 203.720, ADX = 34.693) and as it crossed today above the 1D MA200 for the first time since April 2nd, and practically validates the recovery from the Tariff War correction, it draws strong comparisons with the last U.S.-China Tariff War in 2018. Both rebounded after highly oversold 1D RSI levels, and the 2019 recovery almost hit the 0.9 Fibonacci level before turning into a less aggressive recovery. The trade is long, TP = 44,100.
## If you like our free content follow our profile to get more daily ideas. ##
## Comments and likes are greatly appreciated. ##
Is It Over?Today's red Doji candle at the underside of the downtrend line is a high potential short entry point if not already. Despite the rally the past week or so, it is far from convincing...no real conviction to buy this market and who can blame them.
The current wave 2 bounce will be followed by wave 3 down as the most likely scenario, or we are in a wave 4 to be followed by a wave 5 to complete, any firm close below the lows gives us our answer.
Gold is selling off, our $3400 target was met and reversed in a now wave 4 down, this may approach the $3160 area, or a sideways move before another strong wave 5 up.
This is a great opportunity to accumulate physical metals to protect yourself from the coming reset.
Appreciate a thumbs up, Good Trading and God Bless you all!
DowJones INTRADAY key trading level at 41790US stocks point to slightly lower open as traders react to global and economic developments.
Main drivers:
Trump’s Gulf Visit: Markets are watching for any new investment deals or geopolitical tensions. A $600B Saudi investment deal was announced yesterday, and Trump is now heading to Qatar.
Tariff Optimism: Hopes of US-China tariff easing have supported recent rallies and reduced fears of a slowdown.
Rate Cut Expectations Lower: Stronger sentiment has reduced chances of near-term rate cuts by the Fed, ECB, and BoE. This may limit upside for some rate-sensitive stocks.
ECB Outlook: ECB’s Villeroy said a rate cut is likely this summer, keeping some dovish tone in Europe.
US CPI Impact: Markets are still digesting yesterday’s inflation data, which could affect future Fed moves.
Trading Takeaway:
Momentum is supported by global optimism, but fading rate cut hopes and geopolitical risks may keep gains in check. Stay alert for headlines out of the Gulf.
Key Support and Resistance Levels
Resistance Level 1: 42550
Resistance Level 2: 42910
Resistance Level 3: 43370
Support Level 1: 41790
Support Level 2: 41470
Support Level 3: 41220
This communication is for informational purposes only and should not be viewed as any form of recommendation as to a particular course of action or as investment advice. It is not intended as an offer or solicitation for the purchase or sale of any financial instrument or as an official confirmation of any transaction. Opinions, estimates and assumptions expressed herein are made as of the date of this communication and are subject to change without notice. This communication has been prepared based upon information, including market prices, data and other information, believed to be reliable; however, Trade Nation does not warrant its completeness or accuracy. All market prices and market data contained in or attached to this communication are indicative and subject to change without notice.
Trade Idea: US30 Long (BUY LIMIT)Justification:
Technical Analysis:
1. Daily Chart:
• Strong bullish reversal from recent lows.
• MACD is crossing up sharply, showing fresh bullish momentum.
• RSI at 62.33 — rising but not yet overbought (room to run).
• Price reclaiming key moving averages.
2. 15-Minute Chart:
• Clear uptrend continuation.
• MACD and RSI confirm bullish momentum.
• Price consolidating at recent highs — potential breakout formation.
3. 3-Minute Chart:
• Short-term consolidation near highs with low RSI (38.84) — possible dip-buy opportunity.
• MACD near zero — primed for a new short-term wave.
Fundamental Analysis (as of early May 2025 context):
• Likely market optimism surrounding softer inflation data and potential rate cuts.
• Dow components (industrials, financials) benefit from economic soft-landing expectations.
• VIX (if tracked) remains subdued, confirming risk-on sentiment.
⸻
Trade Plan (Long):
• Entry: 42,360
Near current consolidation zone on lower timeframes.
• Stop Loss (SL): 41,850
Below recent swing lows and key moving average support (approx. 510 pts risk).
• Take Profit (TP): 43,380
Targeting previous resistance area on the Daily chart (approx. 1020 pts reward).
FUSIONMARKETS:US30
DOW JONES WEAK TRENDDOW JONES WEAK TREND
The Dow Jones has been experiencing some fluctuations lately. While it surged over 300 points recently, there are concerns about economic slowdown indicators, such as weak labor market data and declining consumer confidence. Some analysts believe that the Federal Reserve may cut interest rates in response to these trends. However, strong earnings from big tech companies like Microsoft and Meta have helped offset some of the downward pressure
US30 - At Resistance? Holds or not??#US30 #DOWJONES - market just reached near to his current resistance region.
And if market hold it in that case we can expect a drop from here.
So don't be lazy here and only short below that.
Note: we will go for cut n reverse above region on confirmation.
Good luck
Trade wisely
Trade Idea: US30 Short ( SELL STOP )Technical Analysis Overview:
1. Daily Chart:
• Price has retraced sharply into resistance (near 41,300–41,400), rejecting the 200-day EMA zone.
• MACD still negative but turning up—suggests potential for a failed bounce.
• RSI at 55.33—approaching overbought in a corrective move, ripe for reversal.
2. 15-Min Chart:
• Bearish divergence forming on RSI with lower highs.
• MACD is turning down with momentum fading after a recent high around 41,665.
• Price has broken short-term moving average support, with momentum shifting down.
3. 3-Min Chart:
• Clear bearish structure with lower highs and lower lows.
• MACD and RSI confirm short-term weakness.
• Price hovering near local support (around 41,302), if broken, would confirm further downside.
⸻
Fundamental Context (Macro):
• FOMC & NFP results (recent) suggest continued uncertainty in interest rate direction.
• US manufacturing and employment data have shown mixed signals—equities vulnerable to downside corrections amid macro volatility.
• Seasonally, May is often a pullback month (“Sell in May”).
⸻
TRADE IDEA – SHORT US30
• Entry: 41,295 (current price at resistance zone)
• Stop-Loss (SL): 41,670 (above recent intraday high and 15-min resistance)
• Take-Profit (TP): 40,500 (prior support zone on 15-min chart)
FUSIONMARKETS:US30
Testing Trumps Theory About StocksSo, as you can see, I just kept it simple, Trump made a claim about buying stocks because this country is about to take off like a rocket. I told my wife I will check the charts. It's been a long time but ugh I think we will see a drop towards resistance before we see what he's talking about. This is the monthly I looked at it on the 3 months chart as well same things keeps popping up some pain before profit so I will be looking to buy on our way down this is the DOW but I am for sure looking for similar patterns in other stocks. But the S&P 500 Is looking the same also.
LET ME KNOW YOUR THOUGHTS BELOW.
this is a small reminder that I am not a professional and this is not investing advice I am simply giving my opinion as a fellow student in the art of trading.
US 30 Technical Analysis US30 Monthly, Weekly, and Daily Technical Analysis
Note: For educational purposes only. This is not financial advice.
Monthly Timeframe:
In April, the US30 (Dow Jones Industrial Average) posted a high of 42,548 and a low of 36,483. The April candle closed within the range of the March candle, signaling strong buying interest, likely driven by fundamental data. The key takeaway from the monthly chart is that April’s close within March’s range highlights buyer strength and the potential for continued bullish momentum.
Weekly Timeframe:
The bullish channel remains intact on the weekly timeframe. Although price briefly broke below the trendline, it quickly rebounded and re-entered the channel in the first week of April.
There has been no break of structure on the weekly chart. Last week's high at 42,858 swept the previous week’s high but closed within the previous week’s range, ending precisely at the prior week’s low. This indicates unclear price action and potential indecision.
If the upcoming week closes above the 43,100 level, this week’s low could be considered a weekly inducement, adding confluence for a potential bullish move. Until then, it remains just a weekly low without significant structure.
Daily Timeframe:
On the daily chart, price action remains indecisive, with no valid break of structure to confirm an upward trend continuation. However, there is a key support zone between 40,800 and 40,660, which aligns with a confluence of a daily trendline—potentially forming a buy zone, but only upon confirmation on lower timeframes.
Interestingly, the price has ranged between the same levels during the periods from March 13 to March 27 and from April 1 to May 20, reinforcing the range-bound nature of the market.
Outlook:
Given the lack of clear directional bias, scalping opportunities may be more appropriate in the upcoming week, especially if the market continues to range. A strong breakout and close above 43,150 could signal a bullish continuation, in which case we would look for a pullback and hold of long positions, targeting the 44,500 level.
US30 Trading Plan – Bearish Outlook Following Support BreakThe US30 (Dow Jones Industrial Average) is currently exhibiting a bearish trend, having recently broken below a key support level. This breakdown signals potential further downside momentum, indicating a shift in market sentiment from bullish to bearish.
Technical Analysis Summary:
Trend: Bearish
Breakdown Confirmation: Price has closed below the previous support level, confirming a breakdown and potential trend continuation.
Entry Signal: Entry positions can be considered on a retest of the broken support level, now acting as resistance, or upon confirmation of continued selling pressure.
Profit Targets:
Target 1: The first profit target is set at the next significant support zone, which has historically acted as a demand area.
Target 2: The second profit target is located at a lower, more established support level, providing a deeper downside opportunity if bearish momentum persists.
Risk Management:
Stop-Loss: A stop-loss should be placed above the newly formed resistance level (formerly support) to protect against false breakouts and trend reversals.
Position Sizing: Risk no more than 1–2% of account equity per trade to maintain proper risk management.
Trade Rationale:
The breakdown of the support level on US30 suggests increased selling pressure and the potential for a continuation of the downward trend. By identifying two profit targets, this plan allows for partial profit-taking at the first support level and full exit or trailing stop at the second, depending on price action and market conditions.
WHY I THINK US30 WILL BUY INSTEAD OF SELL🔥 Bias: Bullish continuation
🕒 Timeframe: 60-minute
💎 Instrument: US30 (Dow Jones)
1️⃣ Volume Profile Context
POC (Fair Value): ~41,680
HVN (Acceptance): 41,660–41,700
LVN (Balance Break): 41,540–41,600
2️⃣ Footprint Signals
Seller Imbalances in the 13:00 & 14:00 candles (Δ–159 @ 9.13K & Δ–121 @ 7.97K)
– Price didn’t drop, closed near highs → Supply absorbed
Absorption above 41,700 shows hidden bid
3️⃣ Structure & Key Zones
Higher highs & higher lows intact since the 07:00–08:00 low.
Buy zone / demand: 41,400–41,500 (strong initiative buying & positive deltas)
Support to hold: 41,660–41,680 (POC / HVN)
▶️ Trade Plan
Entry: On pullback to 41,660–41,680 (POC support)
Stop: Below 41,640 (below LVN)
Target 1: 41,880 (previous high & volume shelf)
Target 2: 41,920+ (upper HVN rejection zone)
✅ Confirmation: Look for bullish footprint bars (positive delta, absorption of sellers) at entry zone.
Dow Jonas - Elliot wave📉 DJI — Elliott Wave Top in Sight?
🔍 A long-term analysis with serious implications...
I've been diving deep into the Dow Jones Industrial Average (DJI), using Elliott Wave principles — and what I see may signal the end of one of the longest bull markets in history.
Elliott was right — the massive bull cycle did arrive and extended well into the 2000s. But now, that journey looks to be nearing its final destination.
Currently, I believe we're witnessing the development of an Ending Diagonal pattern — a structure often seen at the end of a major impulse. This formation appears to be completing a set of blue sub-waves, which in turn cap off the larger green primary impulse wave.
📍 The box marks my anticipated top for the DJI. From this point, I expect a strong reversal and the beginning of a major correction.
Now here's the shocking part:
If this correction plays out in time and reaches the Fibonacci 0.382 level, that would suggest a retracement spanning up to 86 years — yes, 86 years.
This isn’t just about markets anymore — such a scenario could carry massive consequences for the global economy and society as a whole.
If, however, we see a strong breakout above the box, then the ending diagonal thesis would be invalidated, and we might instead be witnessing an extended wave 5 — complete with five internal sub-waves.
But either way — the top is coming. It’s just a matter of when, and how hard we fall.
💬 What are your thoughts? Could we really be on the edge of a generational peak?
US30 BULLISH BIAS RIGHT NOW| LONG
US30 SIGNAL
Trade Direction: long
Entry Level: 41,822.1
Target Level: 42,718.6
Stop Loss: 41,224.4
RISK PROFILE
Risk level: medium
Suggested risk: 1%
Timeframe: 9h
Disclosure: I am part of Trade Nation's Influencer program and receive a monthly fee for using their TradingView charts in my analysis.
✅LIKE AND COMMENT MY IDEAS✅