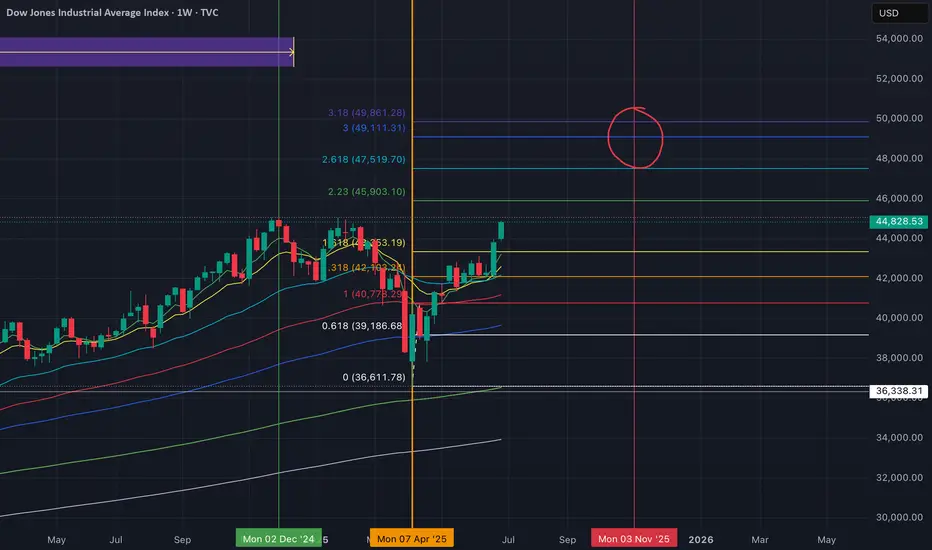
Dow Jones approaches 45kThe Dow Jones has extended its recovery to 44,800, just shy of its 45,000 record high reached in January. The RSI is tipping into overbought territory, so some consolidation could be on the cards. Buyers will look to extend the bullish run above 45,0000 to fresh record highs. Meanwhile, immediate support is at 44,500. Below here, 44,000 could offer some support. It would take a drop below 42,900 to negate the near-term bull trend.
FC
DJI trade ideas

DOW Jones go upCMCMARKETS:US30
Reaching the price level of 45,082.74 is inevitable. From the current closing price, there is a high probability of continuation toward the ATH.
However, the price levels 44,440 and 44,344.95 are also acceptable zones from which the move toward 45,082.74 may begin.
At the start of the upcoming week, as soon as the market opens, we are likely to move toward the ATH from one of these three levels.

DJIDou John's in a bit to a new one in a while but it is still in bed now but it is not going in to it I can but it's a new day in a while so it will work but it's still available I will work with a new day USA and then we will go with
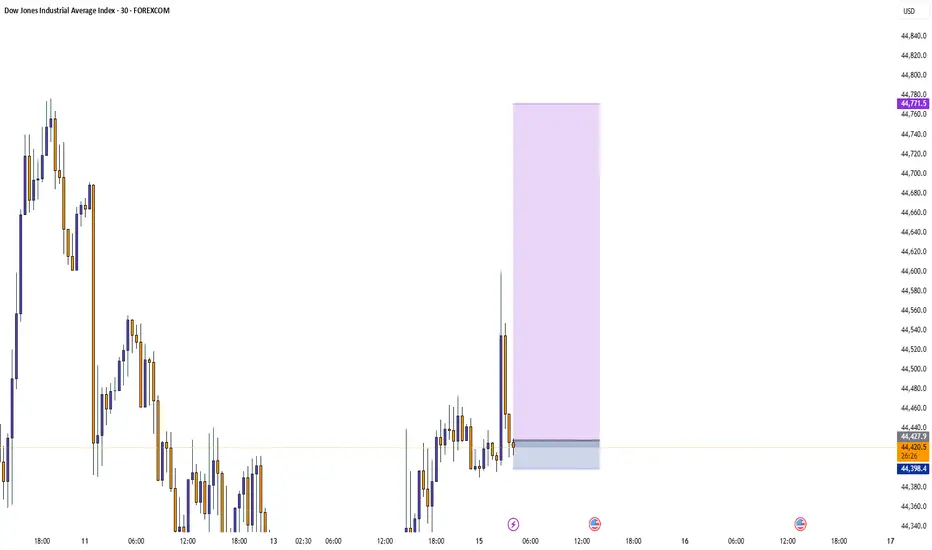
US30: Move Up Expected! Long!
My dear friends,
Today we will analyse US30 together☺️
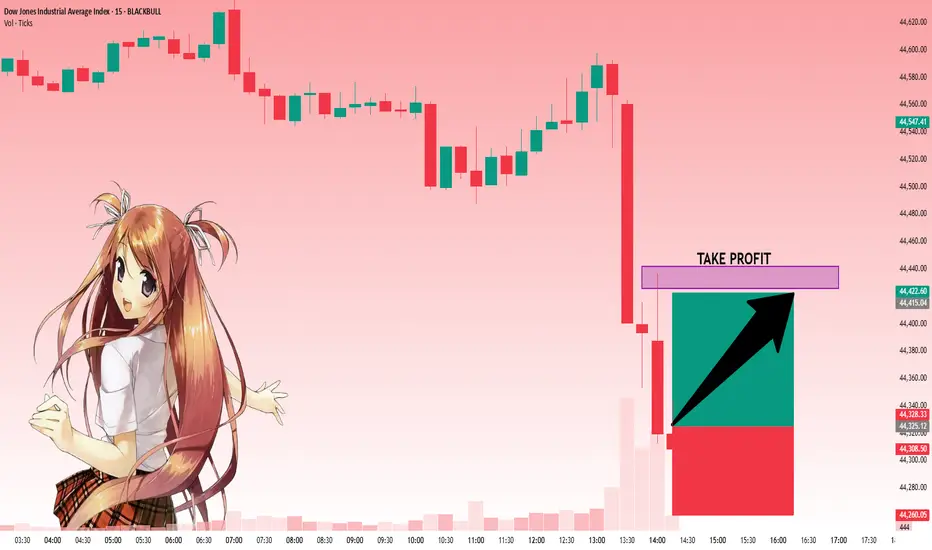
The price is near a wide key level
and the pair is approaching a significant decision level of 44,325.14 Therefore, a strong bullish reaction here could determine the next move up.We will watch for a confirmation candle, and then target the next key level of 44,425.56.Recommend Stop-loss is beyond the current level.
❤️Sending you lots of Love and Hugs❤️
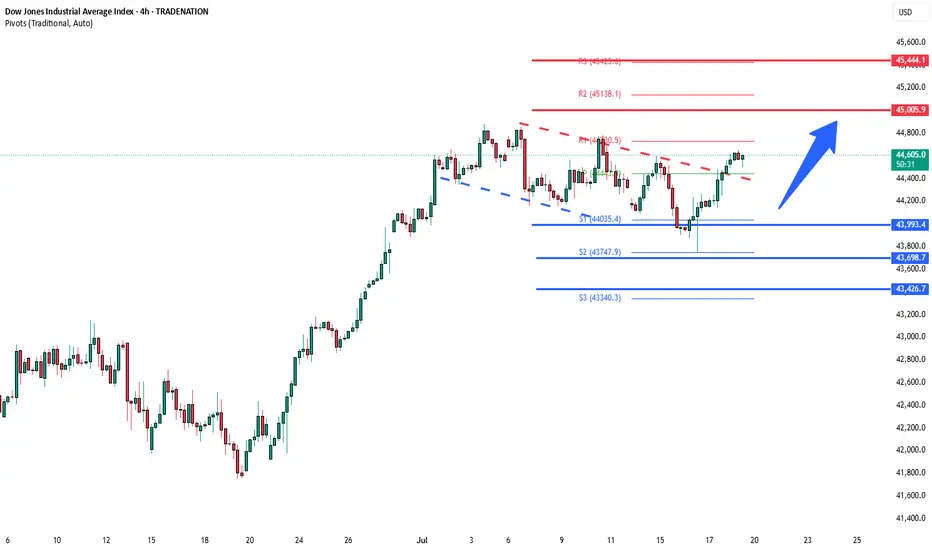
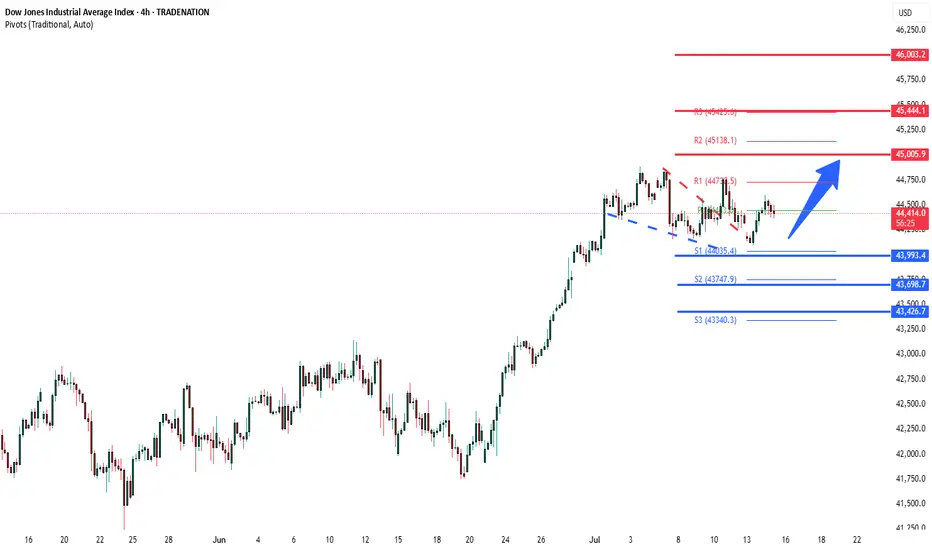
DowJones bullish continuation breakout support at 43990Key Support and Resistance Levels
Resistance Level 1: 45000
Resistance Level 2: 45440
Resistance Level 3: 46000
Support Level 1: 43990
Support Level 2: 43700
Support Level 3: 43420
This communication is for informational purposes only and should not be viewed as any form of recommendation as to a particular course of action or as investment advice. It is not intended as an offer or solicitation for the purchase or sale of any financial instrument or as an official confirmation of any transaction. Opinions, estimates and assumptions expressed herein are made as of the date of this communication and are subject to change without notice. This communication has been prepared based upon information, including market prices, data and other information, believed to be reliable; however, Trade Nation does not warrant its completeness or accuracy. All market prices and market data contained in or attached to this communication are indicative and subject to change without notice.
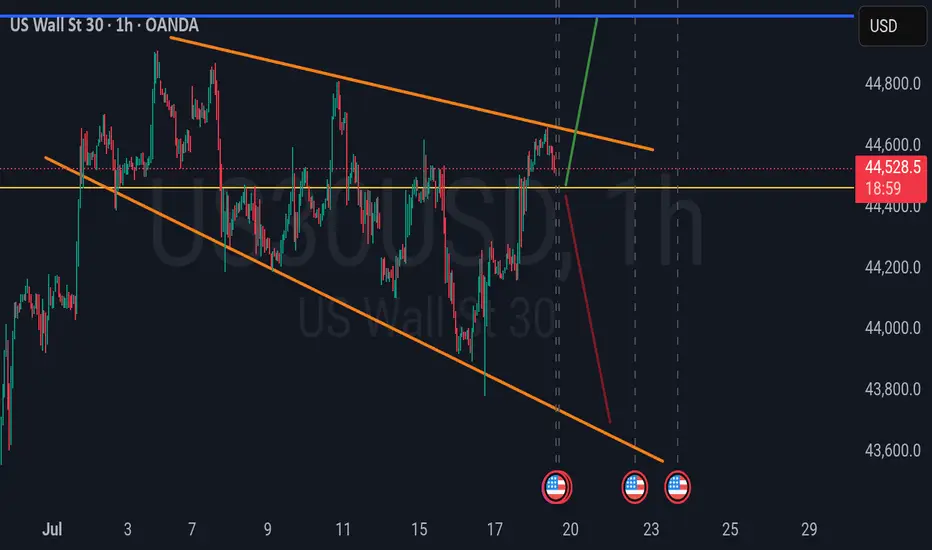
US30 UNCERTAINTY We could see a possible bounce on 4465. or price could break below and target 43700
US30 Update – 07/18/2025📍 US30 Update – 07/18/2025
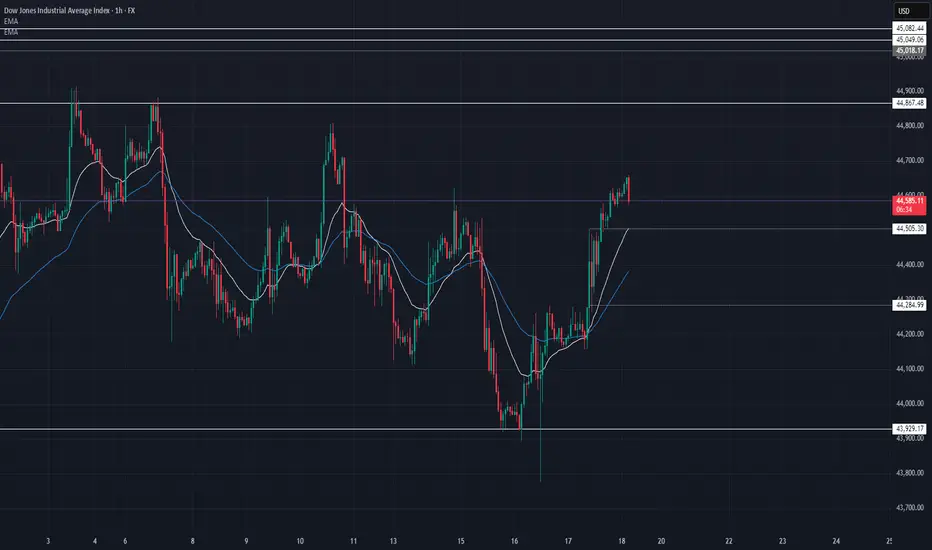
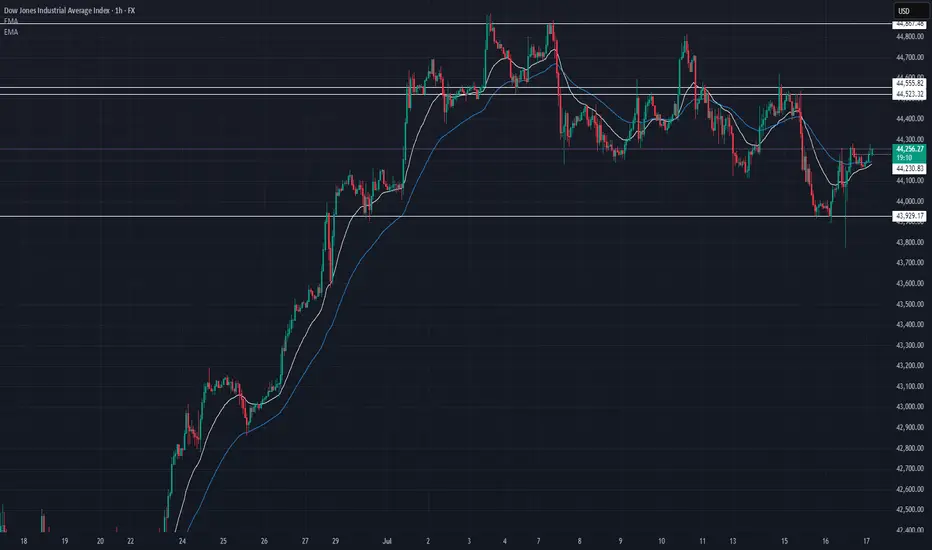
Massive recovery off 43,929 👀
US30 has broken above the 44,500 resistance and is holding strong around 44,590. The EMAs are now sloping bullish on the 1H — this is the first solid bullish structure since the early July top.
If buyers hold above 44,500, we could see a run to retest 44,867, the local high.
📊 Market Structure:
🔄 Bear trend possibly shifting → early signs of reversal
📈 Higher lows forming — EMAs crossed bullish
🔼 Break of 44,505 confirmed strength
🧭 Eyes now on 44,700–44,867 zone
🔑 Key Levels:
🔼 Resistance: 44,700 → 44,867
🔽 Support: 44,505 → 44,285 → 43,929
🧠 Market Bias:
Short-term bullish — but buyers must defend 44,500.
A drop below 44,285 would invalidate this move.
💡 Trade Ideas:
🔼 Long Setup – Continuation:
Entry: Pullback to 44,505–44,530
TP1: 44,700
TP2: 44,850
SL: Below 44,450
🔻 Short Setup – Fade Rejection:
Entry: Rejection at 44,700–44,850
TP1: 44,500
TP2: 44,300
SL: Above 44,900
⚠️ Patience — wait for clean retests or candle rejections at key levels. No need to force entries.
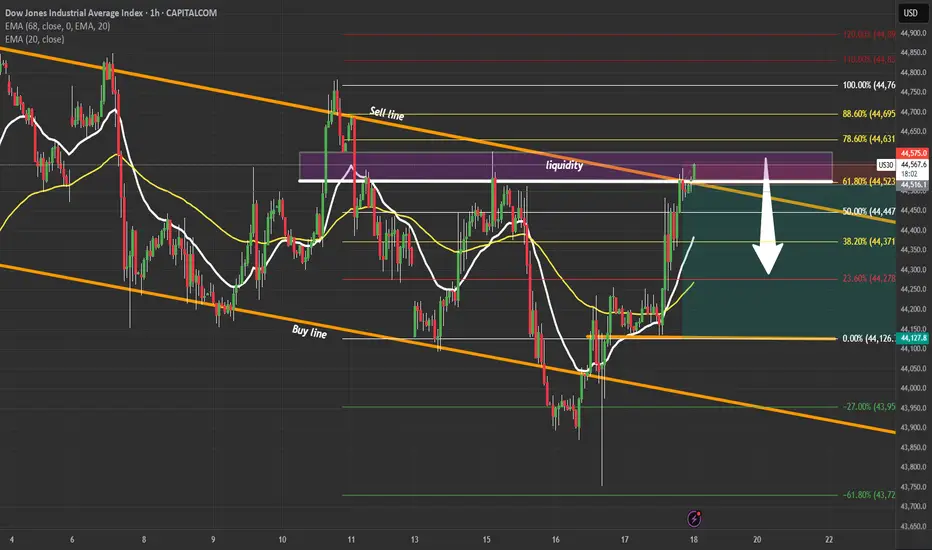
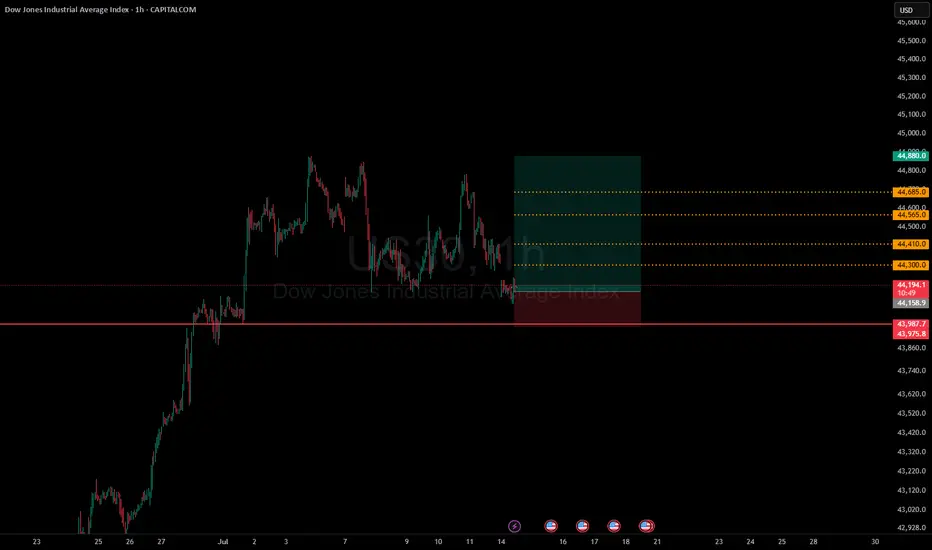
US30 High-Probability Short SetupUS30 | Liquidity Grab at 61.8% Fib 🔍
Price tapped a major liquidity zone inside the descending channel near the 61.8% Fibonacci level.
Plan: Waiting for confirmation to short toward 44,150.
Breakout or rejection? Drop your thoughts below!
Part 2 Overview of Market Week 13-19Thanks for tuning in guys, giving my knowledge to you guys free cause. AU,UJ,EU market overview mixing in a lot of fundamental confirmation.

Sonarlab Sessions: The Best Indicator!!Sonarlab Sessions allows you to edit and craft the different sessions on your chart. Using this tool and indicator allows you to decide what time you would like to get into the market. This allows to frame set ups and rules around that specific session.

Bulls Steady Ahead of Key Earnings and Economic DataU.S. equities are holding steady in what has been a week of conflicting signals. President Trump’s aggressive stance on trade, including potential 30% tariffs on EU and Mexican goods, has shaken market sentiment, but his public commitment to retain Jerome Powell as Fed Chair brought some temporary relief. That stability, at least for now, is helping underpin stock indices.
Focus has now turned to corporate earnings, with key players like TSMC and Netflix reporting shortly. These names could set the tone for the broader Q2 earnings season. At the same time, traders are closely monitoring incoming U.S. data — including retail sales and jobless claims — to gauge the health of the consumer and labor market. The combination of strong earnings and resilient macro data could provide the momentum
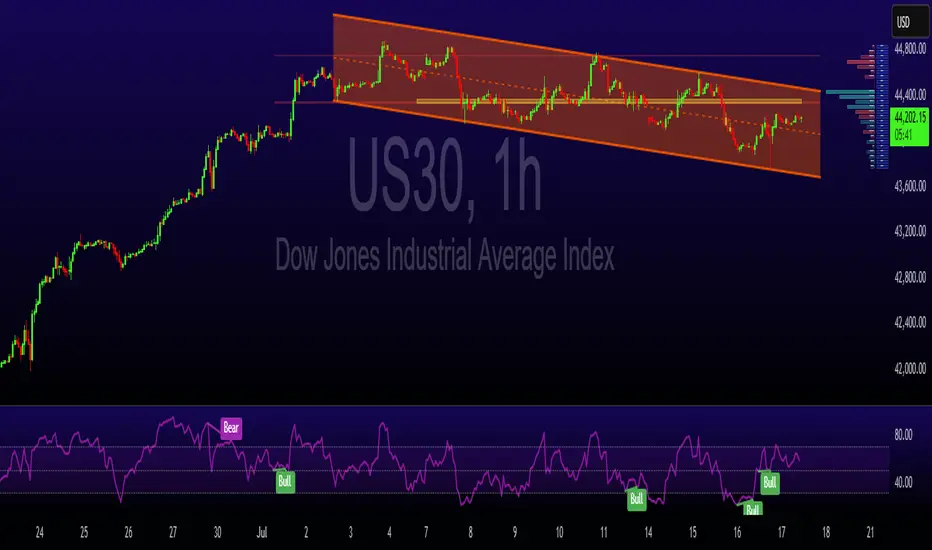
Technical Structure:
• Resistance: 44,350 — a potential breakout point
• Support: 44,000 and 43,800
• Pattern: The index is trading within a descending channel, but recent strength suggests a breakout may be developing.
• Upside potential: If earnings and macro data support risk appetite, a breakout toward 44,800 becomes plausible.
Takeaway: Sentiment remains fragile but stable. Traders should keep a close eye on both corporate results and macro data releases for direction cues.
The trend has decreasedAt the moment, the trend has decreased, it will probably fall to the bottom of the pivot daily, and then it will rise and continue to fall to the bottom of the pivot for the first week
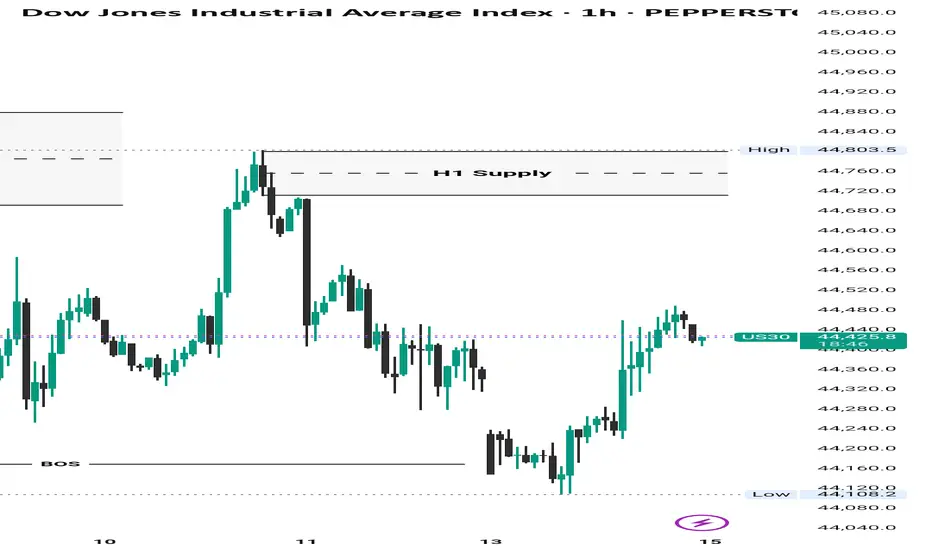
DOW JONES 1H ANALYSIS – JULY 17, 2025📉 DOW JONES 1H ANALYSIS – JULY 17, 2025
🔎 Tracking structure | key levels | trade ideas
🔹 Current Price: 44,248
📆 Timeframe: 1H
📈 Bias: Neutral → Short-term bullish ✅
📌 MARKET STRUCTURE UPDATE:
Price held strong at 43,929 – key support from earlier July lows 🔁
After a deep pullback from 44,800s, we’re seeing a bounce with price reclaiming the 21 & 50 EMA 🧠
This signals short-term buyer momentum stepping in – but caution: we’re still trading below key resistance 👀
🔹 KEY LEVELS TO WATCH:
Support:
🟢 43,929 → major bounce zone (held)
🟢 44,182 → short-term EMA support
Resistance:
🔴 44,523 → former support, now flipped resistance
🔴 44,555 → breakdown origin
🔴 44,857 → major supply zone top
💡 TRADE SCENARIOS:
🔼 Bullish Case:
If price holds above 44,200 and pushes through 44,523–44,555, we likely see 44,700+ retest 🔥
A breakout + hold above 44,555 = trend shift confirmed 📈
🔽 Bearish Case:
If rejection at 44,523/555 holds, watch for rotation back to 44,000 → 43,929
Below 43,929 = possible slide to 43,700–43,600 demand 🚨
US30 in the US stock market will also set a new highUS30 in the US stock market will also set a new high
He is a little slower but will reach the goal

DowJones bullish continuation breakout supported at 43990Key Support and Resistance Levels
Resistance Level 1: 45000
Resistance Level 2: 45440
Resistance Level 3: 46000
Support Level 1: 43990
Support Level 2: 43700
Support Level 3: 43420
This communication is for informational purposes only and should not be viewed as any form of recommendation as to a particular course of action or as investment advice. It is not intended as an offer or solicitation for the purchase or sale of any financial instrument or as an official confirmation of any transaction. Opinions, estimates and assumptions expressed herein are made as of the date of this communication and are subject to change without notice. This communication has been prepared based upon information, including market prices, data and other information, believed to be reliable; however, Trade Nation does not warrant its completeness or accuracy. All market prices and market data contained in or attached to this communication are indicative and subject to change without notice.
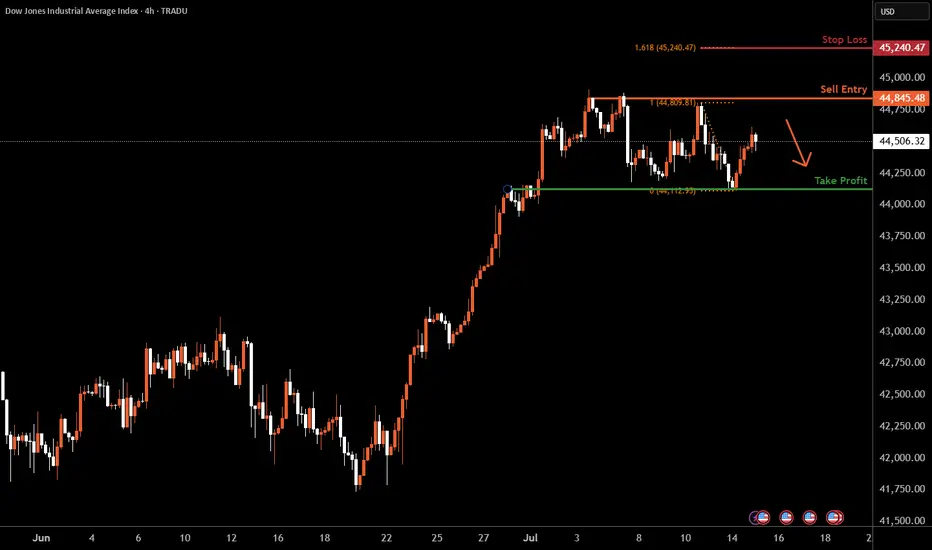
Dow Jones H4 | Rising into a multi-swing-high resistanceThe Dow Jones (US30) is rising towards a multi-swing-high resistance and could potentially reverse off this level to drop lower.
Sell entry is at 44,845.48 which is a multi-swing-high resistance.
Stop loss is at 45,240.47 which is a level that aligns with the 127.2% Fibonacci extension.
Take profit is at 44,124.85 which is an overlap support.
High Risk Investment Warning
Trading Forex/CFDs on margin carries a high level of risk and may not be suitable for all investors. Leverage can work against you.
Stratos Markets Limited (tradu.com ):
CFDs are complex instruments and come with a high risk of losing money rapidly due to leverage. 63% of retail investor accounts lose money when trading CFDs with this provider. You should consider whether you understand how CFDs work and whether you can afford to take the high risk of losing your money.
Stratos Europe Ltd (tradu.com ):
CFDs are complex instruments and come with a high risk of losing money rapidly due to leverage. 63% of retail investor accounts lose money when trading CFDs with this provider. You should consider whether you understand how CFDs work and whether you can afford to take the high risk of losing your money.
Stratos Global LLC (tradu.com ):
Losses can exceed deposits.
Please be advised that the information presented on TradingView is provided to Tradu (‘Company’, ‘we’) by a third-party provider (‘TFA Global Pte Ltd’). Please be reminded that you are solely responsible for the trading decisions on your account. There is a very high degree of risk involved in trading. Any information and/or content is intended entirely for research, educational and informational purposes only and does not constitute investment or consultation advice or investment strategy. The information is not tailored to the investment needs of any specific person and therefore does not involve a consideration of any of the investment objectives, financial situation or needs of any viewer that may receive it. Kindly also note that past performance is not a reliable indicator of future results. Actual results may differ materially from those anticipated in forward-looking or past performance statements. We assume no liability as to the accuracy or completeness of any of the information and/or content provided herein and the Company cannot be held responsible for any omission, mistake nor for any loss or damage including without limitation to any loss of profit which may arise from reliance on any information supplied by TFA Global Pte Ltd.
The speaker(s) is neither an employee, agent nor representative of Tradu and is therefore acting independently. The opinions given are their own, constitute general market commentary, and do not constitute the opinion or advice of Tradu or any form of personal or investment advice. Tradu neither endorses nor guarantees offerings of third-party speakers, nor is Tradu responsible for the content, veracity or opinions of third-party speakers, presenters or participants.
BUYTrend Line Break
Previous Day Volume
Rejection Point
Untapped Order Point
Asian Session
High Structure Swing
US30 SELLWe've seen a shift on the H4
Confirmation for a swing sell
Proper risk management is advised
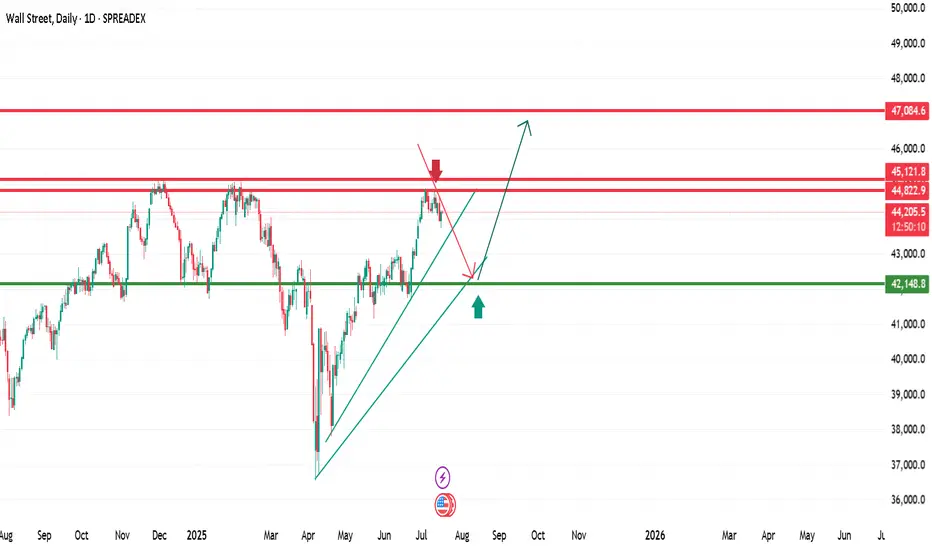
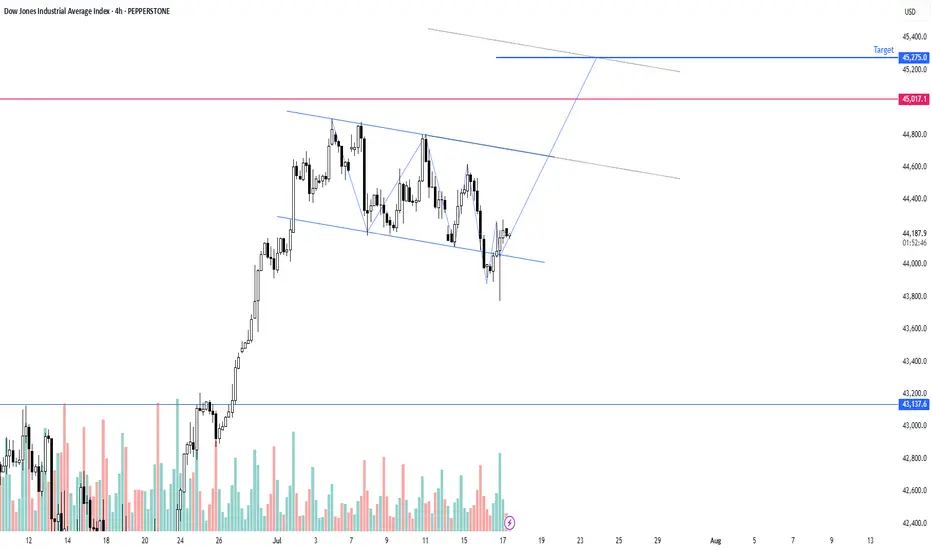
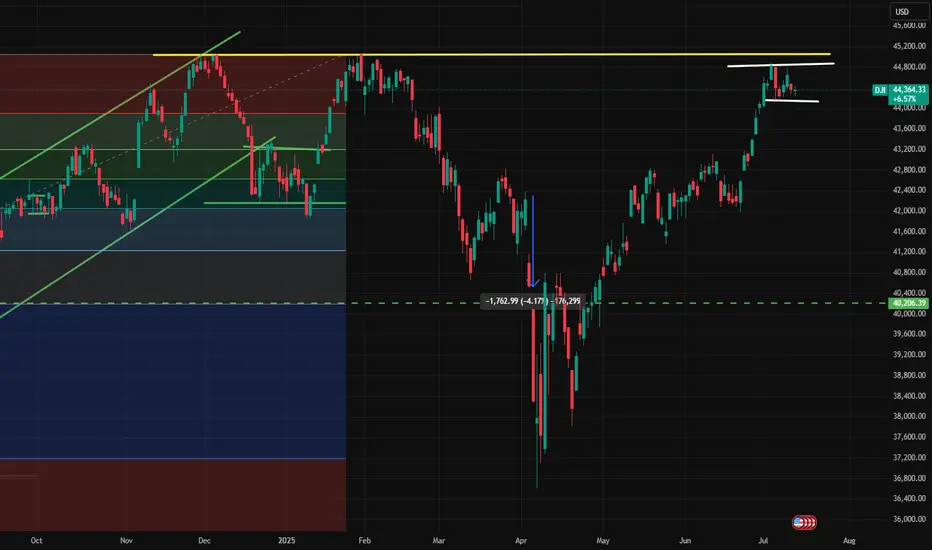
Dow Jones Technical Outlook – July 2025The Dow Jones is currently trading in a tight consolidation range just below its major resistance zone near 45,200.
After a strong bullish rally, the index is showing signs of exhaustion with lower volatility and sideways price action — forming a potential rectangle pattern. This type of structure typically signals a continuation or reversal, depending on the breakout direction.
📌 Key Levels to Watch:
Resistance: 45,200 – A breakout above this level may trigger a strong upside rally toward
Support: 44,050 – A breakdown below this can open the door for a retest of 43,200 or even 42,000.
Price is coiling — the market is waiting. The next breakout could set the tone for weeks to come.
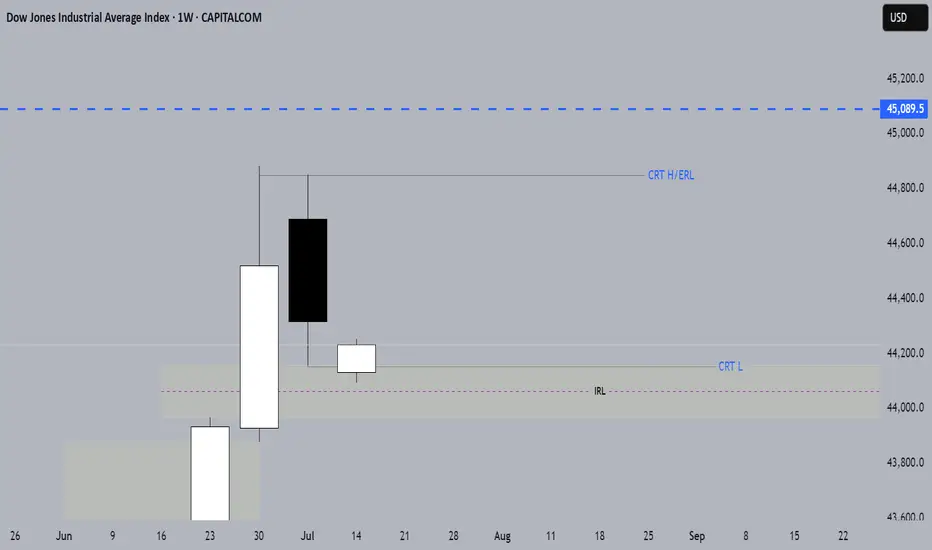
US30 BULLISH/ CRT, ERL&IRL CONFIRMATIONUS30 TO 45089.5
July is historically one of the Dow’s best-performing months.
WEEKLY CRT
IRL TO ERL
BUYTrend Line Break
Previous Day Volume
Rejection Point
Untapped Order Point
London Session
High Structure Swing
