Dollar I Weekly CLS I Model 2 I Ready for pullbackYo Market Warriors ⚔️
Fresh outlook drop — if you’ve been riding with me, you already know:
🎯My system is 100% mechanical. No emotions. No trend lines. No subjective guessing. Just precision, structure, and sniper entries.
🧠 What’s CLS?
It’s the real smart money. The invisible hand behind $7T/d
About U.S. Dollar Index
The U.S. Dollar Index tracks the strength of the dollar against a basket of major currencies. DXY was originally developed by the U.S. Federal Reserve in 1973 to provide an external bilateral trade-weighted average value of the U.S. dollar against global currencies. U.S. Dollar Index goes up when the U.S. dollar gains "strength" (value), compared to other currencies. The following six currencies are used to calculate the index:
Euro (EUR) 57.6% weight
Japanese yen (JPY) 13.6% weight
Pound sterling (GBP) 11.9% weight
Canadian dollar (CAD) 9.1% weight
Swedish krona (SEK) 4.2% weight
Swiss franc (CHF) 3.6% weight
Euro (EUR) 57.6% weight
Japanese yen (JPY) 13.6% weight
Pound sterling (GBP) 11.9% weight
Canadian dollar (CAD) 9.1% weight
Swedish krona (SEK) 4.2% weight
Swiss franc (CHF) 3.6% weight
Related indices

USD Is Still Bullish! Wait For Buys!Welcome back to the Weekly Forex Forecast for the week of July 21-25th.
In this video, we will analyze the following FX market:
USD
The DXY has run bullish last week, up into an area of Supply, where the momentum hesitates now. Next week may pull back a bit... before continuing higher to the buy

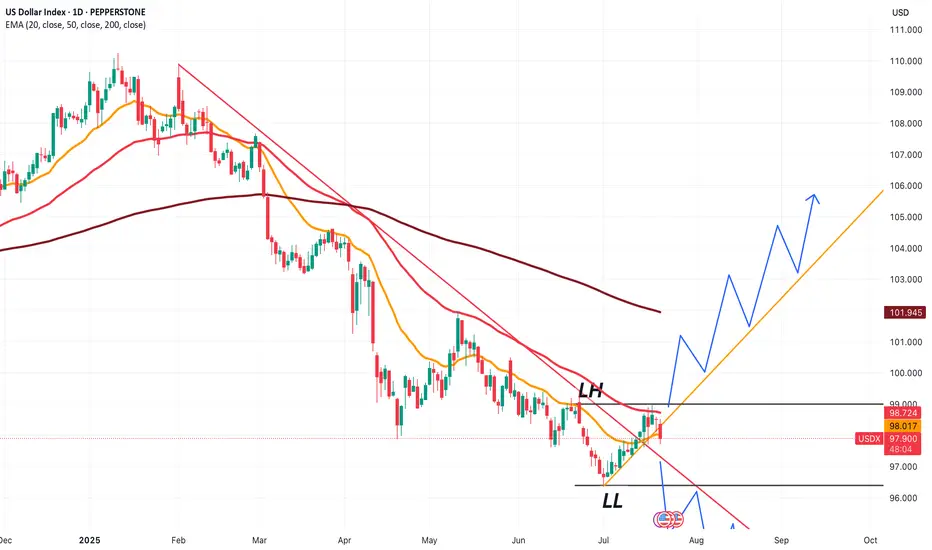
USDX at a crucial price point, which will decide trendThe next few candles for USDX price will be extremely important to understand where the dollar index is headed.
Based on that, we'll be able to choose 'which' Forex pairs we can trade, and more importantly 'how' we can trade them.
If price starts to follow the green line, and takes out 99.000, we'
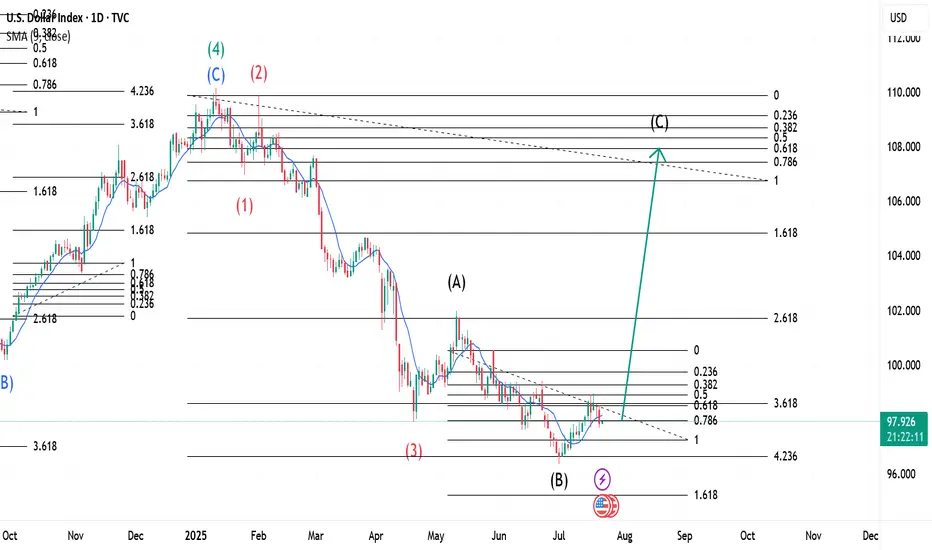
The $ Index ~ Elliott Wave Theory in real time.This is an update of a previously uploaded Dollar index Chart. Analysis remains the same and a confirmation at its current location would trigger continuation of the upward move as analysed on the first chart I had posted. Theoretically, the pullback on Monday, 21st July 2025 could be our Wave 2 wit
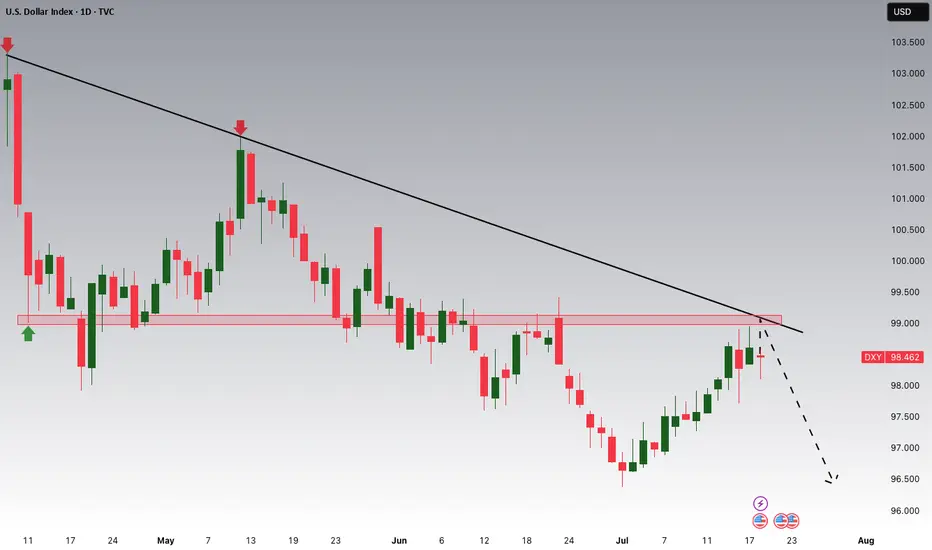
DXY Potential DownsidesHey Traders, in the coming week we are monitoring DXY for a selling opportunity around 99.000 zone, DXY is trading in a downtrend and currently is in a correction phase in which it is approaching the trend at 99.000 support and resistance area.
Trade safe, Joe.
DXYThe latest COT data shows net short positions increasing on the U.S. Dollar, indicating a bearish sentiment from institutional traders. A rising short bias suggests weakening confidence in the dollar’s strength across major currencies.

Dollar Index (DXY): Strong Bearish Price Action
Dollar Index broke and closed below a support line
of a bullish flag pattern on a daily.
Because the market is trading in a bearish trend,
this violation provides a strong bearish signal.
I expect a bearish movement to 96.75
❤️Please, support my work with like, thank you!❤️

DXY Sell breakdown from bullish trend selling pressure 📊DXY – US Dollar Index Analysis – 4H Timeframe
The US Dollar Index has broken its bullish trend with a strong bearish candle, signaling a possible shift in momentum to the downside
📍 Sell Position Active:
Entry taken at 98.000 following the trendline break and bearish confirmation candle
🎯 Tech

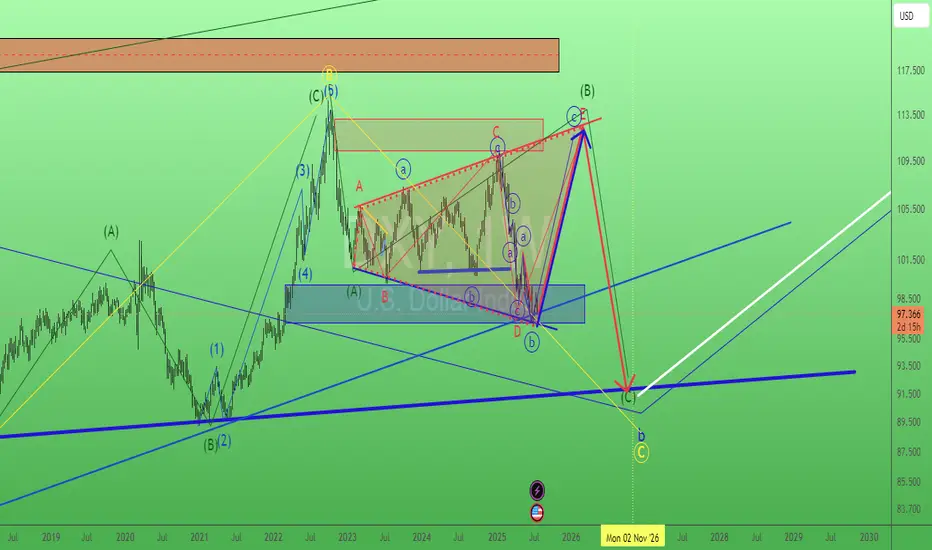
Dollar. When King of cash said : I'm still the king. 23/July/25DXY. when Dollar = the king of cash said : "Cash is King!" AND as a King of cash I'm RECLAIMING MY CROWN.. What will happen to "all equities market? e.g Stocks, Gold or even Bitcoin?
Why a USD Bounce Could Trigger a Stock PullbackThe US Dollar has faced brutal selling during the first half of 2025. Some are even questioning whether the Dollar’s global hegemony is at risk. Early in the year the US stock market AMEX:SPY sold off aggressively, falling 19% from mid‑March to early April. Since then stocks have more than regaine

See all ideas
Summarizing what the indicators are suggesting.
Oscillators
Neutral
SellBuy
Strong sellStrong buy
Strong sellSellNeutralBuyStrong buy
Oscillators
Neutral
SellBuy
Strong sellStrong buy
Strong sellSellNeutralBuyStrong buy
Summary
Neutral
SellBuy
Strong sellStrong buy
Strong sellSellNeutralBuyStrong buy
Summary
Neutral
SellBuy
Strong sellStrong buy
Strong sellSellNeutralBuyStrong buy
Summary
Neutral
SellBuy
Strong sellStrong buy
Strong sellSellNeutralBuyStrong buy
Moving Averages
Neutral
SellBuy
Strong sellStrong buy
Strong sellSellNeutralBuyStrong buy
Moving Averages
Neutral
SellBuy
Strong sellStrong buy
Strong sellSellNeutralBuyStrong buy
Displays a symbol's price movements over previous years to identify recurring trends.
Frequently Asked Questions
The current value of U.S. Dollar Index is 97.673 USD — it has risen by 0.16% in the past 24 hours. Track the index more closely on the U.S. Dollar Index chart.
U.S. Dollar Index reached its highest quote on Feb 25, 1985 — 164.720 USD. See more data on the U.S. Dollar Index chart.
The lowest ever quote of U.S. Dollar Index is 70.698 USD. It was reached on Mar 17, 2008. See more data on the U.S. Dollar Index chart.
U.S. Dollar Index value has decreased by −0.83% in the past week, since last month it has shown a 0.13% increase, and over the year it's decreased by −6.40%. Keep track of all changes on the U.S. Dollar Index chart.
U.S. Dollar Index is just a number that lets you track performance of the instruments comprising the index, so you can't invest in it directly. But you can buy U.S. Dollar Index futures or funds or invest in its components.