USDX-NEUTRAL SEL strategy 3 hourly chartThe market is still showing tug-of-war attitude, and the index is under selling pressure. The 100.00 area is key to survival short term.
The indicators show negativity right now, and it feels we may see low 99.00s.
Strategy SELL @ 100.10-100.40 area and take profit near 99.17 for now.
DXY trade ideas

DOLLARThe relationship between the U.S. dollar and U.S. Treasury bond yields in May 2025 reflects a complex and evolving dynamic influenced by fiscal concerns, trade policies, and investor sentiment:
Recent Trends:
U.S. Treasury yields have risen, with the 30-year yield briefly touching 5%, and the 10-year yield climbing above 4.5%, driven by concerns over rising U.S. debt and fiscal deficits following Moody’s downgrade of the U.S. sovereign credit rating. Despite this rise in yields, the U.S. Dollar Index has weakened, dropping about 4% year-over-year, reflecting reduced confidence in the dollar as the world’s reserve currency.
Typical Relationship:
Normally, higher Treasury yields attract foreign capital seeking better returns, which supports a stronger dollar. The dollar and bond yields often move in tandem, showing a positive correlation (around 0.5 over recent months). This was evident recently as the dollar strengthened alongside rising yields following a preliminary U.S.-China trade truce.
Current Anomalies:
However, in early 2025, this relationship weakened significantly. The dollar declined even as Treasury yields rose, signaling a loss of confidence in U.S. assets amid escalating trade tensions and concerns about the sustainability of U.S. fiscal policy. This decoupling suggests investors are reconsidering the dollar’s role and are diversifying away from U.S. assets.
Market Sentiment and Risks:
The downgrade and rising deficits have increased fears about U.S. fiscal health, prompting some investors to sell U.S. assets, which pressures the dollar despite higher yields. Meanwhile, tariff policies and geopolitical risks contribute to volatility in both yields and the dollar.
Outlook:
The dollar and Treasury yields have recently realigned, moving more in sync again as trade optimism returned and the Fed maintained a steady policy stance. However, ongoing fiscal challenges and geopolitical uncertainties mean this relationship remains fragile.
Summary
Aspect Current Observation (May 2025)
Treasury Yields Rising (10-year ~4.5%, 30-year ~5%)
U.S. Dollar Index Weakened (~4% decline YTD)
Typical Correlation Positive (~0.5 correlation between dollar and yields)
Recent Anomaly Dollar fell while yields rose (early 2025)
Drivers of Anomaly Fiscal concerns, Moody’s downgrade, trade tensions
Market Sentiment Reduced confidence in U.S. assets and dollar
Outlook Re-alignment underway but fragile due to fiscal risks
In essence:
While U.S. Treasury yields and the dollar usually move together—higher yields supporting a stronger dollar—recent fiscal concerns and geopolitical tensions have caused periods of divergence. Rising yields amid a weakening dollar reflect investor worries about U.S. debt sustainability and a potential shift away from the dollar’s reserve currency status. However, improving trade relations and Fed communication have recently brought the two back into closer alignment, though the relationship remains sensitive to evolving economic and political developments.

MY SENTIMENTS ON THE DOLLAR FOR THE WEEKThe U.S. Dollar may find resistance around the 100.685 level, where it could fill the buy-side imbalance and react to the nearby bearish order block. If this level holds, we could see a continued decline throughout the week toward the psychological 100.00 level. Conversely, this would likely translate into a bullish move for the EUR/USD, reflecting the inverse correlation.

US Dollar Index Stock Chart Fibonacci Analysis 051925Trading Idea
1) Find a FIBO slingshot
2) Check FIBO 61.80% level
3) Entry Point > 100/61.80%
Chart time frame:B
A) 15 min(1W-3M)
B) 1 hr(3M-6M)
C) 4 hr(6M-1year)
D) 1 day(1-3years)
Stock progress: B
A) Keep rising over 61.80% resistance
B) 61.80% resistance
C) 61.80% support
D) Hit the bottom
E) Hit the top
Stocks rise as they rise from support and fall from resistance. Our goal is to find a low support point and enter. It can be referred to as buying at the pullback point. The pullback point can be found with a Fibonacci extension of 61.80%. This is a step to find entry level. 1) Find a triangle (Fibonacci Speed Fan Line) that connects the high (resistance) and low (support) points of the stock in progress, where it is continuously expressed as a Slingshot, 2) and create a Fibonacci extension level for the first rising wave from the start point of slingshot pattern.
When the current price goes over 61.80% level , that can be a good entry point, especially if the SMA 100 and 200 curves are gathered together at 61.80%, it is a very good entry point.
As a great help, tradingview provides these Fibonacci speed fan lines and extension levels with ease. So if you use the Fibonacci fan line, the extension level, and the SMA 100/200 curve well, you can find an entry point for the stock market. At least you have to enter at this low point to avoid trading failure, and if you are skilled at entering this low point, with fibonacci6180 technique, your reading skill to chart will be greatly improved.
If you want to do day trading, please set the time frame to 5 minutes or 15 minutes, and you will see many of the low point of rising stocks.
If want to prefer long term range trading, you can set the time frame to 1 hr or 1 day.

DXY Support at $100? (61.8 Fib) The USD touched down on the all-important $100 price level after a strong rally in the stock market.
This level coincides with a 61.8 fib retracement level.
Slight bounce, but what happens next is everything.
See the trend line below for possible next support if we break below the 61.8.

DXY May 20 IdeaDXY
May 20
Parent range discount
Previous range discount
Parent sentiment Bullish
May 19 Delivery
*Sunday's delivery we gap open sending price lower from premium to a discount.
*Asia opened and expanded lower and then consolidated
*London price rallied to take equal lows, inefficient delivered prices, stopping within pips of May 8 lows.
*NY retraced 50% of the run closing in a consolidation.
Did we make the low of the week?
Was this a run on sell stops cause this pair is bull bias?
May 20 Idea
Logic says price cleared out sell side liquidity, it should gravitate to inefficient delivered price from yesterdays delivery, it is in a double discount, I suspect today could be a buy day.
Considerations
1 huge range could see price in consolidation day, choppy price action, yuck
2 no news can sometimes be days where you can get chopped up too
Stay sharp read what the chart is giving to me
NO NEWS M/T/W

Bullish bounce?US Dollar Index (DXY) is reacting off the pivot and could bounce to the 1st resistance.
Pivot: 100.21
1st Support: 99.45
1st Resistance: 101.88
Risk Warning:
Trading Forex and CFDs carries a high level of risk to your capital and you should only trade with money you can afford to lose. Trading Forex and CFDs may not be suitable for all investors, so please ensure that you fully understand the risks involved and seek independent advice if necessary.
Disclaimer:
The above opinions given constitute general market commentary, and do not constitute the opinion or advice of IC Markets or any form of personal or investment advice.
Any opinions, news, research, analyses, prices, other information, or links to third-party sites contained on this website are provided on an "as-is" basis, are intended only to be informative, is not an advice nor a recommendation, nor research, or a record of our trading prices, or an offer of, or solicitation for a transaction in any financial instrument and thus should not be treated as such. The information provided does not involve any specific investment objectives, financial situation and needs of any specific person who may receive it. Please be aware, that past performance is not a reliable indicator of future performance and/or results. Past Performance or Forward-looking scenarios based upon the reasonable beliefs of the third-party provider are not a guarantee of future performance. Actual results may differ materially from those anticipated in forward-looking or past performance statements. IC Markets makes no representation or warranty and assumes no liability as to the accuracy or completeness of the information provided, nor any loss arising from any investment based on a recommendation, forecast or any information supplied by any third-party.

DXY: Local Bullish Bias! Long!
My dear friends,
Today we will analyse DXY together☺️
The price is near a wide key level
and the pair is approaching a significant decision level of 99.946Therefore, a strong bullish reaction here could determine the next move up.We will watch for a confirmation candle, and then target the next key level of 100.223.Recommend Stop-loss is beyond the current level.
❤️Sending you lots of Love and Hugs❤️

USD Bulls Battle at SupportThe U.S. Dollar dropped into support early in the week at 99.95-100.15- a region defined by the 50% retracement of the late-April advance, the 2023 low-day close, and the 2024 low. Note that the 100% extension of the decline rests just lower at 99.55 and losses would need to be limited to this level IF Euro is heading higher on this stretch.
Initial resistance is at with the Friday close at 100.98 with a breach / close above the September high / high-day close (HDC) at 101.77/92 needed to fuel the next leg of the advance.
-MB

DXYU.S Dollar Index
- Exp FIAT as an corrective pattern in short time frame
- Break of Structure
- RSI - Divergence
- Demand Zone
- Completed " 1234 " Impulsive Waves

DXY LONG/BUYBy utilizing Fibonacci retracement levels, historical patterns, , we can formulate a hypothesis that the market might follow a similar trajectory if bullish sentiment prevails.

Predict 3 Pairs!!!Using the Dollar Index, you can predict at least 3 different asset's direction of their price. EURUSD, AUDUSD, GBPUSD are pairs that oppose the direction of the DXY!

DXYDxy testing confluence zone, minor uptrend trendline + major downtrend trendline parallel + prior resistance
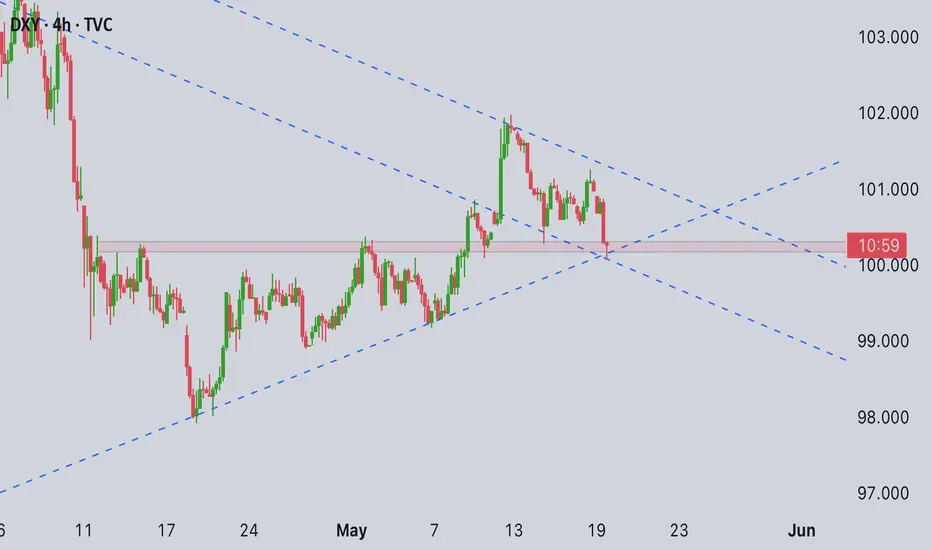
Chart spoke. We listened. See how price respected every level!"Great when BOS + supply/demand lines hit perfectly.
Most traders chased the bounce.
We waited in the shadows — right at the selling zone.
Wave 4? Textbook correction.
Wave 5? That’s where the money’s made.
Elliott Wave isn’t just theory — it’s a weapon.
Break of structure? Marked.
Zone tested? Clean.
Rejection? Savage.
This is how professionals trade — not with hope, but with precision.
DXY: playing checkers while we play chess.”**

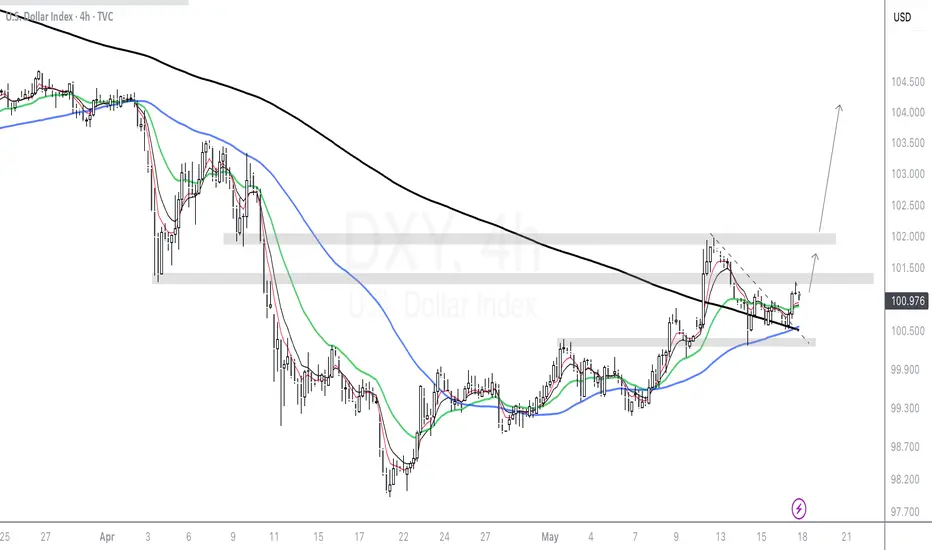
DXY Gaining strength (DXY - 18/05)Price has signalled that the bulls have paused selling. A strong breakout above resistance and triangle pattern break, we are watching for entries higher and looking for continued selling on commodities such as GOLD.
- Current price action on lower charts creating buying opportunities
- Watch 15min chart for next signal higher
- Monitor for continued strengh
USXUSD High Of The Month SetUSXUSD HOTM Set
Expansion lower expected with Previous Monthly Low as Draw on Liquidity.
OHLC Monthly Profile.

U.S. Dollar Index Set for Bearish Continuation The U.S. Dollar Index (DXY) has completed a five-wave impulse decline (labeled (1) through (5)) from the top of the descending channel. This downward move suggests a completed impulsive bearish leg. Following that, we’ve seen a complex corrective structure – a WXY double zigzag correction – now complete.
Price action shows a rejection from the upper trendline resistance near wave (2), confirming the bearish structure remains intact. The bounce into the corrective high (wave (2)) failed to break above key resistance, and we are now potentially entering a new impulsive move down labeled as wave (3) of the next larger degree impulse.
Primary Impulse Decline: Wave (1) to (5): Classic 5-wave move down ending late April.
Corrective Phase: Complex WXY correction (with subwaves A-B-C in both W and Y).
Current Wave in Play: Wave (3) of a larger impulsive sequence is initiating.
T1: 99.172
T2: 98.013
SL: 101.259
If price closes above 101.265 the current bearish impulse scenario would be invalidated.

US DOLLLAR INDEX - BY RICKO MMFXHumble greetings.
the above instrument is looking like a accumulating Bullish model, considering the recent fundamentals and catalysts behind the instrument I stalk longs in logical areas of the provided Weekly to Daily nearby structural ranges.
Should price in the 30 to 15 minute chart print out a Bullish Choch/Bullish playbook below the 4 hour internal low structure within the FVG and/or below for areas of origin I will be more confident going in for the kill.

The US Dollar – Under Selling Pressure Today💵 US Dollar Index (DXY) – Still Under Selling Pressure
📉 Current Zone: 100.29
The DXY continues its bearish momentum after failing to reclaim the technical resistance zone between 101.27 and 102.20.
🔍 Key Zone Analysis:
🔴 Technical Resistance Zone:
101.267 – 102.206 → Heavily rejected, confirming strong selling pressure.
🟢 Fundamental Support Zone:
99.447 – 99.939 → Key psychological level closely monitored by institutional players.
📊 Current Scenario:
🔻 As long as price stays below 101.26, the bearish bias remains intact.
📉 Downside target: retest of the 99.44 – 99.90 zone.
❌ Invalidation: clean break and close above 102.20.
⚠️ Events to Watch This Week:
Federal Reserve speeches
Key U.S. macro data (jobs, inflation)
The DXY remains vulnerable to any signs of rate easing or economic slowdown.
📘 Reminder: The information provided is for educational purposes only.
It does not constitute financial advice or an investment recommendation.
💬 Boost if you’re watching the DXY too! What’s your view on this support zone? 👇

DXY CorrectionMy vision where going price next week.
Question is does wave B finnish already or not.
Monday we will see about Wave B going higher or price move down to wave C.
TA show down but FA talk that dollar must rise.
Area 100.3 is trend zone
For my opinion bearish correction continue.

Check the trend The correction is expected to continue until the red support zone. Then there is a possibility of a trend change and the start of an uptrend. Otherwise, a continuation of the downtrend is likely.

Mindset Monday - Dealing With Big Losses “You can’t control if you lose — but you can control how much you lose.”
In this first episode of Mindset Mondays, we dive into the emotional and practical side of trading losses. I explore how risk management and mindset shape your long-term success, and why learning to accept and limit losses is one of the most powerful skills a trader can develop.
Whether you're dealing with a tough loss or want to build mental resilience before the next one hits, this video is for you.
🎥 Watch now and take control of what is in your control.

Bullish bounce?US Dollar Index (DXY) is falling towards the pivot and could bouce to the 1st resistance.
Pivot: 100.17
1st Support: 97.91
1st Resistance: 101.93
Risk Warning:
Trading Forex and CFDs carries a high level of risk to your capital and you should only trade with money you can afford to lose. Trading Forex and CFDs may not be suitable for all investors, so please ensure that you fully understand the risks involved and seek independent advice if necessary.
Disclaimer:
The above opinions given constitute general market commentary, and do not constitute the opinion or advice of IC Markets or any form of personal or investment advice.
Any opinions, news, research, analyses, prices, other information, or links to third-party sites contained on this website are provided on an "as-is" basis, are intended only to be informative, is not an advice nor a recommendation, nor research, or a record of our trading prices, or an offer of, or solicitation for a transaction in any financial instrument and thus should not be treated as such. The information provided does not involve any specific investment objectives, financial situation and needs of any specific person who may receive it. Please be aware, that past performance is not a reliable indicator of future performance and/or results. Past Performance or Forward-looking scenarios based upon the reasonable beliefs of the third-party provider are not a guarantee of future performance. Actual results may differ materially from those anticipated in forward-looking or past performance statements. IC Markets makes no representation or warranty and assumes no liability as to the accuracy or completeness of the information provided, nor any loss arising from any investment based on a recommendation, forecast or any information supplied by any third-party.
