My Thoughts #001Here is an idea 💡
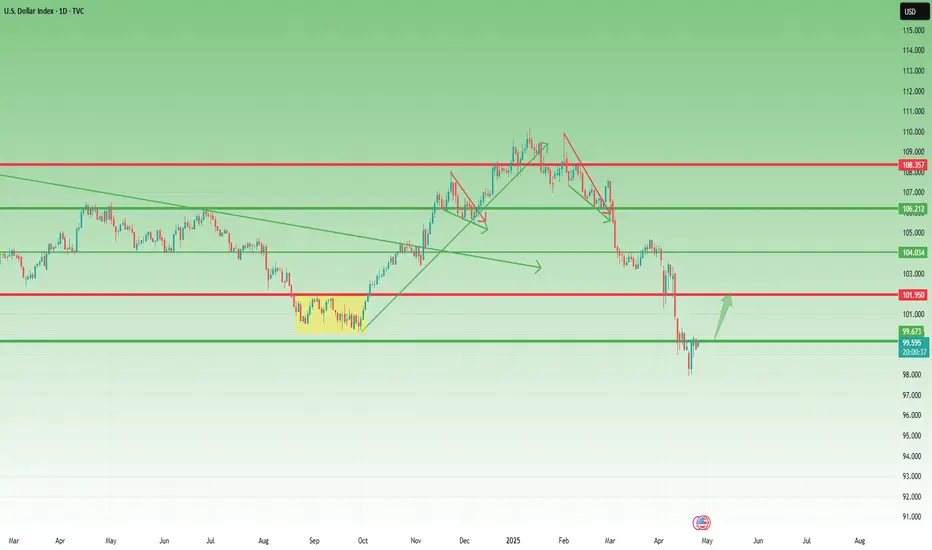
I just think the pair is set to push higher...
Because the pair then went and made a Choch and meaning that we are moving from bearish pattern to bullish pattern
Anything could invalidate my set up
So use proper risk management
Let's do the most
DXY trade ideas

DXYThe U.S. Dollar Index (USDX or DXY) is a measure of the value of the U.S. dollar relative to a weighted basket of six major foreign currencies: the euro (57.6% weight), Japanese yen (13.6%), British pound (11.9%), Canadian dollar (9.1%), Swedish krona (4.2%), and Swiss franc (3.6%). Established in 1973 after the Bretton Woods system ended, the index serves as a benchmark for the dollar’s strength in global markets.
How the Dollar Index Drives Trade Directional Bias in Forex
Indicator of Dollar Strength or Weakness
When the USDX rises, it means the U.S. dollar is strengthening against this basket of currencies; when it falls, the dollar is weakening. Since the dollar is the world’s primary reserve and trading currency, its strength heavily influences forex market trends.
Correlation with Major Currency Pairs
Inverse correlation with EUR/USD and GBP/USD: Because the euro and pound have large weights in the index, a rising USDX typically causes EUR/USD and GBP/USD to fall, and vice versa.
Positive correlation with USD/JPY and USD/CAD: For pairs where USD is the base currency, these pairs tend to move in the same direction as the USDX.
Commodity-related pairs like AUD/USD and NZD/USD often move inversely to the USDX due to their sensitivity to global risk sentiment and commodity prices.
Guiding Trade Decisions and Confirming Signals
Traders use the USDX to confirm directional bias in forex trades. For example, if the USDX is rising, it supports taking long positions in USD-based pairs or short positions in pairs where USD is the quote currency. Conversely, a falling USDX suggests caution on USD longs and potential opportunities in other currencies.
Macro and Sentiment Indicator
The USDX reflects broader economic conditions, U.S. monetary policy, and global risk sentiment. For instance, Fed rate hikes often strengthen the USDX, causing shifts in forex markets. It also acts as a proxy for the health of the U.S. economy and influences global trade flows.
Summary
Aspect Effect on Forex Trading
Rising USDX Dollar strengthens; EUR/USD & GBP/USD tend to fall; USD/JPY & USD/CAD tend to rise
Falling USDX Dollar weakens; EUR/USD & GBP/USD tend to rise; USD/JPY & USD/CAD tend to fall
USD as Base Currency (USD/xxx) Moves in line with USDX
USD as Quote Currency (xxx/USD) Moves inversely to USDX
Use in Trading Confirms trade signals, guides directional bias, gauges macroeconomic trends
In essence, the U.S. Dollar Index is a vital tool in forex trading, providing a consolidated view of the dollar’s strength and helping traders anticipate market movements and set trade directional bias accordingly.

DXY USD INDEX FORECAST Q2 W18 Y25DXY USD INDEX FORECAST Q2 W18 Y25
Professional Risk Managers👋
Welcome back to another FRGNT chart update📈
Diving into some Forex setups using predominantly higher time frame order blocks alongside confirmation breaks of structure.
✅ U.S. dollar index is a measure of the value of the dollar against a basket of six foreign currencies.
✅The currencies are the Euro, Swiss franc, Japanese yen, Canadian dollar, British pound, and Swedish krona.
💡Here are some trade confluences📝
✅ Break an d close below July 2023 key 100.00 levels.
✅ Foresee a pull back to, weekly imbalance, daily order block, daily 50ema, weekly order block and or weekly 50 ema.
✅ Awaiting to identify a significant break of structure bullish to use the DXY as confluence for our trading week 18 of Q2 toward key points of interest mentioned above.
✅ Forecasting continued bearish pressure long term.
✅Initially bullish outlook however upon price turn around. DXY to break 100.000 level again.
🔑 Remember, to participate in trading comes always with a degree of risk, therefore as professional risk managers it remains vital that we stick to our risk management plan as well as our trading strategies.
Pairs to look out for -
EURUSD
USDCHF
USDJPY
USDCAD
GBPUSD
📈The rest, we leave to the balance of probabilities.
💡Fail to plan. Plan to fail.
🏆It has always been that simple.
❤️Good luck with your trading journey, I shall see you at the very top.
🎯Trade consistent, FRGNT X

DXY - Still survive on it Bullish ChanelThe dollar index is currently still in a bullish channel. This shows that there is still a fairly large possibility of reversing and making an upward movement,
As history showed us that 120 is DXY current target.

U.S. DOLLAR INDEX (DXY) | MACRO OUTLOOKWe’re currently trading at $99.58 — down 8.2% from the recent high around $114.77. Looking at this 12M chart, we see DXY failing to hold its breakout above the previous cycle highs.
🟣 Key Historical Levels:
Last major high: 1985 peak
Previous structure high: $121.18
Long-term support zones: $88.25, $75, and $72.81
🔻 Macro view suggests we could be entering another multi-year corrective phase if momentum doesn’t reclaim previous highs.
What’s next? Will the dollar revisit deeper support — or surprise us with a reclaim and breakout?
👁 Stay alert. This chart isn’t just about the USD — it impacts commodities, equities, emerging markets, and crypto.
#DXY #USDollar #MacroTrading #LongTermOutlook #DollarIndex #TechnicalAnalysis #SmartMoneyMoves #RecessionWatch

USD Tests Long-Term Support + Weekly OversoldLast week I highlighted the oversold reading on the weekly DXY chart. While bulls didn't exactly put in a massive showing it was also one of the first green weekly bars in a month.
Notably, the monthly April bar looks very bearish but the bulk of those losses were in the first 11 days of the month and last week, on Monday, a massive spot of support came into play at the 38.2% retracement of the 2008-2024 major move. This is confluent with a trendline projection, connecting 2001 and 2020 highs, which had come in to hold support back in July of 2023. This adds context to the possibility of a pullback in the USD and this meshes with the 1.1500 resistance test in EUR/USD. - js

DXY TRADING SETUPDXY TRADING SETUP
Confirmation are in sight!
Get ready for a potential DROP!
Stay tuned for updates and confirmation signals!

DXY: Next Move Is Down! Short!
My dear friends,
Today we will analyse DXY together☺️
The price is near a wide key level
and the pair is approaching a significant decision level of 99.185 Therefore, a strong bearish reaction here could determine the next move down.We will watch for a confirmation candle, and then target the next key level of 99.910..Recommend Stop-loss is beyond the current level.
❤️Sending you lots of Love and Hugs❤️

DXY 4H TIME-FRAME ANALYSIS Okay, here's a description of the image:
The image shows a 4-hour price chart for the DXY (US Dollar Index).
Key points:
Downtrend: The index is generally in a downtrend.
Support and Resistance: A resistance zone is visible around 110.175, and a support level is around 97.921. Another resistance level is near 102.925.
Recent Price Action: The price has recently broken below the 102.925 level and is currently fluctuating around 99.581.

downtrendIt is expected that the trend change will take place at the current resistance level and we will witness the beginning of the downtrend. A break of the support trend line will be a confirmation of the downtrend.

Dollar False-break or break down????
1. **Entry:**
- Wait for confirmed false break below weekly deviation channel ( Short)
- Enter long after price reclaims support and shows bullish reversal (long)
- Alternative: Short on confirmed breakdown below channel with follow-through
2. **Stop Loss:**
- False break long: Below recent swing low
- Confirmed breakdown short: Above broken support level
3. **Take Profit:**
- False break long: Previous resistance or mean deviation line
- Breakdown short: Next major support level or extension of channel height
4. **Key Confirmations:**
- Candle patterns daily and weekly
- Weekly close position relative to deviation channel
- Follow-through in subsequent weekly candle
- Correlation check with major pairs (EUR/USD, GBP/USD)
5. **Management:**
- Give trade room to develop (weekly timeframe requires patience)
- Scale in to reduce risk
- Scale out at significant levels

USD Index: A Possible Reversal in Sight?Since early February, right after Trump’s inauguration, the USD Index (DXY) has been under pressure, falling sharply by over 10%.
However, after hitting the 98.00 level, things seem to have stabilized. We're seeing the early signs of a relief rally.
🔍 Technical Perspective:
- This week’s candlestick pattern suggests a bullish reversal.
- The dip on Wednesday was quickly bought, showing buyer interest.
- A minor correction occurred yesterday, but dips are being well supported.
- Currently, the DXY trades around 99.60, just under the psychological level of 100.
🎯 Outlook:
As long as 98 remains intact, the bias shifts towards a potential rebound.
First target: 102 – a logical resistance zone and prior support.
This is not yet a confirmed trend reversal, but the price action is shifting. The key now is how the market reacts around the 100 level. A break above could trigger further bullish momentum.
DXY, big picture analysisTechnical analysis for DXY.
Looking for bottom about 89.209 to complete wave B of zigzag (Y).
Would then look for wave C of (Y) to break above 121.020 resistance (bearish pitchfork never tagged median line).

DXY (U.S. Dollar Index) AnalysisDXY, or the U.S. Dollar Index, is an index that measures the value of the American dollar against major currencies such as the Euro (EUR), Japanese Yen (JPY), British Pound (GBP), Canadian Dollar (CAD), Swedish Krona (SEK), and Swiss Franc (CHF). An increase in the DXY indicates that the dollar has strengthened against these currencies; a decrease signifies that it has weakened. This index is susceptible to global economic outlook, interest rates, and geopolitical developments.
In the past, with Donald Trump's rise to the presidency, expectations of rising inflation in the markets had strengthened. This had caused the DXY to rise from the 100 level to 109. However, the tariffs implemented by Trump and the trade wars he initiated weakened the dollar in the long run, leading to a downward trend in the DXY.
As of today, the DXY has technically reached an important support level. At the same time, major currencies forming the index, such as GBP, EUR, and JPY, are trading at resistance points. This situation increases the likelihood of the dollar reacting from this level. If the support level is maintained, we may see an upward movement in the DXY. Conversely, if the support is broken, a deeper downward movement in the dollar index may begin.

Dollar indexKey Insights:
Potential short-term bearish retracement incoming (Wave 5)
Long-term bull trend remains , Wave (4) zone occurs.
Ideal spot for smart traders to prepare setups using Elliott + supply/demand confluence.

DXYThe US Dollar Index (DXY) is showing a downward trend as institutional investors continue to prioritize selling over buying. This sentiment is reflected in the increasing number of sell orders compared to buy orders.
Key Observations:
- DXY price action indicates a bearish trend.
- Institutional investors are adding more sells than buys, contributing to the downward pressure.
Trading Implications:
- Short positions may be favored given the prevailing bearish sentiment.
- Traders should monitor key support levels for potential breakouts or reversals.

DXY BUYSWING IS CLEARLY BULLISH (1D AND 4H )
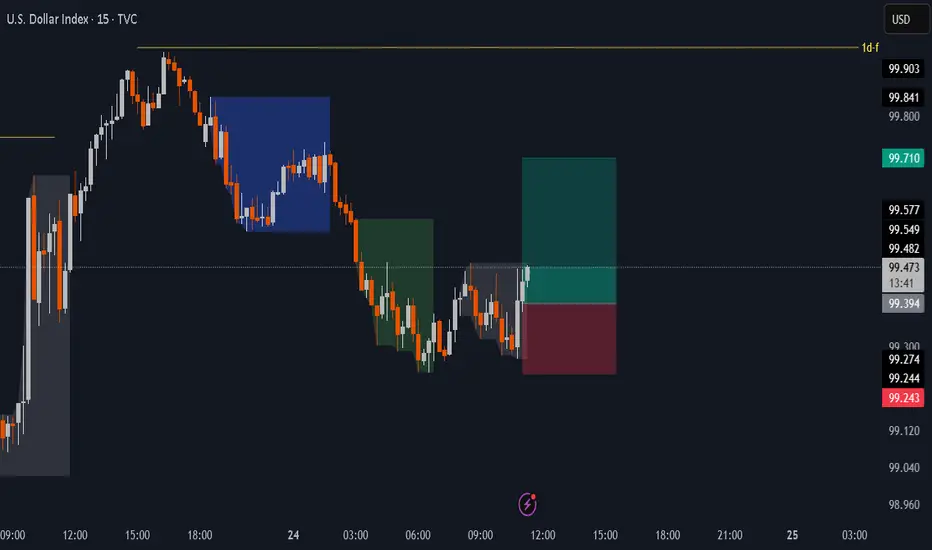
this is kinda intra-day setup . which show clear choch on 15min
now whether wait for tomorrow kill-zone session , or enter from now .
xxx/usd bearish.
DXY Is Bullish! Buy!
Please, check our technical outlook for DXY.
Time Frame: 15m
Current Trend: Bullish
Sentiment: Oversold (based on 7-period RSI)
Forecast: Bullish
The price is testing a key support 99.109.
Current market trend & oversold RSI makes me think that buyers will push the price. I will anticipate a bullish movement at least to 99.404 level.
P.S
Overbought describes a period of time where there has been a significant and consistent upward move in price over a period of time without much pullback.
Disclosure: I am part of Trade Nation's Influencer program and receive a monthly fee for using their TradingView charts in my analysis.
Like and subscribe and comment my ideas if you enjoy them!

DXY "Dollar Index" Market Bullish Heist Plan (Day or Swing)🌟Hi! Hola! Ola! Bonjour! Hallo! Marhaba!🌟
Dear Money Makers & Robbers, 🤑 💰💸✈️
Based on 🔥Thief Trading style technical and fundamental analysis🔥, here is our master plan to heist the DXY "Dollar Index" Market. Please adhere to the strategy I've outlined in the chart, which emphasizes long entry. Our aim is the high-risk ATR Line. Risky level, overbought market, consolidation, trend reversal, trap at the level where traders and bearish robbers are stronger. 🏆💸"Take profit and treat yourself, traders. You deserve it!💪🏆🎉
Entry 📈 : "The heist is on! Wait for the MA breakout (99.900) then make your move - Bullish profits await!"
however I advise to Place Buy stop orders above the Moving average (or) Place buy limit orders within a 15 or 30 minute timeframe most recent or swing, low or high level for Pullback entries.
📌I strongly advise you to set an "alert (Alarm)" on your chart so you can see when the breakout entry occurs.
Stop Loss 🛑: "🔊 Yo, listen up! 🗣️ If you're lookin' to get in on a buy stop order, don't even think about settin' that stop loss till after the breakout 🚀. You feel me? Now, if you're smart, you'll place that stop loss where I told you to 📍, but if you're a rebel, you can put it wherever you like 🤪 - just don't say I didn't warn you ⚠️. You're playin' with fire 🔥, and it's your risk, not mine 👊."
📍 Thief SL placed at the nearest/swing low level Using the 1H timeframe (98.900) Day / Swing trade basis.
📍 SL is based on your risk of the trade, lot size and how many multiple orders you have to take.
🏴☠️Target 🎯: 101.400 (or) Escape Before the Target
🧲Scalpers, take note 👀 : only scalp on the Long side. If you have a lot of money, you can go straight away; if not, you can join swing traders and carry out the robbery plan. Use trailing SL to safeguard your money 💰.
💰💵💸DXY "Dollar Index" Market Heist Plan (Swing/Day Trade) is currently experiencing a Bullish trend.., driven by several key factors.☝☝☝
📰🗞️Get & Read the Fundamental, Macro, COT Report, Geopolitical and News Analysis, Sentimental Outlook, Intermarket Analysis, Index-Specific Analysis, Future trend targets with Overall outlook score... go ahead to check 👉👉👉🔗🔗
⚠️Trading Alert : News Releases and Position Management 📰 🗞️ 🚫🚏
As a reminder, news releases can have a significant impact on market prices and volatility. To minimize potential losses and protect your running positions,
we recommend the following:
Avoid taking new trades during news releases
Use trailing stop-loss orders to protect your running positions and lock in profits
💖Supporting our robbery plan 💥Hit the Boost Button💥 will enable us to effortlessly make and steal money 💰💵. Boost the strength of our robbery team. Every day in this market make money with ease by using the Thief Trading Style.🏆💪🤝❤️🎉🚀
I'll see you soon with another heist plan, so stay tuned 🤑🐱👤🤗🤩

DXY - Near TopThe dollar index is showing weakness.
Considering the chart and Trump's policies to support domestic production, interest rate cuts, and other macroeconomic policies, it seems that we will soon be on a downward trend.

DXY BEARISH BIAS|SHORT|
✅DXY is trading in a downtrend
And the index is making a local
Bullish correction so after the
Resistance is hit around 100.500
We will be expecting a local
Bearish correction
SHORT🔥
✅Like and subscribe to never miss a new idea!✅
Disclosure: I am part of Trade Nation's Influencer program and receive a monthly fee for using their TradingView charts in my analysis.

DXY Long to 100 off bullish news from Trump
1. Current Data and research
Macro Regime
Business cycle
- moving into recession territory. S&P is down from 6125 to 4842 at its lowest. That's a 21% drop - this crosses the 20% drop threshold.
Inflation
- Headline 2.4%. Slightly above 2% target. Core PCE is at 0.4%. This is higher than expected.
Monetary Policy
- Still at high interest rate levels of 4.5%. There's more room for cuts than hike in general. However, Tariffs is a spanner in this logic as it introduces inflation that needs to be controlled, and limits the cuts.
Growth
- Consumer sentiments - 50.8. This is a drop from 57. Not a good sign for confidence in the US markets
Central Bank Outlook
- Forward Guidance & Policy Path - "Wait and see" approach to see the full effects of the tariffs and will tackle. Unlikely to cut rates quickly due to inflation risks from tariffs.
Flow & Positioning Factors
- LDN and NY opens
List of upcoming data
German PMI - today
US PMI - today
Expectations
German PMI - 47.5/50.3 - Unsure, but doubt there will be a huge surprise to the upside
US PMI - 49.3/52.9 - Expect a downtrend here and close to the 49.3. It will invalidate longer-term trades if there's a huge surprise to the downside
US Unemployment claims -NA -Expecting higher
Bullish arguments
- More pumping by Trump to prop the market up while the fundamentals are still likely to bad as tariffs are still there
Bear arguments
- The tariff is still the biggest elephant in the room and nothing has changed there. If anything, China has taken steps to prepare for a worse response in the future if US does not reach a negotiation.
2. Trade Thesis
Directional Thesis
I am expecting DXY to go back up to 100 due to a temporary strength in the USD from the good news for Fed Powell and Trump backing down in tariffs.
Supporting Logic
- Structural
-- The DXY was holding 100 level before the Powell news.
-- If the current news stays status quo, I expect prices to rise back up to that fundamental level after a brief pullback from 99.4 to 99.2
-Tactical
A significant lower-high pivot point set on H1 chart. I need prices to remain above that 99 level. If it drops below, then the tactical levels do not work.
- Flows
Look for entry at either LDN or NY session open
Expected Path
- Pull back to 99.0 and now slow ascend back to 100
- There's a resistance level at 99.6. That would be TP1, and 100 would be TP2
Invalidation Logic
- Fundamental Invalidation
-- Trump tweets another fire Fed
-- China escalates the trade war
-- US PMI has a huge downside surprise (unlikely)
- Price-Based Invalidation
-- Price breaking below 99
Asymmetric Setup
If I enter at 99.1X, this is a potential 1:4R trade with high confidence
Trade Setup
Entry level
- 99.1 to 99.2
Scale-in plan (if any)
- I can enter full size here
Position sizing
- 1% of account
TP zones
- TP1 - 99.6
- TP2 - 100
- TP3 - 101 (significant psychological level)
Time stop
Kill trade if
a) Prices drop below 99
b) Prices do not bounce to the upside within 2 hours of LDN and NY open

$DXY bullish from 96-98, massive bull flagDespite everyone calling for the death of the dollar, I think the dollar is in the process of bottoming and then will head higher.
Macron called for the Euro to replace the dollar (which is laughable) and likely marks a bottom.
Either we bounce here, or I could see the possibility of one more spike low down to the ~96 support level, but should we see a reaction there, it sets up a massive move higher in the dollar.
As you can see on the chart, we've been correcting inside of a bull flag, if we can form a low around $96-98, we will reverse and head higher to break the flag to the upside. Upside targets on the chart.
I think the bull market in the dollar is just starting, don't let the news scare you out of accumulating dollars over other fiat currencies.
