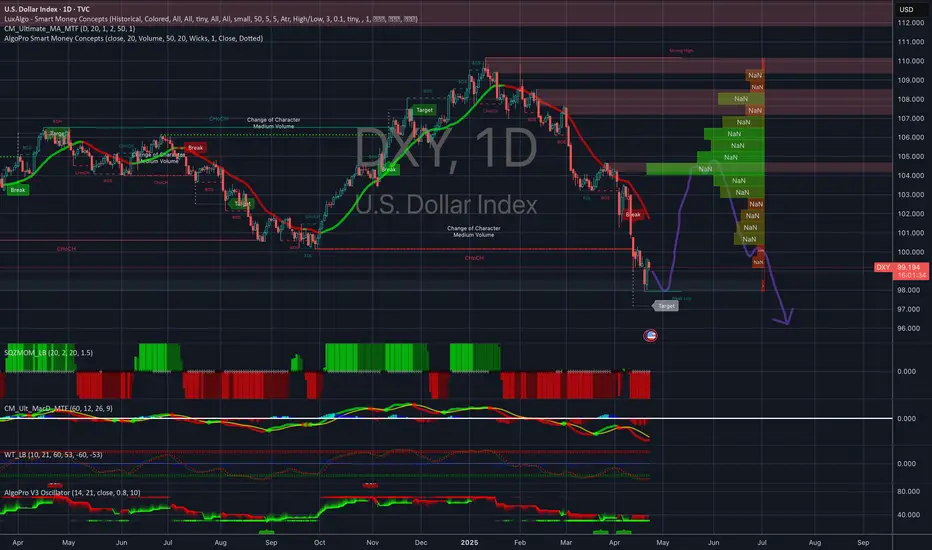
DOLLAR I Monday CLS I KL - HTF FVG / OB I Continuation setupHey, Market Warriors, here is another outlook on this instrument
If you’ve been following me, you already know every setup you see is built around a CLS range, a Key Level, Liquidity and a specific execution model.
If you haven't followed me yet, start now.
My trading system is completely mechanical — designed to remove emotions, opinions, and impulsive decisions. No messy diagonal lines. No random drawings. Just clarity, structure, and execution.
🧩 What is CLS?
CLS is real smart money — the combined power of major investment banks and central banks moving over 6.5 trillion dollars a day. Understanding their operations is key to markets.
✅ Understanding the behaviour of CLS allows you to position yourself with the giants during the market manipulations — leading to buying lows and selling highs - cleaner entries, clearer exits, and consistent profits.
🛡️ Models 1 and 2:
From my posts, you can learn two core execution models.
They are the backbone of how I trade and how my students are trained.
📍 Model 1
is right after the manipulation of the CLS candle when CIOD occurs, and we are targeting 50% of the CLS range. H4 CLS ranges supported by HTF go straight to the opposing range.
📍 Model 2
occurs in the specific market sequence when CLS smart money needs to re-accumulate more positions, and we are looking to find a key level around 61.8 fib retracement and target the opposing side of the range.
👍 Hit like if you find this analysis helpful, and don't hesitate to comment with your opinions, charts or any questions.
⚔️ Listen Carefully:
Analysis is not trading. Right now, this platform is full of gurus" trying to sell you dreams based on analysis with arrows while they don't even have the skill to trade themselves.
If you’re ever thinking about buying a Trading Course or Signals from anyone. Always demand a verified track record. It takes less than five minutes to connect 3rd third-party verification tool and link to the widget to his signature.
"Adapt what is useful, reject what is useless, and add what is specifically your own."
— David Perk aka Dave FX Hunter ⚔️
DXY trade ideas

[D] DXY - 23.4.2025I like see optimism before capitulation. As crazy as it sounded by the end of 2023, I thought, the death of U.S. Dollar might come in 2026. Now, I'm afraid, it might be sooner than that as Trump continues to beat all expectations.
DXY Correction Persists: Further Downside Potential in FocusThe DXY remains in a prevailing downtrend, and I estimate that it is currently in the final stages of wave (v) of wave . The correction is projected to extend toward the 97.023–97.739 area. Meanwhile, the nearest potential rebound zone is located between 99.690 and 100.764.

DXY - Rally due?This count suggests that DXY may be due a 4th wave correction in an ongoing and deep C wave down. This could also coincide in a correction for Gold which is perhaps due a rest.

$DXY last gasp before the monetary reset. Sad.3-3-5 watching the expected rejection at the median line of the channel probably before pivoting and falling out the bottom. Sad times for many..


U.S. Dollar (USD Index) Nears Key Support at 97.4
The U.S. dollar approaches key support at 97.4, with strong selling pressure recently. A shift to the upside may not happen quickly, but we could see a potential rebound in Q3.

dxy aka usd 22 April 2025Price seems to be ranging, if top channel hold, we could see a retest of the low, meaning usd should continue lower.
Good luck

DXY MAJOR BOTTOM IS IN The chart posted is that of the US $ DXY we have now reach fib relationships projection We have an .I.T. BOTTOM in place look for a few weeks of upside back to 94/96 best of trades WAVETIMER

DXY: Strong Bullish Sentiment! Long!
My dear friends,
Today we will analyse GOLD together☺️
The price is near a wide key level
and the pair is approaching a significant decision level of 98.127 Therefore, a strong bullish reaction here could determine the next move up.We will watch for a confirmation candle, and then target the next key level of 98.393.Recommend Stop-loss is beyond the current level.
❤️Sending you lots of Love and Hugs❤️

DXY Weekly Analysis – Critical Support Zone at 98.4
The US Dollar Index (DXY) is currently testing a major support zone around 98.4 on the weekly timeframe. This level aligns with the bottom of a long-term ascending channel, and it also coincides with a horizontal support zone that has held multiple times in the past.
If this area holds, we could see a strong bullish rebound towards the 105 area — or even higher. However, a clear break below this support may open the door for a deeper decline toward the 89–90 range, which marks the next significant support zone.
Overall, DXY is sitting at a crucial decision point, and the market’s reaction in the coming weeks will be key for medium to long-term direction.

Dollar Milkshake Theory: Will the US Dollar Suck the World Dry?Imagine a colossal milkshake party where every country brings its own flavor—sweet euros, tangy yen, spicy rupees—blended into a global liquidity shake. Now picture the United States, armed with a giant straw, slurping up every last drop while the rest of the world watches in dismay. 🍓🍫🍦 This vivid analogy isn’t just a quirky dessert dream—it’s the heart of Brent Johnson’s Dollar Milkshake Theory, a provocative economic idea that’s been shaking up financial circles since 2018. But is the US dollar really about to dominate the global economy, or will it choke on its own straw? Let’s dive into this creamy concoction of macroeconomics, recent trends, and global stakes—complete with a cherry of skepticism on top! 🍒
🥛 What’s the Dollar Milkshake Theory, Anyway?
Brent Johnson, CEO of Santiago Capital, isn’t just a wealth manager—he’s a financial storyteller who’s been stirring the pot with his Dollar Milkshake Theory. Picture this: the global economy is a giant milkshake, with frothy assets (stocks, bonds, commodities) floating on top, and the milk, cream, and sugar representing the cash flows between markets. The straw? That’s the US Federal Reserve’s monetary policy, sucking up liquidity when it tightens, leaving other economies parched.
Johnson’s core idea is simple yet bold: during global economic turmoil, the US dollar—thanks to its status as the world’s reserve currency—becomes a safe haven. Investors worldwide flock to it, driving its value skyward while other currencies wither. 🌎💰 Since 2008, global central banks have pumped roughly $30 trillion in liquidity into the system through quantitative easing (QE), creating a massive “milkshake” of money. But when the Fed raises rates, as it has in recent years, the US siphons that liquidity, leaving other nations scrambling to pay dollar-denominated debts.
Here’s the kicker: this isn’t a one-time sip. Johnson predicts a feedback loop where the dollar’s strength forces other countries to print more of their own currencies to buy dollars, further weakening their economies and reinforcing the dollar’s dominance. It’s a vicious cycle—a “milkshake” that could leave the global economy in a sticky mess. 🌀
📈 The Recipe for Dollar Dominance: Why the US Holds the Straw
Why does the US get to drink everyone else’s milkshake? It’s all about structural advantages baked into the global financial system:
Reserve Currency Status 💵: The US dollar has been the world’s reserve currency since the 1944 Bretton Woods Agreement. As of 2022, it accounted for 58% of global foreign exchange reserves, dwarfing the euro’s 20% share . From oil to copper, most global trade is priced in dollars, creating constant demand.
Deep Capital Markets 🏦: The US has the deepest and most liquid bond markets, especially for Treasuries, making it the go-to place for investors seeking safety during crises.
Higher Interest Rates 📊: When the Fed raises rates, as it did aggressively in 2022-2023 to combat inflation, the dollar becomes more attractive compared to currencies like the euro or yen, where central banks like the ECB and BOJ have been slower to tighten .
Global Dependence on Dollars 🌐: Over 60% of international reserves are in dollars, and many countries and corporations hold dollar-denominated debt. When the dollar strengthens, their debt burden skyrockets, forcing them to buy more dollars to service it .
Johnson argues this isn’t just a cyclical trend—it’s a structural feature of the modern financial system. As he put it on Real Vision in 2018, “The dollar’s dominance is structural, not cyclical”. The US doesn’t just sip the milkshake—it guzzles it, leaving others to scrape the bottom of the glass. 🥤
📅 2025 Reality Check: Is the Milkshake Theory Playing Out?
Fast forward to April 2025, and the global economy is a blender of chaos: trade tensions, high debt levels, and monetary policy shifts are whipping up a storm. Does Johnson’s theory hold water—or rather, milk? Let’s look at the evidence. 🕵️♂️
🟢 The Bull Case: The Dollar’s Straw Is Sucking Hard
DXY Strength in 2024-2025: The US dollar index (DXY) surged 7% in 2024, hitting a two-year high of 108.07 in November 2024, driven by US economic growth, tariffs, and global uncertainty . Despite a recent 8% drop over the last two months (from ~106.8 in mid-February 2025 to 98.423 as of April 22, 2025), the DXY remains near historic highs, aligning with Johnson’s prediction of dollar strength during stress.
Historical Precedents: During the 2020 COVID crisis, the DXY jumped as the Fed provided $450 billion in swap lines to ease dollar shortages globally, reinforcing the dollar’s safe-haven role. In 2022, Russia’s invasion of Ukraine pushed the DXY to a 20-year high of 114, as capital fled to the US amid Europe’s energy crisis.
Global Liquidity Squeeze: High-debt economies like Japan (debt-to-GDP at 255%) and the Eurozone (Italy at 139%, France at 112%) are under pressure. Capital flight to the US, especially if their growth falters, supports the milkshake effect.
Safe-Haven Demand: Posts on X reflect sentiment that the dollar’s strength is tied to its stability in an unstable world, with some users noting its “dug-in” status as global liquidity flows to the US .
🔴 The Bear Case: Is the Straw Starting to Bend?
Recent DXY Drop: The 8% decline in the DXY over the last two months (mid-February to April 2025) signals vulnerability. Trade war fears, threats to Fed independence, and a weakening US trade balance are weighing on the dollar. Some X users predict a further drop to 96-97, or even 87, if support levels break.
Fed Policy Shifts: The Fed began cutting rates in September 2024, which typically weakens the dollar by reducing its yield advantage. This move, aimed at balancing inflation and growth, could undermine the milkshake effect if it continues.
Dedollarization Efforts: BRICS nations are pushing to reduce dollar reliance, with China and India holding significant non-dollar reserves ($3,682 billion and $662 billion, respectively, as of April 2025). A shift toward commodity-based currencies could challenge the dollar long-term.
US Debt Concerns: The US’s soaring debt levels (over 120% of GDP in 2024) and inflation above the Fed’s 2% target raise questions about the dollar’s sustainability. If confidence in US fiscal health wanes, the milkshake could spill.
🌪️ What Happens If the Milkshake Theory Plays Out?
If Johnson is right, the global economy could face a bitter aftertaste. Here’s what a super-strong dollar might mean:
Currency Crises Abroad 💥: Countries with dollar-denominated debt—like many emerging markets—would struggle as their debt burdens soar. A stronger dollar means they need more of their own currency to buy dollars, potentially triggering defaults.
Commodity Price Slumps 📉: A rising dollar often leads to lower commodity prices (priced in dollars), hurting exporters like Brazil or Australia. This could stifle growth in developing economies.
US Export Woes 🚢: An overly strong dollar makes US goods pricier abroad, hurting American exporters. US companies could lose competitiveness, impacting economic growth.
Safe-Haven Asset Boom 🪙: Investors might flock to alternatives like gold or Bitcoin to hedge against currency devaluation. Gold recently hit $3,400 amid the DXY’s slide, and Bitcoin has seen gains as a “risk-on” asset.
Geopolitical Shifts 🌍: A dominant dollar could lead more countries to peg their currencies to the USD for stability, as 65 nations already do (e.g., Hong Kong, Saudi Arabia). But it might also accelerate dedollarization efforts, with BRICS nations seeking alternatives.
🤔 Skeptics Stir the Pot : Is the Milkshake Theory Too Sweet to Be True?
Not everyone’s sipping Johnson’s milkshake. Critics argue it’s more of a financial fairy tale than a robust theory:
Oversimplification 📊: The global economy is far more complex than a milkshake analogy. The theory focuses heavily on Fed policy but downplays other central banks’ actions, geopolitical tensions, and the rise of digital currencies.
Lack of Timeframes ⏳: Johnson’s predictions lack clear timelines, making them hard to test. As some X users have pointed out, being “too early” in financial markets is as good as being wrong.
Counter-Theories 🌐: Economist Zoltan Pozsar’s Bretton Woods III Theory suggests a shift toward commodity-based currencies in the East, potentially weakening the dollar. Post-Russia-Ukraine war, nations are diversifying away from the USD, favoring hard assets like gold.
US Vulnerabilities 🇺🇸 : The US’s own fiscal health—high debt, persistent inflation, and trade deficits—could undermine the dollar. Recent tariffs and supply chain shifts (e.g., moving away from China) may raise production costs, fueling inflation and slowing growth.
💡 What’s Next for the Dollar Milkshake in 2025 and Beyond?
As of April 22, 2025, the DXY’s recent 8% drop is a speed bump, not a derailment, for the Milkshake Theory. The long-term chart you provided projects the DXY climbing to 120-130 by the late 2020s, suggesting this dip might be a correction within a broader uptrend. But the road ahead is frothy with uncertainty:
Watch the Fed 🏛️: If the Fed continues rate cuts, the dollar’s yield advantage could shrink, slowing the milkshake effect. Conversely, renewed tightening could reignite dollar strength.
Global Crises ⚡: Ongoing trade wars, like US-China tensions, or new geopolitical shocks could drive more capital to the US, reinforcing the theory.
Dedollarization Risks 🌏: If BRICS nations succeed in reducing dollar reliance, the US straw might not suck as hard in the future.
🥛 Sip or Spill: Should You Buy Into the Milkshake Theory?
Brent Johnson’s Dollar Milkshake Theory is a compelling narrative that captures the US dollar’s unique power in a turbulent world. The evidence—DXY strength, historical crises, and global dollar demand—suggests there’s cream in this shake. But the theory isn’t without cracks: the US’s own vulnerabilities, dedollarization efforts, and the recent DXY dip remind us that even the mightiest straw can bend. 🥤
For investors, this means staying nimble. A stronger dollar could hurt emerging markets and commodities, but it might boost safe-haven assets like gold or Bitcoin. Keep an eye on Fed policy, global growth, and geopolitical shifts—they’ll determine whether the US keeps sipping or the milkshake spills. 🌍💸 What do you think—will the dollar dominate, or is the party over? Let’s hear your thoughts! 🗣️

DXY – Time & Price Analysis via Gann GeometryThe TVC:DXY just broke below the 1×1 descending angle within a Gann weekly square, confirming the end of the bullish cycle initiated around the September 2022 high.
Key observations:
📉 Next time–price supports: 89.91 → 84.95
🕰️ Major timing intersections ahead:
Dec 16, 2024 → marks a quarter cycle completion.
Sep 8, 2025 → opposite timing leg to Sep 2022 high.
RSI is weakening, but price remains a function of time.
If these time zones hold, a reversal window opens.
Otherwise, we're heading deeper into the southern square.
📐 Time governs trend – price obeys.
#Gann #TimeCycles #DXY #USD #TechnicalAnalysis #TradingView

DXY TO RETRACE, BUYMy yearly target for DXY has been smashed in April, not even 6 months in, lol. The move was fast and brutal, many were left out.
Now I think we will see some cool off, a retracement or a range, dont hold trades as the market may range after such big move and I don't like holding a ranging market.
Learn to let your profit run, stop chasing few pips. Dxy fell thousands pips and you caught only 100 pips due to day trading, it doesn't make sense. Learn to see the bigger picture
My TP 1 is 99
TP 2 = 101.3
Enjoy
Follow me as my trades are market order, so you'll see it on time and enter at premium

22.04.25 Morning ForecastPairs on Watch -
FX:AUS200
FX:AUDUSD
FX:EURUSD
FX:GBPUSD
A short overview of the instruments I am looking at for today, multi-timeframe analysis down to what I will be looking at for an entry. Enjoy!

DXY Faces Continued Downtrend in Elliott Wave Bearish PatternThe Dollar Index (DXY) has experienced a significant decline since President Trump’s tariff war intensified global trade tensions. From its peak on September 26, 2022, the Index has exhibited a clear bearish sequence. This decline aligns with an Elliott Wave structure, offering insights into potential future price action.
The current bearish sequence is unfolding as a corrective zigzag pattern, labeled ((A))-((B))-((C)). Waves ((A)) and ((B)) have completed, and the Index is now in the ((C)) leg. Wave ((C)) leg subdivides into a strong five-wave impulse to the downside. Based on Fibonacci extensions, the projected target for this decline lies between 85.5 and 94.9. This corresponds to the 100% – 161.8% Fibonacci extension levels from the prior structure. This zone represents a critical support area where buyers may attempt to step in.
In the shorter cycle, the DXY is expected to face resistance in a 3, 7, or 11-swing corrective rally. As long as the pivot at 103.5 holds, the bearish momentum should persist, driving the index toward the Fibonacci target zone. Traders should monitor these levels closely, as a break above 103.5 could invalidate the immediate bearish setup, while continued failures at resistance reinforce the downside bias.
This Elliott Wave outlook suggests the DXY remains vulnerable, with the tariff war’s ripple effects continuing to pressure the dollar. Stay vigilant for price action near the 85.5 – 94.9 range for potential reversal signals.

Daily Analysis- XAUUSD (Tuesday, 22nd April 2024)Bias: Bullish
USD News(Red Folder):
-None
Analysis:
-Current ATH at 2443
-Looking for pullback
-Potential BUY if there's confirmation on lower timeframe
-Pivot point: 3300
Disclaimer:
This analysis is from a personal point of view, always conduct on your own research before making any trading decisions as the analysis do not guarantee complete accuracy.

EUR/USD Analysis: Weekly & Daily Timeframes
In this analysis, I explored the EUR/USD pair, identifying significant patterns and potential trade opportunities. The weekly timeframe shows a strong support level, while the daily chart highlights short-term resistance. Combining these insights with the DXY index, we can better understand market dynamics.

DXY is Strugglig to GrowHey Traders, in today's trading session we are monitoring DXY for a selling opportunity around 102 zone, DXY is trading in a downtrend and currently is in a correction phase in which it is approaching the trend a 102 support and resistance area.
Trade safe, Joe.


Elliott Wave Principles: A Study on US Dollar IndexHello friends, today we'll attempt to analyze the (DXY) US Dollar Index chart using Elliott Wave theory. Let's explore the possible Elliott Wave counts with wave Principles (Rules).
We've used the daily time frame chart here, which suggests that the primary cycle degree in Black weekly wave ((A)) and ((B)) waves have already occurred. Currently, wave ((C)) is in progress.
Within wave ((C)) in Black which are Weekly counts, Subdivisions are on daily time frame, showing Intermediate degree in blue wave (1) & (2) are finished and (3) is near to completion. Post wave (3), we can expect wave (4) up in Blue and then wave (5) down in Blue, marking the end of wave ((C)) in Black.
Additionally, within blue wave (3) Intermediate degree, we should see 5 subdivisions in red of Minor degree, which is clearly showing that waves 1 & 2 are done and now we are near to completion of wave 3 in Red. followed by waves 4 and 5, which will complete blue wave (3).
Key Points to Learn:
When applying Elliott Wave theory, it's essential to follow specific rules and principles. Here are three crucial ones:
1. Wave 2 Retracement Rule: Wave two will never retrace more than 100% of wave one.
2. Wave 3 Length Rule: Wave three will never be the shortest among waves 1, 3, and 5. It may be the largest most of the time, but never the shortest.
3. Wave 4 Overlap Rule: Wave four will never enter into the territory of wave one, meaning wave four will not overlap wave one, except in cases of diagonals or triangles.
Invalidation level is a level which is decided based on these Elliott wave Principles only, Once its triggered, then counts are Invalidated so we have to reassess the chart study and other possible counts are to be plotted
The entire wave count is clearly visible on the chart, and this is just one possible scenario. Please note that Elliott Wave theory involves multiple possibilities and uncertainties.
The analysis we've presented focuses on one particular scenario that seems potentially possible. However, it's essential to keep in mind that Elliott Wave counts can have multiple possibilities.
I am not Sebi registered analyst.
My studies are for educational purpose only.
Please Consult your financial advisor before trading or investing.
I am not responsible for any kinds of your profits and your losses.
Most investors treat trading as a hobby because they have a full-time job doing something else.
However, If you treat trading like a business, it will pay you like a business.
If you treat like a hobby, hobbies don't pay, they cost you...!
Hope this post is helpful to community
Thanks
RK💕
Disclaimer and Risk Warning.
The analysis and discussion provided on in.tradingview.com is intended for educational purposes only and should not be relied upon for trading decisions. RK_Charts is not an investment adviser and the information provided here should not be taken as professional investment advice. Before buying or selling any investments, securities, or precious metals, it is recommended that you conduct your own due diligence. RK_Charts does not share in your profits and will not take responsibility for any losses you may incur. So Please Consult your financial advisor before trading or investing.

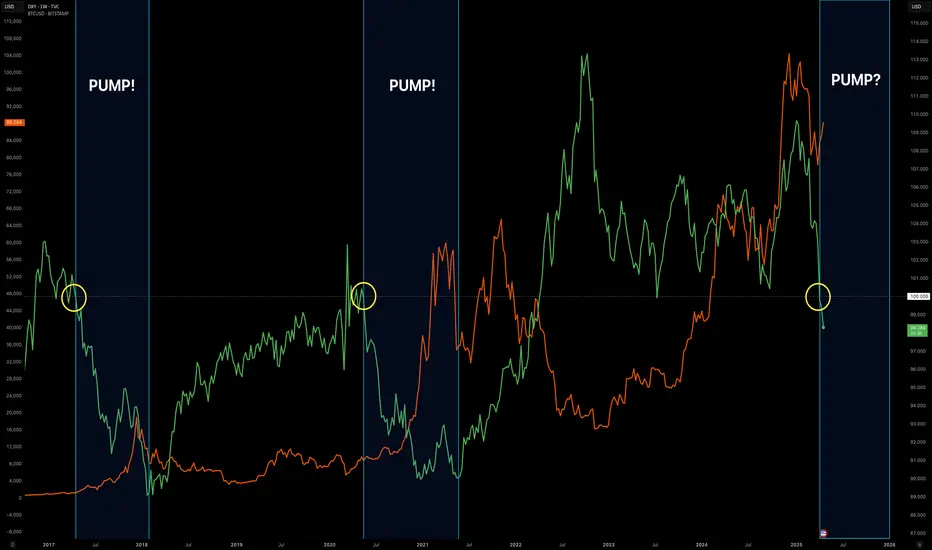
DXY Falling, Bitcoin Pump Imminent?This chart tracks the current decline in the dollar's value and compares it to two instances since 2018 when significant dollar depreciation coincided with sharp increases in Bitcoin's price.
US Dollar Index Decline in Wave C of A FlatTVC:DXY - has been trading lower from the 110 peak in wave "c" of a larger flat. We are currently in the late stages of wave (3) of "c".
