DXY wants upBut first we retest that trendline.
Giving us a brief window for risk on.
Maybe even until Q1 2025.
Hopefully.
(I'm biased)
DXY trade ideas

deepseek→→U.S. Dollar Index (DXY) Recent Analysis and Outlookchina deepseek↓↓
### **U.S. Dollar Index (DXY) Recent Analysis and Outlook**
#### **1. Current Market Trends and Driving Factors**
- **Trade Policies Boost the Dollar**: U.S. President Trump recently announced new tariffs on Canada (35%), the EU, and Mexico (30%), triggering risk-off sentiment and pushing the Dollar Index (DXY) from 97.20 to around 98.00.
- **CPI Data as a Key Variable**: The U.S. June CPI data, released today (July 15), will influence market expectations for Fed rate cuts. Stronger-than-expected inflation could reinforce the dollar's rally, while weak data may weaken it.
- **Shift in Market Sentiment**: Unlike the "dollar sell-off" trend in early 2025, recent market reactions have leaned toward treating the dollar as a "safe-haven asset" rather than selling it solely due to trade war concerns.
#### **2. Technical Analysis**
- **Key Resistance and Support Levels**:
- **Resistance**: 97.80-98.00 (short-term critical range). A breakout could test 98.50 or even 99.00.
- **Support**: 97.50 (50-day moving average). A drop below may target 96.38 (June low).
- **Technical Indicators**:
- **MACD**: A golden cross has formed on the daily chart, but it remains below the zero line, suggesting the current rebound may still be corrective.
- **RSI**: Near the 50 neutral zone, not yet overbought, indicating room for further upside.
#### **3. Short-Term and Long-Term Outlook**
- **Short-Term (1-2 Weeks)**:
- **Bullish Scenario**: If CPI data is strong and DXY breaks above 98.20, it could challenge 98.50-99.00.
- **Bearish Scenario**: Weak CPI data or progress in trade talks may push DXY back to 97.30-96.50.
- **Long-Term (Second Half of 2025)**:
- **Structural Pressures Remain**: Despite the short-term rebound, the dollar still faces long-term challenges, including widening U.S. fiscal deficits, de-dollarization trends, and concerns over Fed independence.
- **Historical Trend**: After falling over 10% in the first half of 2025, DXY may continue its downtrend in the second half, though the pace of decline could slow.
#### **4. Key Risk Factors**
- **Fed Policy**: If CPI data reinforces a "higher-for-longer" rate outlook, the dollar may strengthen further. Conversely, rising rate-cut expectations could weigh on the dollar.
- **Geopolitics and Trade Talks**: Compromises from the EU or Mexico could reduce safe-haven demand, while failed negotiations may fuel further dollar gains due to risk aversion.
### **Conclusion**
The DXY is at a critical juncture, with short-term direction hinging on CPI data and trade policy developments. Technicals lean bullish, but long-term fundamentals remain challenging. Traders should closely monitor the 98.00 breakout and today’s CPI data impact.


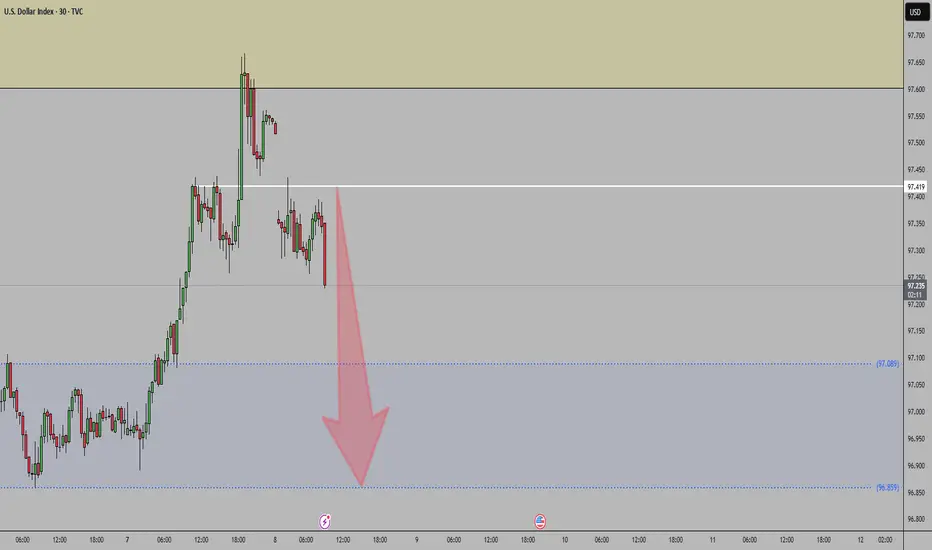
DXY Weekly Update — July 14, 2025⌛ Timeframe:
.
📆 Analysis Date: July 14, 2025
.
🎯 Weekly Bias: Bearish-to-Neutral (Potential for retracement or reversal)
🔎 Market Overview:
⬇️ Persistent USD Weakness:
DXY has dropped nearly 10% YTD, marking the steepest half-year decline since 1986.
📉 Rate Cut Expectations:
Markets are pricing in a potential 75bps rate cut by the Fed in H2 2025, pushing yields and the dollar lower.
📦 Trade War Fears:
Renewed tariff risks (targeting EU, Japan, Mexico, South Korea) aren't boosting demand for USD — a signal of lost safe-haven appeal.
⚖️ Central Bank Diversification:
Global reserve managers are rotating into gold and away from USD, weakening long-term structural demand.
🌀 Sentiment & Risk Appetite:
💸 Liquidity Demand is Soft:
DXY is retesting a 4H fair value gap (97.10–97.30), suggesting potential short-term consolidation or correction.
🌍 Risk-On Mood Returns:
According to Goldman Sachs, the USD is trading more like a "risk asset" than a haven, aligning with rising equity appetite.
📉 Technical Landscape:
🟠 4H Structure:
If DXY breaks below 97.00, next support lies at 96.37, followed by 95.50–96.00.
Consolidation expected if price remains within the FVG.
🔻 Key Resistance:
97.70–98.20 zone. A break above this area could change the tone to bullish.
📌 Summary:
🔷 Fundamentals show long-term dollar weakening (rates, trade tension, reserve shifts)
🔷 Sentiment aligns with risk-on appetite and reduced USD demand
🔷 Technicals at critical level; break below 97.00 opens room for correction, break above 97.70 shifts bias bullish
.
.
.
.
🟠 Bias: Bearish to Neutral
Watch Levels: 97.00 support, 97.70–98.20 resistance
⚠️ Note: This analysis is for educational purposes only and is not financial advice. Always apply risk management.
✅ If you like this analysis, don't forget to like 👍, follow 🧠, and share your thoughts below 💬!

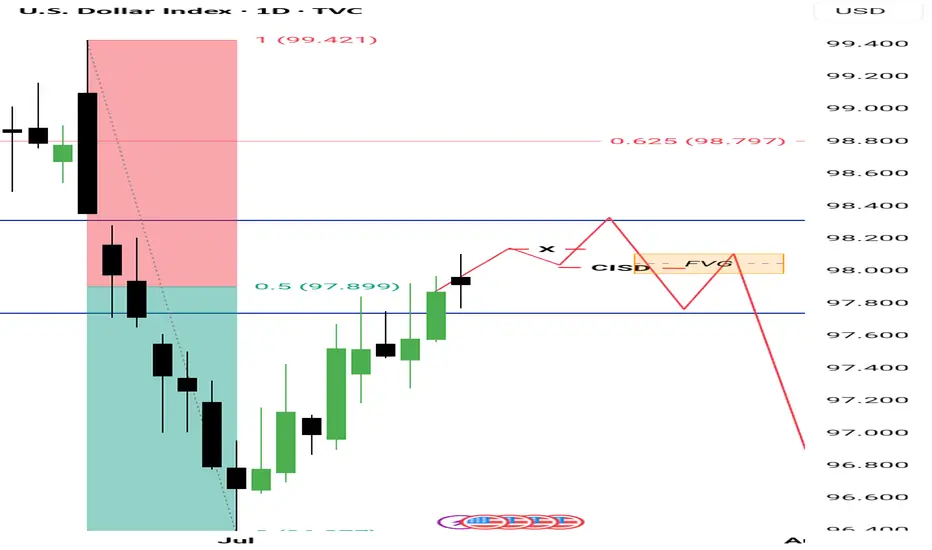
POSSIBLE PLAY FOR THE WEEKHTF KEY LEVEL
1. Premium gap/volume imbalance (DAILY TF)
2. monthly inverted fvg premium marked in Blue lines
I'd be watching the hourly time frame to get a setup as marked in red to engage for the week.
NOTE: CPI Tuesday
DXY Previous weeks analysis and July 13 week ahead ideasDXY
July 13
July 7 to 11 DELIVERY NOTES
I suspected that price would gravitate for higher prices in last Sundays analysis, celebrate on
*up closed candle on the weekly, rebalancing SIBI from June 23 week
*Price retraced to close on equilibrium on the current range
*Monday delivered an expansion
*Tuesday retraced to Monday CE of the daily candle
*Wednesday consolidation
*Thursday retraced to a discount then reversed to take Mondays buy stops
*Friday expansion to make the high of the week closing on the CE of the FVG from Wed June 25
July 14 to 18 Ideas
Bear bias
*Since July 2 Price has been seeking higher prices, further example of trending market
*Price reaching equilibrium on the HTF range and buy side taken last week
*I suspect that price will retrace for sell side liquidity this week
*I anticipate for Price to gravitate towards the EV at 97.430 for the low target this week, possibly the noted equal lows from Monday July 7
*Friday's delivery was a in consolidation pattern
*Sundays delivery could gravitate to the noted equal highs and noted FVG
*I suspect that Price will expand to seek lower Prices for Mondays delivery
*Price expand higher in Sundays delivery, we could see Price retrace Fridays in FVG
No News Monday and Friday

DXY Targeting Liquidity Zones & Gap Fill Before Potential ReversThe U.S. Dollar Index (DXY) is showing a strong bullish push, climbing steadily along an ascending trendline. Price appears to be heading toward key liquidity levels and a visible Fair Value Gap (FVG) near the previous New York high. The chart also highlights an unfilled gap above, which aligns with a potential liquidity sweep scenario.
Once these upper zones are tapped — including the liquidity and imbalance areas — a significant rejection could follow, especially considering ongoing strength in the Euro (EUR). This setup suggests a high-probability reversal opportunity after the liquidity grab

DXY: The Market Is Looking Down! Short!
My dear friends,
Today we will analyse DXY together☺️
The in-trend continuation seems likely as the current long-term trend appears to be strong, and price is holding above a key level of 97.370 So a bullish continuation seems plausible, targeting the next high. We should enter on confirmation, and place a stop-loss beyond the recent swing level.
❤️Sending you lots of Love and Hugs❤️

DXY strengthens but can it break THIS key level?The US dollar has gained ground this week, with the Dollar Index rising to retest the previously broken April low near the 97.92 level—an important technical zone. The short-term bias would flip to being bullish if this area breaks.
The greenback’s strength has been underpinned in part by unexpectedly strong economic data. For instance, Thursday’s weekly jobless claims came in at 227,000, below the forecast of 235,000. This marks the fourth consecutive weekly decline and the lowest reading in seven weeks, reinforcing the view that the US labour market remains tighter than anticipated.
Adding to this backdrop are President Trump’s threats of higher tariffs and expansive fiscal plans—described as “big, beautiful” spending and tax initiatives. These factors increase the risk of more persistent inflation.
While the Federal Reserve is still widely expected to initiate rate cuts in September, the rising inflationary pressures could slow the pace of easing thereafter. This shift would likely provide support for the dollar so long as investors don't lose trust in US monetary policy.
By Fawad Razaqzada, market analyst with FOREX.com

DXY Speculators are still net short on the U.S. Dollar Index.
But the short bias has decreased → sentiment is less bearish than before.
This shift could suggest a potential dollar rebound or profit-taking on bearish positions.
DXY Bearish Bias
Institutions are currently holding a net short position on the Dollar, indicating bearish sentiment. With a net position of -4,282, we may expect continued weakness in the DXY, especially if price reacts from key supply zones. Swing traders should remain cautious with long setups and prioritize opportunities aligned with USD weakness across major pairs.

DXY (USD Basket) - 3 Month - Short Squeeze In Play?Technicals:
The last 3-month candle closed above the major resistance that tends to hold according to historic levels going back to the year 1967.
Golden Cross is almost complete (50 MA crossing the 200 MA).
Fundamentals:
The dollar has only been more shorted once in history (2018), setting things up for a potential "Short Squeeze" and triggering a "Risk Off" scenario. Tends to hurt risk assets quite hard—for example, tech stocks, crypto, and other leverage plays.
A rise in the DXY could potentially trigger a "Short Squeeze" for foreign countries, companies, and investors that borrow in USD, creating "economic panic" in other countries that get their currency devalued relative to their obligations.
Countries that need USD to service their debt. With the current tariffs, the flow of dollars in the world will change. The question is: what will the effect look like in August when these tariffs start to go live? Like I mentioned before, other countries need the dollars in order to service their debt. If it gets more expensive for US consumers to import (caused by the tariffs), the exporting countries won’t get those dollars—setting it up for a buying cycle that could potentially drive the USD (DXY) higher, even to all-time highs.
Current narrative:
The narrative right now is that the USD will get "worthless," setting the stage to take more risk and use more leverage, maybe without even hedging. A surprise variable to this narrative could be devastating to the financial markets—not just in the US, but even to the world. IF/When this happens, everyone will hunt the USD once again, creating a new bullish narrative for the USD, and everyone will be forced to return to the reserve currency.
Nothing in this post should be considered financial advice. Always do your own research and analysis before investing.

Dollar I Daily CLS I Model 1 I KL OB I Target TRCandleYo Market Warriors ⚔️
It's risky, re-entry, but scared money makes no money.
if you’ve been riding with me, you already know:
🎯My system is 100% mechanical. No emotions. No trend lines. No subjective guessing. Just precision, structure, and sniper entries.
🧠 What’s CLS?
It’s the real smart money. The invisible hand behind $7T/day — banks, algos, central players.
📍Model 1:
HTF bias based on the daily and weekly candles closes,
Wait for CLS candle to be created and manipulated. Switch to correct LTF and spot CIOD. Enter and target 50% of the CLS candle.
For high probability include Dealing Ranges, Weekly Profiles and CLS Timing.
Trading is like a sport. If you consistently practice you can learn it.
“Adapt what is useful. Reject whats useless and add whats is specifically yours.”
David Perk aka Dave FX Hunter
💬 Don't hesitate to ask any questions or share your opinions

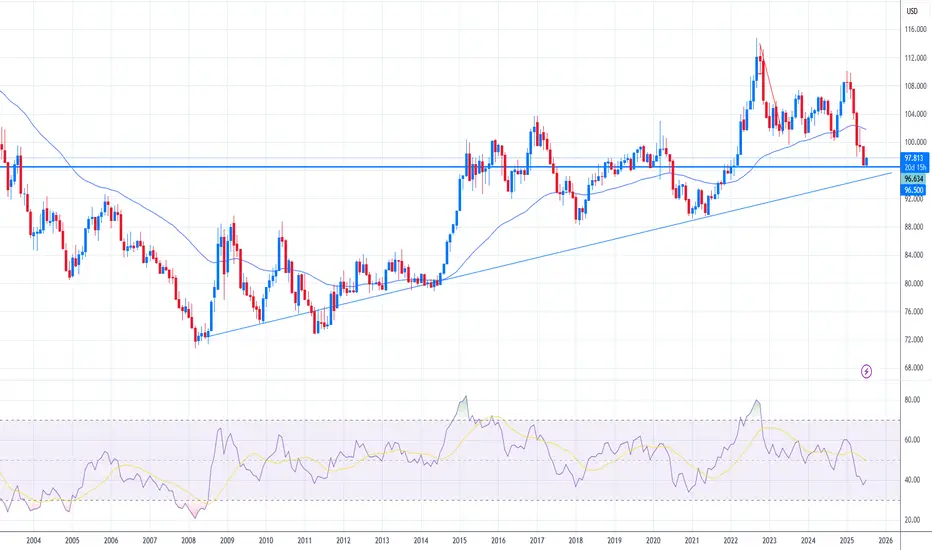
DXY Tests Key Support – What’s Next for the Dollar?
The U.S. Dollar Index (DXY), which tracks the dollar’s performance against a basket of major currencies, recently broke below its 50-month moving average based on the monthly chart —a significant technical signal. After this drop, the index is now bouncing off a key support zone near 96.50.
This area has acted as a pivot point in past cycles, and a sustained bounce could indicate the dollar regaining strength. If risk sentiment fades—due to weaker equity markets, geopolitical tensions, or stronger U.S. data—the dollar might find new momentum.
On the flip side, failure to hold 96.50 could open the door toward the 90.00 zone, a major long-term support level. Such a move would likely reflect expectations of looser U.S. monetary policy or further deterioration in economic confidence.
For now, price action near 96.50 will be decisive. A rebound could shift sentiment back in favor of the dollar, while a deeper decline may trigger broader adjustments in FX markets. Traders should closely monitor upcoming macro data and risk sentiment for cues on the next leg.
DXY Jul. 11The information and publications are not meant to be, and do not constitute, financial, investment, trading, or other types of advice or recommendations.
Have a nice day ahead.

Bold analysis for the most powerful currency in the world (DXY)Orange range: entering in several steps .
Green area: important support and exit point .
Important note: The gray line is the liquidity range
Watch the dance around this line carefully (bank positions are settled around this line)
And in my opinion, by increasing the price, they are emptying it on the buyers, so buy cautiously, but sell boldly.
GL


BTC vs DXYThe correlation between these two charts is striking. Now, both DXY and BTC have very completed patterns with BTC pretty high and DXY pretty low. Based on this chart it seems at least plausible that BTC should be topping in the next couple of months.
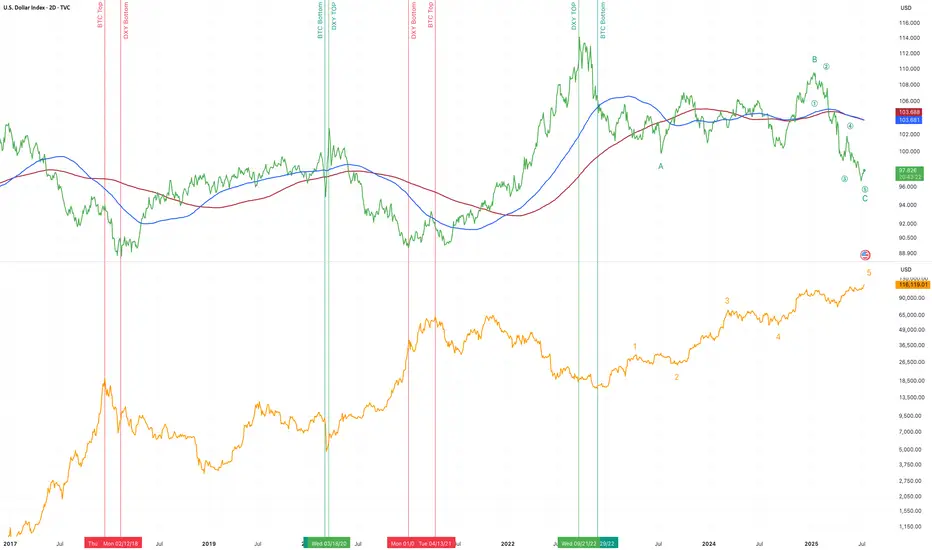
US interest rate reduction?!As you can see, the US dollar index has completed a 5-wave uptrend and after touching the top of the uptrend channel and breaking the uptrend line, it is currently in the second correction wave. I expect to see the beginning of the third correction wave soon. This may coincide with the reduction of the US interest rate in next week!!

Dollar Index AnalysisTwo possibilities for the dollar index has been shown here. We can see that dollar index is showing a short term uptrend. Which is clearly visible from the chart.
1: Dxy can maintain this short term uptrend. Because it is a monthly pullback. As it has been
for last 5 months.
2: Dxy can change character and again touches to the monthly demand zone as shown in my
previous video.

Dollar Index Analysis [DXY]Market has show upper wicks for last 3 days which is the sign that there is still sell pressure. The daily candles for this week are range bound. 4H chart is showing short term uptrend which is maintaining higher highs and higher lows. We can use this range to have scalps in this range.

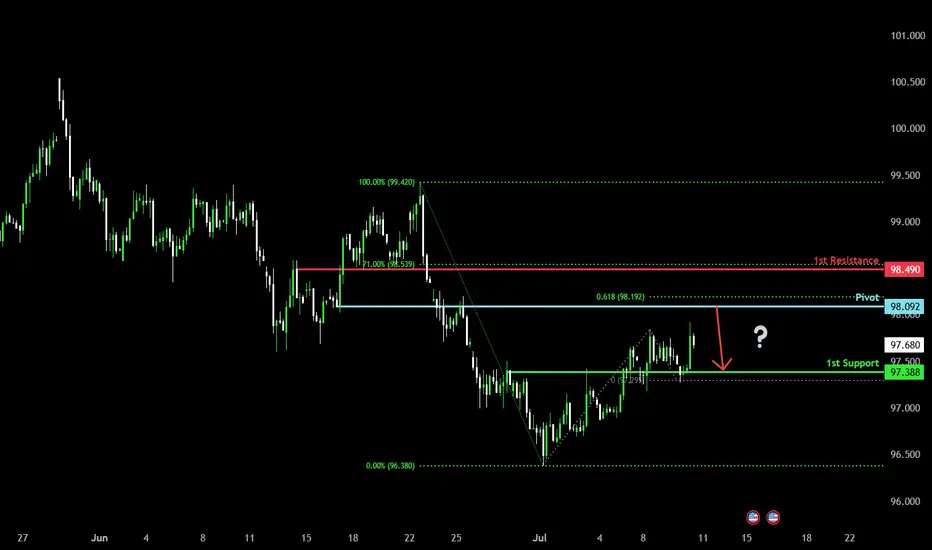
Could the price reverse from here?US Dollar Index (DXY) is rising towards the pivot and could reverse to the 1st support which acts as an overlap support.
Pivot: 98.09
1st Support: 97.38
1st Resistance: 98.49
Risk Warning:
Trading Forex and CFDs carries a high level of risk to your capital and you should only trade with money you can afford to lose. Trading Forex and CFDs may not be suitable for all investors, so please ensure that you fully understand the risks involved and seek independent advice if necessary.
Disclaimer:
The above opinions given constitute general market commentary, and do not constitute the opinion or advice of IC Markets or any form of personal or investment advice.
Any opinions, news, research, analyses, prices, other information, or links to third-party sites contained on this website are provided on an "as-is" basis, are intended only to be informative, is not an advice nor a recommendation, nor research, or a record of our trading prices, or an offer of, or solicitation for a transaction in any financial instrument and thus should not be treated as such. The information provided does not involve any specific investment objectives, financial situation and needs of any specific person who may receive it. Please be aware, that past performance is not a reliable indicator of future performance and/or results. Past Performance or Forward-looking scenarios based upon the reasonable beliefs of the third-party provider are not a guarantee of future performance. Actual results may differ materially from those anticipated in forward-looking or past performance statements. IC Markets makes no representation or warranty and assumes no liability as to the accuracy or completeness of the information provided, nor any loss arising from any investment based on a recommendation, forecast or any information supplied by any third-party.
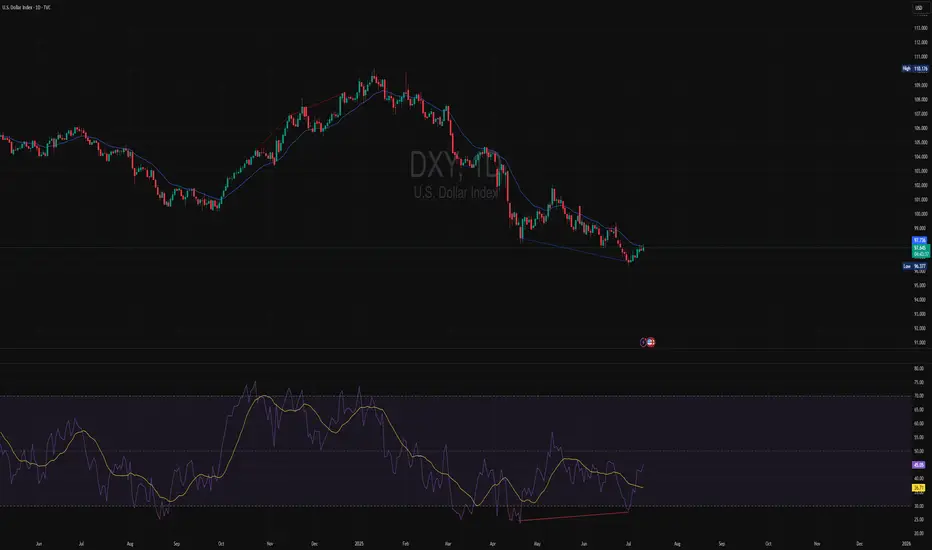
DXY-Technical Analysis DAILY Timeframe 📊 DXY – Technical Analysis (1D Timeframe)
🔷 Overall Trend:
The Dollar Index (DXY) has been in a strong downtrend for several months, forming multiple confirmed Breaks of Structure (BOS) to the downside.
However, recent price action is showing signs of momentum loss and potential exhaustion from sellers near the current lows.
🟡 Market Structure:
Price recently formed a lower low, but momentum indicators are showing bullish divergence — suggesting the downward pressure is weakening.
A small bullish reversal candle has printed, indicating potential short-term buying interest.
There is no confirmed bullish CHoCH yet, but structure is starting to slow down and compress — signaling a possible shift.
📉 Indicators (RSI ):
RSI is rebounding from oversold territory, showing potential early reversal signals.
The confirms bullish divergence and shows fading bearish momentum.
Overall, sellers are showing reduced strength, increasing the chance of a corrective move to the upside.
🔹 Key Levels:
Immediate resistance zones:
🔹 97.23 and 97.73 — key levels to watch for bullish continuation.
Major support:
🔻 96.34 – 96.50 — current low area that if broken, will confirm further downside.
✅ Conclusion:
While DXY remains structurally bearish, the recent bullish divergence, loss of selling momentum, and RSI recovery suggest the potential for a short-term correction or bounce.
A confirmed CHoCH and break above 97.73 would signal a potential shift to bullish structure.
If price fails to break resistance and drops below 96.34, the bearish trend is likely to continue.
🟢 Scenario Table:
Scenario Trigger Implication
Bullish shift Break above 97.73 with CHoCH Potential trend reversal
Continuation bearish Break below 96.34 Downtrend continuation
Disclaimer: This analysis is for informational and educational purposes only. It does not constitute financial advice or a recommendation to buy or sell any asse