ridethepig | FTSEMIB📍 This diagram comes after the conversation with @lu1977hk, and is no more imaginative than the positional flows across the global equity board.
In Italian Equities the initial offensive targets for sellers come in at 18,466; 17,643 and 16,819 from a "fibs perspective". The connection of further downside in European and Global Equities is more or less the same sort of difficulty all round. Think of this like a composer trying to adapt the pianist to enter into the full orchestra. FTSEMIB shorts are another to add to the basket.
French Equities:
German Equities:
Eurostoxx:
The theme appears to be across the board on an epic level, with the whole series of European markets in a downwards move towards support. In reality, however, this manoeuvring shakeout is going to be strategically important from a positioning perspective for when we are loading the lows (we will cover that later in 2021).
Thanks as usual for keeping the feedback coming 👍 or 👎
FTMIB trade ideas


Italy40 - Long - 8hr TFOverall bullish trend, but weakening as it hits resistance.
Wait for price to retrace to resistance and enter on bullish reversal candle.


FTSE MIB - next probable target below 17,000FTSE MIB continues on its way down to new lows. In the shorter term view, it seems to have finished, or nearly so, minute counter-trend wave 2. The next move should be minute 3, where the most probable target is is below 17,000. If prices crosses up 20,400, this analysis should be reviewed. FOLLOW SKYLINEPRO TO GET UPDATES.


FTSE MIB - tracing last leg of counter trend rallyFTSE MIB seems to be tracing intermediate wave (C ) up that will complete primary wave 2. Most probable target before the trend is reversed lyes in the range 20,350 - 21,200. A move below 17,600 would indicate the trend already reversed. FOLLOW SKYLINEPRO TO GET UPDATES.


That would be all, short Italian index by level and RSIThat would be all, short Italian index by level and RSI


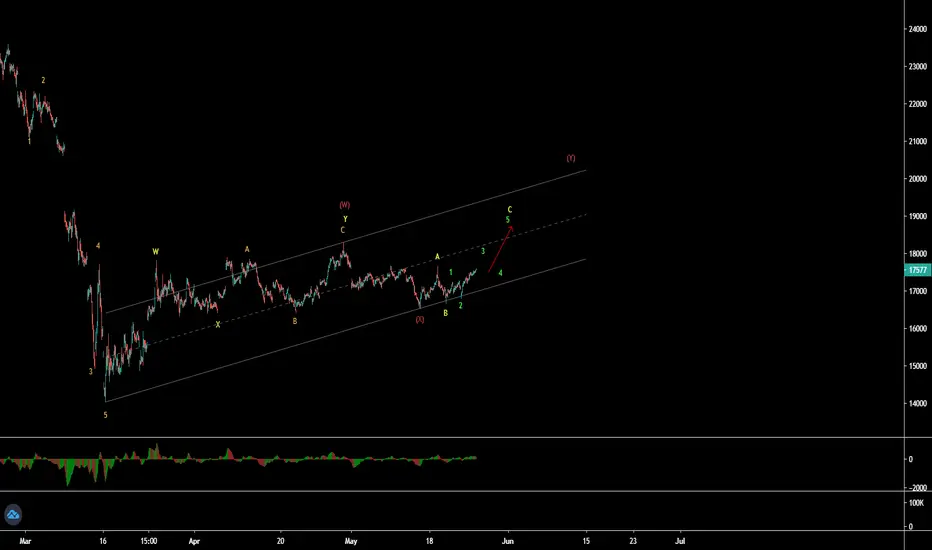
IT40 Index (FTSE MIB - Italy) - WXY wave patternIT40 Index (FTSE MIB - Italy) is in WXY wave corrective up in 60 min time frame. As shown in chart wave W & X divided in ABC wave pattern, so Y will be complex wxy wave. The volume is increasing in Y wave up, which can easily drive it upward. In weekly time frame, it was in corrective ABC up and down wave as shown in chart. The last drop was C wave down, which complete the down correction.
IT40 - Is Italy going to see another wave down? The Pandemic is not over yet.
But the decline of the Italian stock market has stalled a little.
Are we going to see further declines?
The Chaos Indicates towards a higher chance of a Wave 5 Down.
If it breaks below the box, it is quite possible that it might drop to test the previous lows
Followed by Target 2 which is TZ1 @Fib Exp [ 1.62


TA on Italian IndexThe market divergence between European and American stocks just let me think that some countries in Europe will underperform. Besides I just identify a selling signal in Italian stock market and even if it is not the case, the timing seems to be perfect.

FTSE MIB (IT40) - Updated EW count FTSE MIB (IT40) is now in C wave down. ABC wave will complete Y wave major down as similar as in IBEX.
