Gold/Silver Ratio breakdown.Traders, we have a breakdown in the gold to silver ratio. If this holds and is not a fake out, silver is heading a lot higher. I will keep you posted.
GOLDSILVER trade ideas

GOLD/SILVER ratioA sideways B of B wave is almost complete and a violent C of B may be next. A breakup on GSR would likely be larger drawdown in metals.
If the GSR breaks down, it's very bullish for metals, but right now momentum looking like it wants to go up.

Gold/Silver Ratio will Break the 375-day Triangle Pattern SoonGold/Silver Ratio will break the 375-day Triangle Pattern soon. There was a false breakout to the upside last week. Price couldn't break the trend line. Gold/Silver Ratio is expected to go down.
Formed Patterns : Shooting Star Candlestick Pattern, Rising Wedge Pattern, Double Top Pattern on the momentum indicator.
Scenario 1 : Gold/Silver Ratio quickly goes to 76 levels.
Scenario 2 : Gold/Silver Ratio hits 81.58 and retreat to the 86. And then goes to 76.

G/S Ratio Breaks Out. Bearish for Gold & SilverThe Gold-Silver ratio, which represents the number of ounces of silver required to purchase one ounce of gold, is currently showing a bearish trend. This is evident from the ratio breaking its 19-day chart, indicating a significant shift towards bearishness for precious metals. This trend suggests that the market may experience many months of downside, which could lead to a considerable decline in the prices of gold and silver. Investors may want to exercise caution and consider diversifying their portfolios in light of this trend.
I am shorting silver.

Gold silver ratio is at crossroadsBreak below trend line may spark a rally in precious metals and even may mean that bear market in precious metals may be over

Gold-Silver Ratio: Apex Reversal suggests strong downsideAfter an initial upside breakout of the gold silver ratio, it seems like an around the apex move is imminent, which will result in a sharp drawdown.

GOLDSILVER RATIO, Moving In Downtrend-Channel, More To Come! Hello, Traders Investors And Community, welcome to this analysis about the gold-silver ratio, its current price-action, and what we can expect the next time. In my observation, I found some significantly sings in the chart which will affect the ratio fundamentally farther the next days and weeks. The goldsilver ratio is an important ratio to track the number of silver ounces compared to one ounce gold, therefore, it is providing important information about the value between silver and gold. I made already the analysis of gold and silver, if you didn't saw these already I recommend to you that you go to my account and have looked to have a full-depth-overview of the analysis in the gold-silver ratio and its interrelation to gold and silver.
When looking at my chart you can see that the ratio is trading in a huge and fundamental downtrend-channel which you see marked in blue. We already touched the channel lower and upper boundary several times to form the overall downtrend-related channel. At the moment the ratio fell down from an important support-point at the 109 level, you can see this big red candle to the downside with high volatility it is suggesting that the ratio is turning to the downside here and that we will continue in the downtrend-channel until important support has reached.
The next time we can expect a bounce back to the 109 support/resistance level where the likelihood increases that the downtrend continues when the huge heavy bearish-confluence-cluster zone you can see in my chart is confirmed. We have several resistances there which building the logical resistance-level, first it is the 50-EMA which you see marked in blue, second, it is the 109 support/resistance level and third, it is the upper boundary of the falling downtrend-channel, therefore, I don't expect a breakout of the channel here so far and the rise to the downside will continue.
In this situation it has to keep in mind that the worth fullness of silver compared to gold rises, this is insightful because at the moment we see more volatility to the upside and sharp rises in silver than in gold, it also means that the value of silver can increase higher and gold gets cheaper compared to silver which is an indication for the bullishness I mentioned already in the silver-analysis. Investors and traders can take advantage of it when the ratio drops more to buy silver instead of gold or to exchange the gold for silver for a later exchange back when the ratio increases again. This should be a good opportunity to make a profit out of the situation with gold and silver.
Alright, this should give you a good overview, thanks to everybody for watching, support for more market insight, and all the best!
The ambition to transform opportunity into gold remains the most significant tool for a trader.
In this manner: FAREWELL
Information provided is only educational and should not be used to take action in the markets.

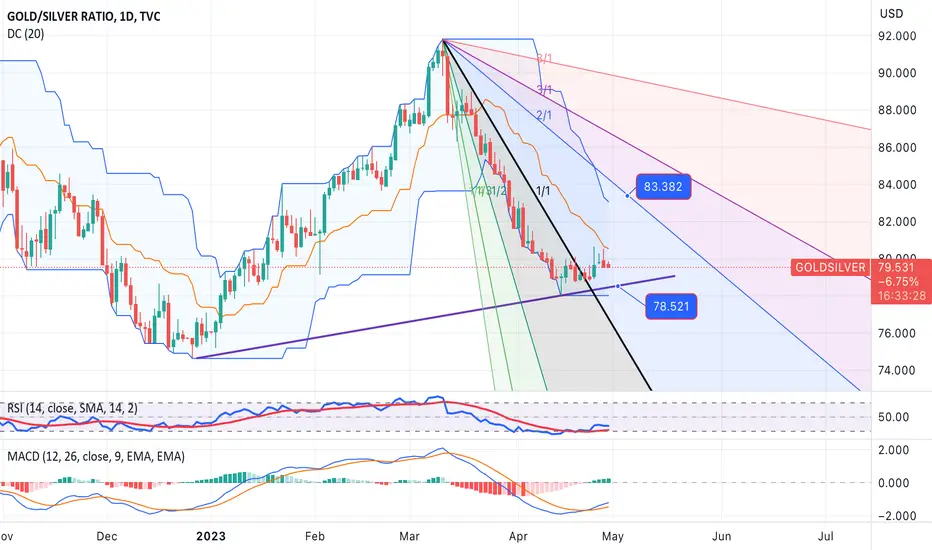
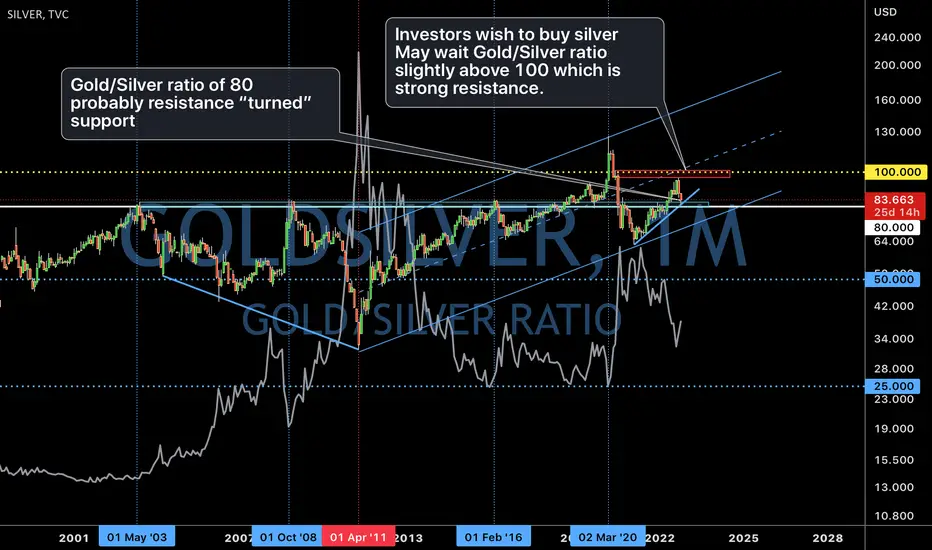
Gold/Silver RatioGold/Silver ratio chart. When gold/silver ratio exceeds 80, there will be a buying opportunity for silver.

GOLDSILVER ratio- BUY strategyThe GOLDSILVER ratio is low, and MACD being positive right now, and a low RSI suggest this being a reasonable trade to look at.
The strategy is to BUY GOLD vs. SILVER in of course measured equal USD values and take profit for the ratio @ 82.75 for now. Place stop-loss below 78.25 for now.
The Fateful Golden Candles of 22 and 23Hey everyone!
In the previous idea that I made on December 30 last year. I stated that a gold candlestick in the green zone determines the goldsilver price trend in 2022 and based on that I expected a zigzag and bullish price in 2022 for goldsilver.
But what to expect in 2023?
The trend of the candles indicates the fall of this index toward Fibo 78.6 and Fibo 100 .the detail is shown in the this Idea.
2023 is generally a very good year for the stock market and gold.


Gold / Silver and what it means for SilverSilver is losing to gold as it has been for months, but we're getting close to the gold/silver ratio of 98-100 area. At that point this chart should reverse which likely means - Gold starts getting a bid and Silver starts to outperform Gold. So yeah this ongoing dip might be the one to buy for long term, but keep in mind this can go on for a few more months.


Gold silver ratio Renko Watching the CCI 89 and ribbon dance, will it repeat ? will see. Signals were there from yrs back.

GOLDSILVER - Keep an eye on GOLD:SILVER ratio and place your betGOLDSILVER seems to have fallen into approximate Bollinger Band behaviour over the past months.
One cannot say it has exactly as there are always exceptions.
However, a triple crossover of the upper band is a fairly strong indicator that a down tick is imminent.
So either gold will fall or silver will rise. It is for you to decide and place your bets...
As always cross-check with other indicators.
Good Luck
Goldybug


Gold/Silver Ratio 1MThe Gold/Silver ratio has had a significant run from April 2011 to March 2020. Pushing the price of gold much higher than Silver.
Although this is a very boring chart to keep watch of, currently price action is holding support at the 81 zone. However, the RSI is holding a more critical support at 50.
While measuring the SRSI, momentum seems to favour the downside.
Perhaps some much needed re-balancing is in our lucky stars for Silver.

How to “invest” silver with gold/Silver ratio. 6/Oct/22Gold/Silver chart ratio normally used by hedge fund to “Swift” within “Silver” or “ Gold” assets. They usually “treat” ratio of >=100 as buy silver instead of gold vice versa for below <= 50..Instead of follow 50-100 rules. Traders could “read” gold/ratio chart spotting where its “support/resistance” located and decide to “hold” silver or gold.
Silver should outperform gold. Gold/Silver ratio predicts silver should outperform gold. Bearish engulfing candle last month at fibonacci 50%.

Gold should continue to outperform Silver!Conviction: 5/5 LT, 3/5 MT
long-term (multi-year) positive
near-term (this year): neutral
performance of OANDA:XAUUSD relative to OANDA:XAGUSD looks pretty good, but approaching resistance line.
also, recently had bullish divergence on RSI-W in mid-2020.

Silver Boom - $GOLD & $SILVERI'm long term bullish on both gold and silver. With rates rising in the short term, ehh idk, but that's not the purpose of this post and real interest rates are still largely negative.
Disregarding the spike in the gold/silver ratio in 2020, the gold to silver ratio is at all time highs. Silver has proven in the past to be a potentially better hedge against inflation over gold, although both are good. Silver has legitimiate real world applications as well.
Considering the state of the world and US conditions, I love gold and silver in the medium and long term as a way to hedge against major instability.
Good luck people, protect yourself with some real money in Gold/Silver at least some....
- C

just getting started.Our weekly hammer, as of the morning of June 3, is only 1/4 of the way down between Bollingers. Daily has an engulfed candle. I think it's bearish.
