Housing Index, That There Look Identical Weak housing sector looking to return to Optimal trade Entry and then giving up the ghost.
Related indices
Double peak every time rates peak - Housing downturnNot short yet, expecting something to happen in the next ~6 months. Housing could get cheaper soon. Double top pattern has been consistent in the past.
The Philadelphia Stock Exchange (PHLX) Housing Sector Index (HGX) tracks housing development companies in the U.S. construction market. HGX began

Housing crash!The Philadelphia Stock Exchange (PHLX) Housing Sector Index (HGX) tracks housing development companies in the U.S. construction market. HGX began trading in July 2002 with an initial value of 250. Trading on the Nasdaq, the index calculates its value using the price return index and the total return

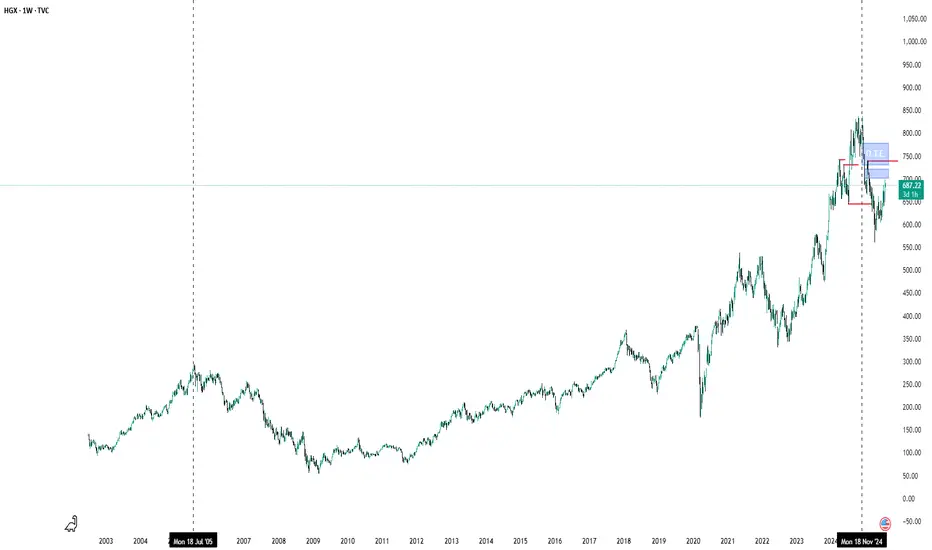
HGX Weekly -- Housing is at a critical junctureAfter a double top, and what appears to be a double bottom, Philadelphia Housing Index sits right on the 50% fib and just on the top edge of the cloud resistance. It is near the 1.27% Gartley extension (point B to D).
Encouraging is the strengthening 12 week RSI (yellow highlight). Next few weeks

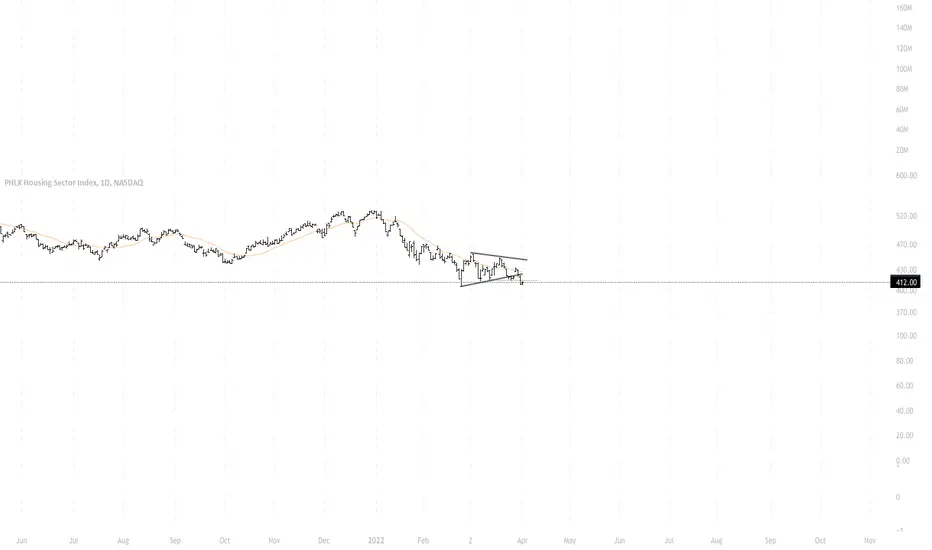
Looking for Short PHLXHi Everyone,
I'm waiting for Short if the break break the trend-line.
Good Bye & Good Trading!!!

Housing. Short and ShorterFed Chair Powell not seeing a recession? Myopic view of the unemployment rate is his gauge? Take a look at one of the biggest recession indicators -- housing. Double top, head and shoulders. It's going to get ugly.

Huge beatdown for the the U.S. HGX. I will be tracking this to see if we make a continued move down. Very interesting market conditions as well as the double top we saw over the last year. How much lower do you think we can go? 33% down since the end of 2021. Will we see a reversal?

HGX Realestate Housing Bubble 2008.2Here's the monthly chart on this housing index. I have no idea what I am charting but it looks like the index is moving with the recent major events such as FED increasing rates finally, everyone is FOMO into buying a house and everyone and their grandmother are becoming real-estate agents haha. FED

HGX 1MThe PHLX Housing Sector Index (HGX) is a modified market capitalization-weighted index composed of companies whose primary lines of business are directly associated with the U.S. housing construction market.
The Index began on January 2, 2002 at a base value of 250.00; options commenced trading on J

See all ideas
Summarizing what the indicators are suggesting.
Oscillators
Neutral
SellBuy
Strong sellStrong buy
Strong sellSellNeutralBuyStrong buy
Oscillators
Neutral
SellBuy
Strong sellStrong buy
Strong sellSellNeutralBuyStrong buy
Summary
Neutral
SellBuy
Strong sellStrong buy
Strong sellSellNeutralBuyStrong buy
Summary
Neutral
SellBuy
Strong sellStrong buy
Strong sellSellNeutralBuyStrong buy
Summary
Neutral
SellBuy
Strong sellStrong buy
Strong sellSellNeutralBuyStrong buy
Moving Averages
Neutral
SellBuy
Strong sellStrong buy
Strong sellSellNeutralBuyStrong buy
Moving Averages
Neutral
SellBuy
Strong sellStrong buy
Strong sellSellNeutralBuyStrong buy
Displays a symbol's price movements over previous years to identify recurring trends.
Frequently Asked Questions
The current value of PHLX Housing Sector is 700.02 USD — it has risen by 0.43% in the past 24 hours. Track the index more closely on the PHLX Housing Sector chart.
PHLX Housing Sector reached its highest quote on Oct 18, 2024 — 837.18 USD. See more data on the PHLX Housing Sector chart.
The lowest ever quote of PHLX Housing Sector is 54.31 USD. It was reached on Mar 6, 2009. See more data on the PHLX Housing Sector chart.
PHLX Housing Sector value has increased by 3.81% in the past week, since last month it has shown a 7.02% increase, and over the year it's decreased by −5.09%. Keep track of all changes on the PHLX Housing Sector chart.
PHLX Housing Sector is just a number that lets you track performance of the instruments comprising the index, so you can't invest in it directly. But you can buy PHLX Housing Sector futures or funds or invest in its components.