‘Everything Rally’ in Full Swing. What About Tariffs & Earnings?It’s official: we’re witnessing one of those rare, confounding moments when nearly every big risk-on thing is screaming ATH! (All-Time High, for those who haven’t worn out that abbreviation on X this month).
Bitcoin BITSTAMP:BTCUSD blew past $122,000 on Monday — a turbo rally that made anyone who
About US Composite Index
The Nasdaq Composite Index is the market capitalization-weighted index of approximately 3,000 common equities listed on the Nasdaq stock exchange. The types of securities in the index include American depositary receipts, common stocks, real estate investment trusts (REITs) and tracking stocks, as well as limited partnership interests. The index includes all Nasdaq-listed stocks that are not derivatives, preferred shares, funds, exchange-traded funds (ETFs) or debenture securities.
Related indices
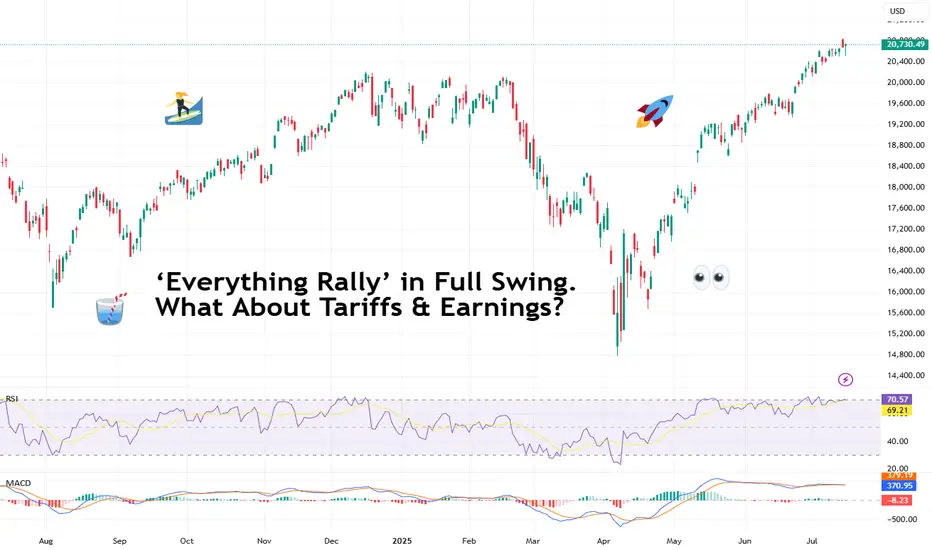
The Nasdaq Composite Is at a Record. What Does Its Chart Say?The Nasdaq Composite NASDAQ:IXIC has set multiple new all-time highs in recent weeks, but what does its chart say might happen next?
Let's check it out, starting with the IXIC's year-to-date chart as of Thursday afternoon:
Readers will note that the Nasdaq Composite bottomed out on April 7, sh

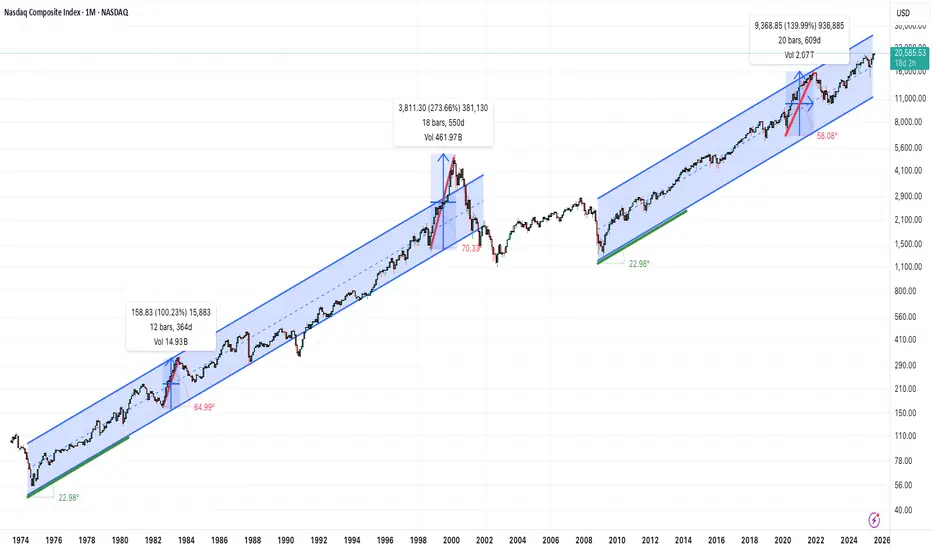
Is the Nasdaq in a bubble?On the monthly timeframe, there are no signs of an over-extended, parabolic condition for the Nasdaq Composite(IXIC).
It's interesting to note that for a 25 year period from 1974 to 1999 the overall trend was roughly a positive 23 degree angled climb. We see that again in the current 16 year tre
Nasdaq: Momentum Backed by AI, But Caution WarrantedThe Nasdaq Composite closed at 19,714.99 on June 10, extending its rally to three straight days. This rise is underpinned by three key factors: strong AI-led earnings, a supportive macro backdrop, and bullish technical patterns.
1. Fundamentals: AI Fuels Earnings
Top tech firms like NVIDIA (Q1 r

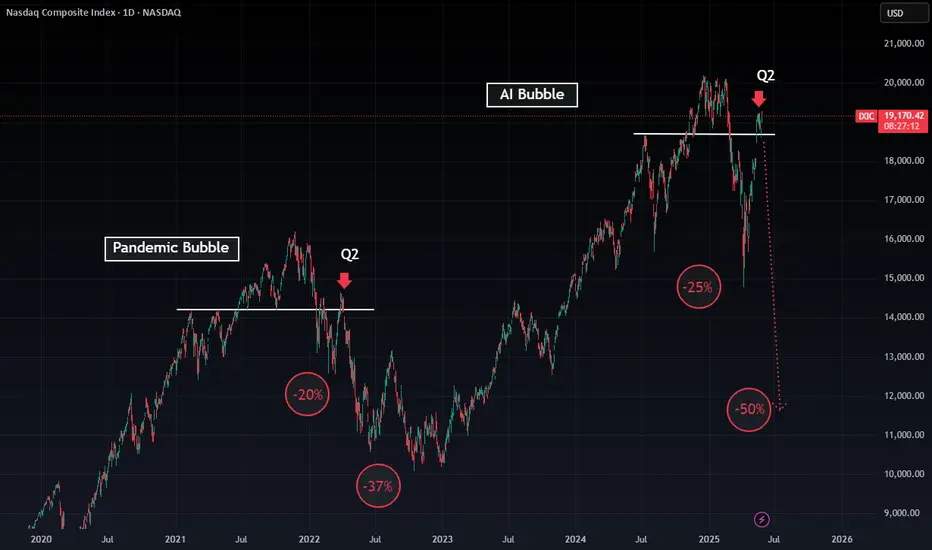
Nasdaq Composite – Deja Vu All Over Again🐂 Bulls are like parents – they can watch the same movie over and over and never remember the ending.
Look at the Nasdaq Composite:
Pandemic bubble? Popped.
Q2 peak? Drop.
AI bubble? Feels like we’re on repeat.
📉 The last times we had these setups, we saw:
A 20% drop, then a 37% cascade.
Now?
NASDAQ is likely building a massive H&SWe’re very likely seeing the development of a H&S reversal pattern on the NASDAQ.
Completion of the right shoulder is likely to take place over the next 2-4 weeks, especially when the impact of tariffs starts to become more pronounced through macroeconomic data and continued port volume shrinkage.

Nasdaq preparing for another down move?Interesting chart of the Nasdaq (IXIC). You can see at the high we had the negative sell divergence with price triple topping, while the OP kept going to new highs (as shown by red arrows), with an overbought Technometer as shown by red dot. This showed selling behind the scenes.
We then get to

Trump's Second Term Brings Sharpest Market Decline Since 2001It's gone nearly three months or so... (Duh..? WTF.. less than 3 months, really? 🙀) since Donald Trump entered The White House (again).
Those times everyone was on a rush, chatting endless "Blah-Blah-Blah", "I-crypto-czar", "crypto-capital-of-the-world", "we-robot", "mambo-jumbo", "super-duper", AI

IXIC Down leg to 15700IMHO,
I see the Nasdaq dropping to 15700 during the current down leg.
Bear flag has been broken.

IXICTraders: Might look to buy near red support levels and sell near green resistance levels, anticipating reversals at these key points.
Breakouts: If the index breaks through a green resistance level with high volume, it could indicate a potential upward trend continuation. Conversely, breaking below

See all ideas
Summarizing what the indicators are suggesting.
Oscillators
Neutral
SellBuy
Strong sellStrong buy
Strong sellSellNeutralBuyStrong buy
Oscillators
Neutral
SellBuy
Strong sellStrong buy
Strong sellSellNeutralBuyStrong buy
Summary
Neutral
SellBuy
Strong sellStrong buy
Strong sellSellNeutralBuyStrong buy
Summary
Neutral
SellBuy
Strong sellStrong buy
Strong sellSellNeutralBuyStrong buy
Summary
Neutral
SellBuy
Strong sellStrong buy
Strong sellSellNeutralBuyStrong buy
Moving Averages
Neutral
SellBuy
Strong sellStrong buy
Strong sellSellNeutralBuyStrong buy
Moving Averages
Neutral
SellBuy
Strong sellStrong buy
Strong sellSellNeutralBuyStrong buy
Displays a symbol's price movements over previous years to identify recurring trends.
Frequently Asked Questions
The current value of US Composite Index is 21,108.32 USD — it has risen by 0.24% in the past 24 hours. Track the index more closely on the US Composite Index chart.
US Composite Index reached its highest quote on Jul 18, 2025 — 20,980.56 USD. See more data on the US Composite Index chart.
The lowest ever quote of US Composite Index is 54.87 USD. It was reached on Oct 3, 1974. See more data on the US Composite Index chart.
US Composite Index value has increased by 0.71% in the past week, since last month it has shown a 5.47% increase, and over the year it's increased by 21.64%. Keep track of all changes on the US Composite Index chart.
US Composite Index is just a number that lets you track performance of the instruments comprising the index, so you can't invest in it directly. But you can buy US Composite Index futures or funds or invest in its components.