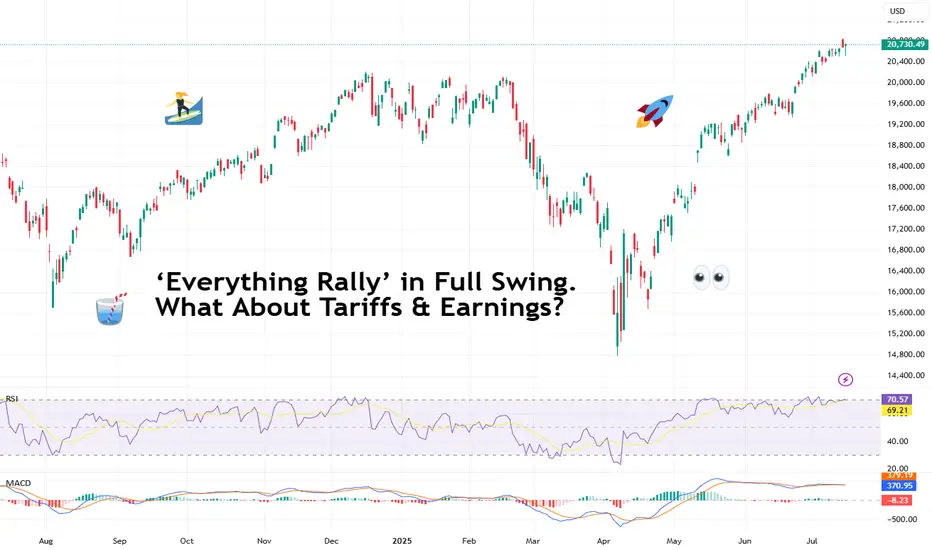
‘Everything Rally’ in Full Swing. What About Tariffs & Earnings?It’s official: we’re witnessing one of those rare, confounding moments when nearly every big risk-on thing is screaming ATH! (All-Time High, for those who haven’t worn out that abbreviation on X this month).
Bitcoin BITSTAMP:BTCUSD blew past $122,000 on Monday — a turbo rally that made anyone who stepped away to brew coffee rethink their life choices.
Meanwhile, Nvidia NASDAQ:NVDA ? It didn’t just approach the $4 trillion milestone — it showed up, took the crown as the world’s most valuable company , and made the Nasdaq Composite NASDAQ:IXIC pop a fresh record close for dessert.
And the S&P 500 SP:SPX ? The broadest slice of US equities did its part too, hitting a record high last week, despite the world’s loudest tariff chatter from Trump 2.0. So, what gives?
💎 Bitcoin: Too Fast to Chart
Let’s start with the fire-breathing dragon. Bitcoin BITSTAMP:BTCUSD rocketed to $122,500 on Monday morning, bruising all those short sellers and juicing up the memes. The OG coin now has a market cap above $2.3 trillion — bigger than most economies, enough to make gold bugs break into cold sweats. (True, it did pare back some of those gains to float at $119,000 Thursday morning.)
What’s fueling it? Institutional FOMO. Forget diamond hands — big money managers, ETF behemoths , and corporates are scooping up every sat they can find.
When you see that, plus macro tailwinds — a weaker dollar, simmering inflation that nudges the Fed toward cuts — the rocket fuel writes itself. But we all know what traders really want to know: is $125,000 next? Short answer: if momentum holds, you bet. Long answer: mind the next Fed move and the tariff chess match.
🎯 Nvidia: From GPUs to GDPs
If you thought Bitcoin’s wild run was the only headline, look again. The real flex this month came from Jensen Huang’s chip juggernaut. Nvidia NASDAQ:NVDA didn’t just break a record — it basically invented a new category for corporate mega-caps.
The world’s biggest semiconductor firm hit the $4 trillion mark — the first company ever to do so. And this isn’t some overnight fad. Back in 2019, Nvidia crossed $100 billion for the first time on the back of crypto mining booms.
Five years later, it’s stacked on 4,000% gains, riding the AI hype like it’s a permanent bull market. Governments, hyperscalers, cloud titans — they’re all shoving billions at Huang’s AI chips.
💻 Nasdaq: AI, Chips, Crypto — Party On
The Nasdaq Composite NASDAQ:IXIC logged yet another record close , up about 7.5% on the year so far.
Just three months ago, this index looked battered — trade war threats, tariff rants, sticky inflation. Who’s doing the heavy lifting? The Magnificent Seven, mostly. But it’s Nvidia’s chart that’s turned this whole index into a de facto AI ETF.
Is it healthy? That depends. As long as earnings season doesn’t break the dream — and there’s no rug-pull from the Fed — traders are letting the momentum do its thing.
🏦 S&P 500: The Record Chaser
What about the S&P 500 SP:SPX — the broadest barometer of America’s corporate muscle? It rose to set its own record high last week before coming down on Friday on renewed tariff jitters.
The Wall Street darling looks less explosive than its tech-packed peer, the Nasdaq. But it’s still up nearly 7% year-to-date — and up 26% from the April dip when tariffs spooked everyone out of their leveraged longs. Now? It’s back in record territory, brushing aside GDP contraction and inflation that won’t quit.
Why? Because the market is forward-looking. Tariffs may sting, but when the Fed hints at cuts and Trump sticks to his MAGA narrative, risk assets catch a bid.
🧨 What About Those Tariffs, Though?
Speaking of tariffs, let’s not pretend they’re not looming. Trump threatened over the weekend to ramp up levies on EU goods to 30% starting August 1 if no new deal emerges. Canada got an earful too: 35% on certain Canadian exports — and Ottawa announced a $21 billion tit-for-tat.
The “pause” on reciprocal tariffs ends in a few weeks. So, is this noise or real risk?
For now, markets are calling the bluff. Investors have tuned out the saber-rattling, choosing to front-run the Fed’s next move instead. If tariffs spark a deeper trade war, stocks may get a reality check. Until then, the melt-up rules.
🔮 What’s Next? Eyes on Earnings
Earnings season is around the corner (be sure to follow the Earnings Calendar ), and you can bet every fund manager is watching Nvidia NASDAQ:NVDA , Microsoft NASDAQ:MSFT , and the rest of the Mag 7 for cracks in the AI gold rush.
If the big names keep printing double-digit revenue growth, investors should be happy. But any hint of deceleration, cautious guidance, or margin pressure could slam the brakes on this record run.
Your turn : Do you see this melt-up stretching into the second half of the year? Or are we due for a rude awakening once the earnings calls roll in? Drop your take below!
IXIC trade ideas
The Nasdaq Composite Is at a Record. What Does Its Chart Say?The Nasdaq Composite NASDAQ:IXIC has set multiple new all-time highs in recent weeks, but what does its chart say might happen next?
Let's check it out, starting with the IXIC's year-to-date chart as of Thursday afternoon:
Readers will note that the Nasdaq Composite bottomed out on April 7, shortly after President Donald Trump's "Liberation Day" tariff announcement.
However, the index, which consists of more than 2,500 companies listed on the Nasdaq Stock Market, has pretty much been in rally mode ever since. Can that continue?
Well, the chart above shows what's known as an "inverted head-and-shoulders" pattern of bullish reversal, marked with purple curving lines.
This pattern's "neckline" (denoted by the dotted purple line above) illustrates a pivot at just about 18,029 vs. the record 20,895.66 that the Nasdaq Composite closed at on Friday.
Readers will see that this neckline acted sort of like a springboard when it was triggered back on May 12.
The Nasdaq Comp also took back its 21-day Exponential Moving Average (or "EMA, marked with a green line) in late-ish April, then its 50-day Simple Moving Average (or "SMA," marked with a blue line) on April 30. This presumably forced portfolio managers to increase their long-side exposure.
Next, the Nasdaq Comp retook the even-more-important 200-day SMA (the red line above) during the index's May 12 breakout.
Readers will also see that the index benefited algorithmically in late June what's called a "golden cross." That occurs when a stock's 50-day SMA crosses above its rising 200-day SMA.
Meanwhile, a Raff Regression model (shaded in orange and tan at the chart's right) shows that Nasdaq Composite has stayed with the uptrend in place since its April bottom. And as an old Wall Street saying goes: "The trend is your friend."
Net result: Here we are in mid-to-late July and the index is still trading at or near all-time record highs.
Will it be smooth sailing from here?
Well, there's a lot to consider before saying that. First, second-quarter earnings season has just started, and how it plays out could heavily impact the Nasdaq Composite.
Second, the war of wills between Trump and Federal Reserve Chairman Jerome Powell seems to be a growing issue. And while tariffs have yet to noticeably slow down corporate margins, impact inflation or damage labor markets, there's no way to know if we're out of the woods there.
Meanwhile, the Nasdaq Composite is also facing some less-rosy technical indicators.
For example, the index's Relative Strength Index (the gray line at the chart's top) is now in technically overbought territory. That doesn't necessarily mean the index will sell off from here, but it does mean that investors should be more alert to that possibility.
Also note that the Nasdaq Composite's Moving Average Convergence Divergence indicator (or "MACD," marked with blue bars and gold and black lines at the chart's bottom) is flashing some mixed signals.
The histogram of the 9-day EMA (the blue bars) is running below the zero-bound, which is typically a short-term bearish sign.
That said, the 12-day EMA (the black line) and 26-day EMA (the gold line) are both running well above zero, which is technically positive.
However, while the two lines have been running together for about six weeks now, should the 26-day line cross above the 12-day one, that would historically represent another bearish signal for the Nasdaq Composite.
Add it all up and the Nasdaq Comp's technical picture looks bullish in historical terms.
The above chart appears to signal not long-term weakness, but potential opportunities in both the short- and medium-term future.
That's probably going to remain true until it isn't, right?
(Moomoo Technologies Inc. Markets Commentator Stephen “Sarge” Guilfoyle had no position in Nasdaq Composite-related ETFs or mutual funds at the time of writing this column.)
This article discusses technical analysis, other approaches, including fundamental analysis, may offer very different views. The examples provided are for illustrative purposes only and are not intended to be reflective of the results you can expect to achieve. Specific security charts used are for illustrative purposes only and are not a recommendation, offer to sell, or a solicitation of an offer to buy any security. Past investment performance does not indicate or guarantee future success. Returns will vary, and all investments carry risks, including loss of principal. This content is also not a research report and is not intended to serve as the basis for any investment decision. The information contained in this article does not purport to be a complete description of the securities, markets, or developments referred to in this material. Moomoo and its affiliates make no representation or warranty as to the article's adequacy, completeness, accuracy or timeliness for any particular purpose of the above content. Furthermore, there is no guarantee that any statements, estimates, price targets, opinions or forecasts provided herein will prove to be correct.
Moomoo is a financial information and trading app offered by Moomoo Technologies Inc. In the U.S., investment products and services on Moomoo are offered by Moomoo Financial Inc., Member FINRA/SIPC.
TradingView is an independent third party not affiliated with Moomoo Financial Inc., Moomoo Technologies Inc., or its affiliates. Moomoo Financial Inc. and its affiliates do not endorse, represent or warrant the completeness and accuracy of the data and information available on the TradingView platform and are not responsible for any services provided by the third-party platform.

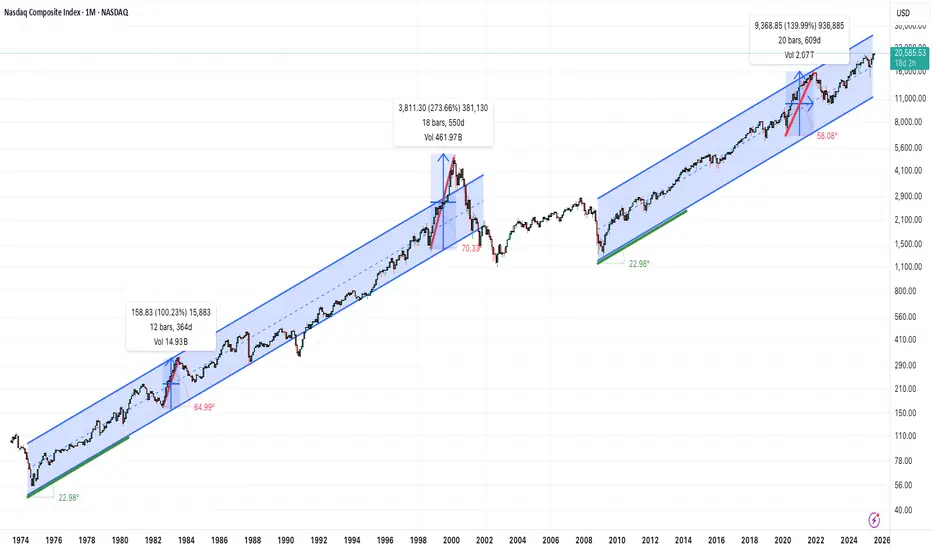
Is the Nasdaq in a bubble?On the monthly timeframe, there are no signs of an over-extended, parabolic condition for the Nasdaq Composite(IXIC).
It's interesting to note that for a 25 year period from 1974 to 1999 the overall trend was roughly a positive 23 degree angled climb. We see that again in the current 16 year trend that started in 2009.
Much steeper parabolic periods can be seen in shorter time frames like the 1998-2000 move, where the angle reached 70 degrees. That didn't end well. It's also worth noting that in 1982 and 2020 we saw similar behavior, though slightly less frothy. Both of those periods were also followed by significant retracements.
Maybe we are at the beginning of one of those multi-month, over-extended runs. But not seeing it today. If we are trading at 45,000 or more in 2026, that's a different story...
Nasdaq: Momentum Backed by AI, But Caution WarrantedThe Nasdaq Composite closed at 19,714.99 on June 10, extending its rally to three straight days. This rise is underpinned by three key factors: strong AI-led earnings, a supportive macro backdrop, and bullish technical patterns.
1. Fundamentals: AI Fuels Earnings
Top tech firms like NVIDIA (Q1 revenue: $44B+) and Broadcom are benefiting from the ongoing AI boom, driving the index higher. Even smaller firms like Duolingo (+53% YTD) are seeing outsized gains thanks to AI integration.
2. Macroeconomics: Stable Policy, Trade Hopes
The Fed’s steady rate policy (4.25–4.5%) is helping high-growth tech stocks maintain strong valuations. Meanwhile, improved U.S.–China trade sentiment has lifted investor confidence.
3. Technicals: Bullish Structure Holds
The Nasdaq 100 remains in a rising channel, trading above its 20-day moving average. Key levels to watch:
Resistance: 21,950–22,200
Support: 21,400 and 20,340
A breakout above 22,200 could open room for further upside.
Caution: Market Breadth is Narrow
Much of the rally is driven by a few mega-cap names—the “Magnificent Seven”: Apple, Microsoft, Alphabet, Amazon, NVIDIA, Meta, and Tesla. Their outsized influence means the index may rise even while broader market participation is weak.
Key Takeaways for Traders
AI-related earnings continue to fuel growth.
Rate stability supports tech valuations.
Market breadth is thin—watch for volatility if leadership stumbles.
Use technicals to time entries, but manage risk carefully.
Conclusion
While the Nasdaq’s rally is fundamentally and technically sound, narrow breadth adds fragility. Stay with the trend, but monitor signs of rotation or pullback closely.

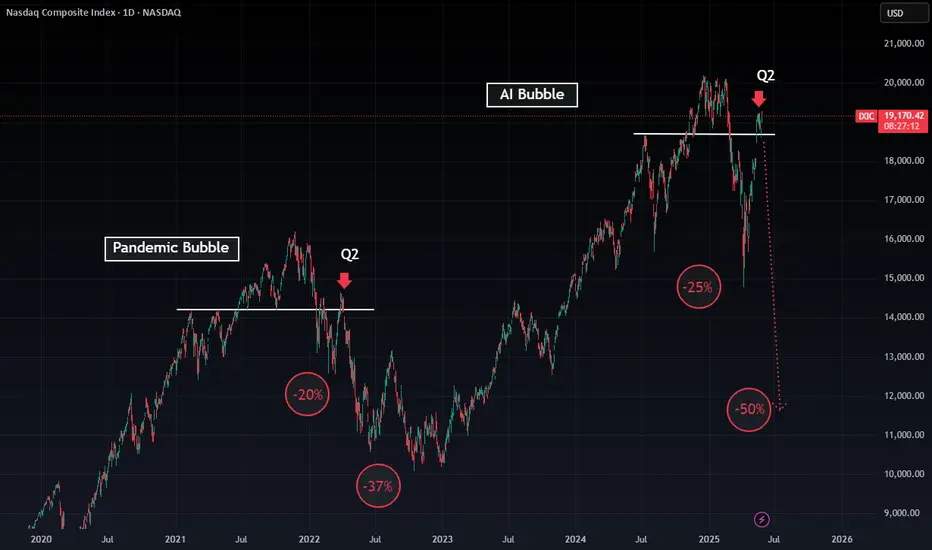
Nasdaq Composite – Deja Vu All Over Again🐂 Bulls are like parents – they can watch the same movie over and over and never remember the ending.
Look at the Nasdaq Composite:
Pandemic bubble? Popped.
Q2 peak? Drop.
AI bubble? Feels like we’re on repeat.
📉 The last times we had these setups, we saw:
A 20% drop, then a 37% cascade.
Now? A potential 25% drop just to revisit recent levels… or even -50% if the movie repeats the whole script.
🎥 Are we at intermission or is it the climax? The market’s about to decide.
Don’t let popcorn dreams blind you. Look at the chart and ask:
👉 Do I want to watch the same movie again, or leave early?
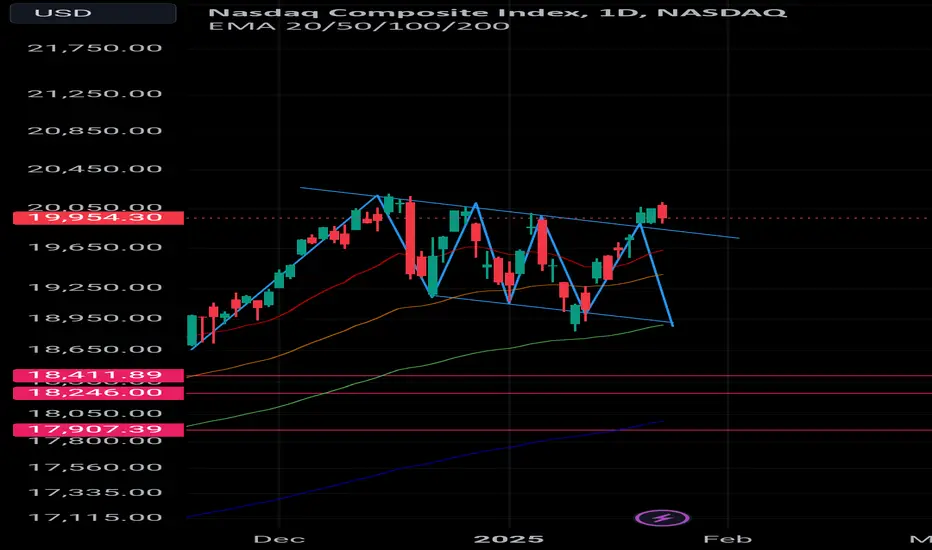
NASDAQ is likely building a massive H&SWe’re very likely seeing the development of a H&S reversal pattern on the NASDAQ.
Completion of the right shoulder is likely to take place over the next 2-4 weeks, especially when the impact of tariffs starts to become more pronounced through macroeconomic data and continued port volume shrinkage. The latter will create strong visuals for retail traders, further eroding consumer confidence.
The impacts of tariff negotiations on fundamentals are negligible. Even if agreements with all nations are inked today, 100% restoration of damaged supply chains would still be months away, particularly with China. A shift of the supply curve to the left is naturally inflationary. The resulting impact on Q2 earnings will likely be severe for many sectors as overhead/inventory costs will swell considerably.
The Fed has also signaled that relief via rate cuts will not happen, despite negative GDP growth, as long as inflation continues to climb. Given the inflationary nature of tariffs, it is highly unlikely we’ll see inflation reverse course in the near-to-intermediate term. Coupling this trend with continued negative GDP growth is the definition of stagflation.
If the above plays out, we should see additional growth to around 18,600 with decreasing volume, followed by a reversal that takes us to approximately 12,000. Continued macroeconomic deterioration could drag this even lower.

Nasdaq preparing for another down move?Interesting chart of the Nasdaq (IXIC). You can see at the high we had the negative sell divergence with price triple topping, while the OP kept going to new highs (as shown by red arrows), with an overbought Technometer as shown by red dot. This showed selling behind the scenes.
We then get to an oversold reading on the way down as shown by the green dot. But we continued lower which showed weakness, as we couldn't really even being oversold. The next rally was stopped in the same vicinity as the previous oversold reading (green dot), as shown by the second overbought (second red dot). This is showing that what should have been support, now turning into resistance. All this leads to another bout of selling....
We now have had another rally that takes us to our third overbought reading as shown by third red dot. We have had an a-b-c- rally off the lows, so if we turn down here once again it should lead to more selling.

Trump's Second Term Brings Sharpest Market Decline Since 2001It's gone nearly three months or so... (Duh..? WTF.. less than 3 months, really? 🙀) since Donald Trump entered The White House (again).
Those times everyone was on a rush, chatting endless "Blah-Blah-Blah", "I-crypto-czar", "crypto-capital-of-the-world", "we-robot", "mambo-jumbo", "super-duper", AI, VR and so on super hyped bullsh#t.
What's happened next? We all know.. mostly all US stocks and crypto markets turned to 'a Bearish Mode', or to at least to 'a Correction' (that is still actual at this time).
Here's a short educational breakdown for Nasdaq Composite index NASDAQ:IXIC what we think about all of that, at our beloved 💖 @PandorraResearch Team.
Trump's Second Term Brings Sharpest Market Decline Since 2001: Analyzing the recent 15% Stock Market Plunge
President Donald Trump's second term has coincided with a dramatic stock market downturn, with the S&P 500 losing approximately 15% of its value since his January 2025 inauguration. This represents the worst start to a presidential term since George W. Bush in 2001 during the dot-com crash. The decline has erased more than $3 trillion in market value, driven primarily by concerns over trade policies, particularly the implementation of new tariffs.
Market analysts point to growing fears of potential stagflation—a toxic combination of slow economic growth and high inflation—as investor confidence continues to deteriorate despite pre-election expectations of business-friendly policies.
Unprecedented Market Decline Under the New Administration
Historical Context of Presidential Market Performance
The current market downturn stands out in stark relief when compared to previous presidential transitions. The S&P 500 has fallen nearly 10% in the first 10 weeks since Trump's inauguration on January 20, 2025, marking the worst start under a new president since George W. Bush in 2001. This decline is significantly worse than the start of the prior five administrations, with Bush's roughly 18% drop during the dot-com crash being the only steeper decline in recent presidential history. Looking further back, only Richard Nixon experienced a comparable early-term market decline with a 7.2% drop, highlighting the severity of the current situation.
When examining presidential market performance metrics, Trump's second term has already distinguished itself negatively. During the first 50 days, the S&P 500 declined by 6.4%, positioning it among the poorest market starts since 1950. By contrast, the best 50-day starts were achieved by John F. Kennedy (up 9.4%), Barack Obama (up 5.7%), and Bill Clinton (up 4.2%), demonstrating how unusual the current market trajectory is in historical context.
Magnitude of the Current Decline
The scale of market value destruction has been substantial. More than $3 trillion has been erased from the S&P 500's value over approximately 52 trading sessions since Trump's inauguration. By early April 2025, the decline had accelerated to approximately 15% from Inauguration Day, pushing the market dangerously close to bear territory. Market analysts note that if the S&P 500 reaches a 20% decline from its recent peak, it would mark the earliest instance of a bear market during a new administration based on S&P 500 history since 1957.
The tech-heavy Nasdaq Composite has suffered even more severely, with declines exceeding 11% by mid-March. This demonstrates the particular vulnerability of growth stocks that had previously led market gains, now facing the most significant corrections.
Key Factors Driving the Market Downturn
Trade Policy Uncertainty and Tariff Concerns
Trade policy, particularly the implementation and threat of tariffs, has emerged as the primary catalyst for market turmoil. The unpredictable nature of these policies has created significant uncertainty for businesses, investors, and consumers alike. Trump's "on-again, off-again approach to tariffs" has effectively extinguished the optimism that initially buoyed markets following his election victory in November 2024.
The market decline accelerated dramatically after what was termed the "Liberation Day" event, during which Trump announced plans for unprecedented tariff escalation. Two-thirds of the S&P 500's 15% decline occurred after this announcement, prompting Ed Yardeni of Yardeni Research to observe that "Liberation Day has been succeeded by Annihilation Days in the stock market".
Fear of Stagflation and Economic Instability
Many economists have warned that the new tariffs could reaccelerate inflation at a time when economic growth may be slowing, creating conditions for stagflation. This combination is particularly concerning for investors, as it creates a challenging environment for corporate profitability and economic prosperity. The risk that tariffs could trigger this economic condition has effectively neutralized investor optimism regarding other aspects of Trump's agenda, including potential regulatory reforms and tax reductions.
Shift in Market Sentiment
The market has undergone a fundamental transformation in sentiment from the period immediately following Trump's election victory to the current environment. Initially, investors had bid stocks up to record highs, anticipating benefits from tax cuts, deregulation, and business-friendly policies. However, this optimism has been replaced by growing concern about economic direction.
As one market strategist noted, "We have witnessed a significant shift in sentiment. A lot of strategies that previously worked are now failing". The S&P 500 has relinquished all gains made since Trump's November 2024 election victory, representing a striking reversal in market confidence.
Potential Long-Term Implications
Historical Patterns and Future Outlook
Historical analysis suggests that poor market starts during presidential transitions often foreshadow continued challenges. According to SunDial Capital Research strategist Jason Goepfert, rough starts represent a "bad omen" for stocks based on past performance patterns. His analysis indicates that markets typically show a median return of -1.9% six months after such a start, and after a year, they generally remain flat. Among similar historical instances, only four out of ten cases resulted in more gains than losses over the following year.
Administration's Response to Market Decline
Unlike during his first term, when Trump regularly referenced strong stock market performance as evidence of his administration's success, his second-term approach appears markedly different. Some market analysts have noted that "The Trump administration appears to be more accepting of the market's decline, potentially even welcoming a recession to achieve their broader objectives". This shift in attitude has further unsettled investors who previously expected the administration to prioritize market stability.
Technical challenge
The tech-heavy Nasdaq Composite index has recently soared 12% for its best day since January 2001.
But did you know what happened next in 2001? The major upside trend as well as 5-years SMA were shortly broken and market printed extra 40 percent Bearish decline.
Similar with what's happening in 2025..!? Exactly!
Conclusion
Trump's second presidential term has coincided with one of the worst stock market starts in modern American history, comparable only to George W. Bush's entry during the dot-com crash of 2001.
The approximately 15% market decline since inauguration represents a loss of trillions in market value and a complete reversal of the optimism that followed his election. Trade policy uncertainty, particularly regarding tariffs, has emerged as the primary driver of market instability, creating fears of potential stagflation and undermining business confidence.
As historical patterns suggest that poor starts often lead to continued underperformance, investors remain concerned about the market's trajectory through the remainder of 2025 and beyond.
--
Best 'a bad omen' wishes,
Your Beloved @PandorraResearch Team 😎

IXIC Down leg to 15700IMHO,
I see the Nasdaq dropping to 15700 during the current down leg.
Bear flag has been broken.

IXICTraders: Might look to buy near red support levels and sell near green resistance levels, anticipating reversals at these key points.
Breakouts: If the index breaks through a green resistance level with high volume, it could indicate a potential upward trend continuation. Conversely, breaking below a red support level might signal further declines.

IXICBullish Breakout: If Nasdaq breaks 17,800, the call option gains value.
Bearish Reversal: If it drops below 17,436, the put option profits.

IXIC Resistance Levels (Potential Selling Zones):
18,480 – 18,590: Immediate resistance at the 0.382 Fibonacci retracement (18,480) and the session high of 18,589.49.
19,140: Stronger resistance (horizontal level and 0.236 Fib), though likely out of range for next week unless a sharp rally occurs.
Support Levels (Potential Buying Zones):
17,930 – 17,945: Critical support combining the 0.5 Fibonacci level (17,945) and the horizontal line at 17,931.91.
17,410: Next support at the 0.618 Fibonacci retracement (17,411).
17,000: Psychological support level (round number).
Key Notes:
The index closed at 18,285.16 (down 0.35%), suggesting bearish pressure in the short term.
A break above 18,590 could signal bullish momentum, while a drop below 17,930 may trigger further downside toward 17,410.

Can the Nasdaq sustain its rally?NASDAQ:IXIC
SP:SPX
FX_IDC:JPYKRW
Over the past two years, the S&P 500 and Nasdaq have experienced an unprecedented rally. However, now, with the S&P 500 hovering around 6,000 points and the Nasdaq near 20,000, the market appears to have lost its momentum.
I believe that for stock prices to rise further, there must first be a significant market pullback. A major decline implies that someone has already realized substantial gains, and understanding this dynamic is crucial.
Looking further back in time, investors who bought stocks at lower prices will eventually sell them at higher prices. This cycle continues to repeat itself.
There is no such thing as perpetual growth, just as there is no endless decline. Keeping this principle deeply in mind can lead to better investment decisions.

IXIC Support & Resistance LevelIXIC has broken the critical support level of 19,395.88. If it fails to stay above this level, the
next support levels are at 18,621 and 17,866. On the other hand, resistance levels are at 20,190
and 20,985. The market remains under pressure due to Trump's tariff policies. However, a positive development is expected in three weeks with the upcoming FED announcement (Decline interest rate)

Nasdaq and Next Major SupportThe Nasdaq Composite is about to break above what will be it's next major support. When this happens stocks usually fly quite high. Please remember that it will likely want to hit back into this support at some point. So when you get big gains after this happens, do not enter new positions, just ride them. You also might want to trim some off and wait for the pullback into support before adding new positions.
As always, good luck!

$QQQ $IXIC NASDAQ Composite
Even though QQQ is still looking bullish (just meaning that the 35EMA is still above the 30min 200MA, IXIC -or the Nasdaq composite has crossed down to be bearish on Monday with resistance at the 30min 200MA. Interesting!!

Big tech stocks fell sharply due to Trump tariff concerns
Despite some resolution of tariff risks, USTEC failed to recover from the loss. In particular, big tech stocks with high overseas exposure fell sharply. Tesla (TSLA) fell 5.19% over concerns that Trump's tariff policy could harm the company, given that 15% of Model Y parts are sourced from Mexico and Canada. Apple (AAPL) also dropped 3.39% due to concerns that new tariffs on China might ultimately raise iPhone prices.
USTEC briefly tested the ascending trendline and the support at 19140. The index has since rebounded slightly, awaiting additional price triggers for an apparent trend reversal. If USTEC breaks below 19140, the index may fall further to the next support at 18670. Conversely, if USTEC breaches above both EMAs, the index could gain upward momentum toward the 20200 highs.

The PNP Index – A New Way to Evaluate Risk and ReturnsIntroducing the PNP Index – A New Financial Metric! 📊
I recently completed research on a new financial metric called the PNP Index (Positive-Negative Probability Index). Unlike traditional measures like the Sharpe ratio, this metric offers a more balanced way to evaluate returns and volatility, making it ideal for quantitative trading strategies.
🔹 Why is the PNP Index better?
✅ It uses logarithmic returns for accurate backtesting.
✅ It balances positive vs. negative fluctuations instead of just standard deviation.
✅ It enhances algorithmic trading and AI-based forecasting models.
📄 Read the full research paper on SSRN:
🔗 The PNP Index – A New Metric for Evaluating Financial Performance
papers.ssrn.com
💬 What do you think? Could this metric help improve trading strategies?

Bearish Channel pattern The chart suggest that bearish channel pattern to be continue. If break down the support tends to be negative nearby days.

Triple top confirmed bearish trend nearby Nasdaq is set to bearish as triple top pattern formed suggesting bearish trend in coming days.
The Nasdaq Composite Index (IXIC) Key resistance levels Key resistance levels are at 20,196.21 and 20,154.14, indicating potential price ceilings. The index is considered bullish above 20,112.07, suggesting upward momentum. Conversely, it is bearish below 20,027.93, indicating potential downward movement. Support levels at 19,985.86 and 19,943.79 act as price floors, where buying interest may emerge

NASDAQ Composite Has Highest Volume Distribution Day In 4+ YearsI scrolled back as far as IXIC would supply me the data and I was unable to find a day that had this much volume at all.
I realize that this is just one single data point in a sea of data points, but this is a very strong one. This is not trading advice, but it is a word of caution for myself for the near term. The correction we are currently experiencing has good odds of taking out the previous low soon.
I will not be taking on any more risk in the near term, and if we get a a bounce tomorrow morning I may use it to go into all cash until conditions improve.

Market Watch Can the NASDAQ Overcome Resistance or Will It Fall?The NASDAQ has been struggling to break above the $20,059.24 resistance level, facing multiple rejections in recent sessions. This repeated failure to push higher suggests a potential shift to bearish momentum, especially with broader market weakness observed this week. If the NASDAQ fails to clear this resistance, we could see it break down from its current channel, which has been intact since September 6, 2024.
If the price moves lower, the next key support levels are at $18,669.99 and $17,975.67. A breakdown below these levels could trigger further declines, and the market might follow suit with a broader selloff. These support levels are critical for any potential reversal. Keep a close eye on the resistance and support levels, as the direction here could influence the broader market sentiment in the coming weeks.
