are we rekt? I hold nowhere near enough knowledge to make a call like this but they do look pretty similar.
IXIC trade ideas

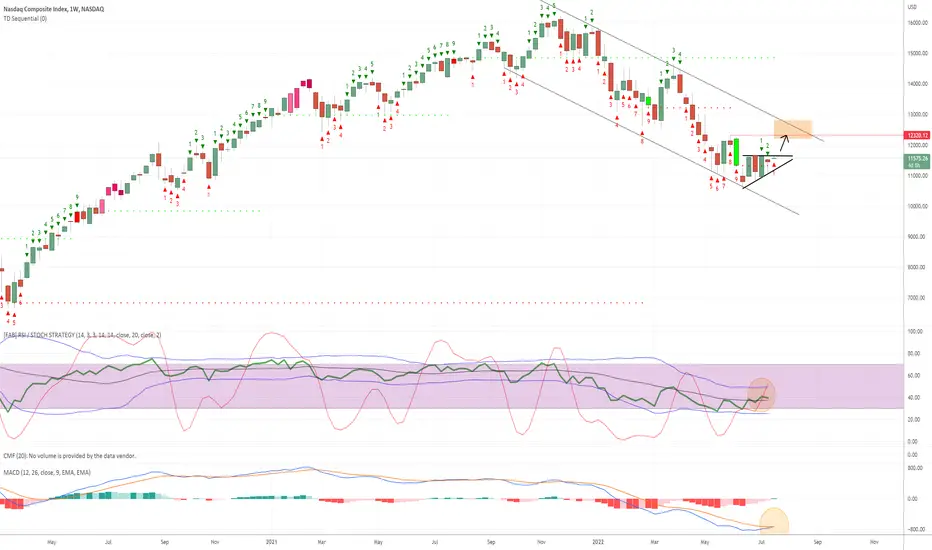
NASDAQ may reclaim 12000Ascending triangle within descending channel.
Momentum up, MACD about to flip.
Let's wait for the FED on the 28th and evaluate.
DYOR.
Double bottom this year, then hits previous ATH, Q4 2023Double bottom this year, then hits previous ATH, Q4 2023.
The world isn't going to stop spinning.

Nasdaq/M2 Money Stock: Unclear where we go from hereJust recording this graphic for the future.
The Nasdaq 100 has had a great past decade, but now we're at a critical time for the tech-heavy Nasdaq index When looking at Nasdaq divided by the Money Supply, news about how the feds will guide the US economy will force people to make a decision about their portfolios:
Do you diamond hand your tech stocks or dump them and wait for a better position?


gaps for the history booksit seems, six gaps from the June low. there's no tomorrow. I don't understand it but spectacular market move.

Cup and handlewe are in the way to shape a cup with handle. it may close down during the following few days.

Nasdaq Composite dropping. IXICIt is appearing to be doing so along with the other major indices and there is plenty of data to speculate that the drop will continue technically and from a valuation standpoint. How low are we going? No one knows, but we have charted a few goals reasonable to us. A book can be written on how we derive the goals, so we won't bore you now.
We are not in the business of getting every prediction right, no one ever does and that is not the aim of the game. The Fibonacci targets are highlighted in purple with invalidation in red. Confirmation level, where relevant, is a pink dotted, finite line. Fibonacci goals, it is prudent to suggest, are nothing more than mere fractally evident and therefore statistically likely levels that the market will go to. Having said that, the market will always do what it wants and always has a mind of its own. Therefore, none of this is financial advice, so do your own research and rely only on your own analysis. Trading is a true one man sport. Good luck out there and stay safe.

NASDAQ My Bullish ViewNASDAQ My Bullish View. USA Stocks in NASDAQ Index should be bullish in long term.

Nasdaq at an area of valueNASDAQ:IXIC is at an area of interest, near a potential resistance level but also trading above a key MA. Friday close will be interesting, a solid close above this MA might bring a bull run. Failure to push up will bring us back to the boring "correction" environment. I'm rooting for the upside.

IXIC/SPX signs of risk onas IXIC/SPX seems to be breaking above support bands, hopeful of course, still need to see how this plays out, the SPX/IXIC, obviously will be the inverse and losing ground, and when pulled up can see breaking down back into the support band channels

IXIC vs USM2 in 2000's bubble and currentlyI think if we get out of the blue channel...it gets exciting and some narrative drives us forward. may be around fall election times...any number of macro announcements could cause a run if we are out of the channel...

Nasdaq Composite Comparison to 2021$IXIC Nasdaq Composite now vs. then 2021. Notice the resemblance to channel support/resistances aligned with the bubble spike above channel between the two charts and then notice the 8month MA (yellow) vs. 50month MA (red). The chart is extremely earie, and you need to take notice.
Current:
Then (2021):

Potential diamond forming I know this pattern can be hard to spot but this looks pretty good to me. We also have a bullish divergence on the RSI with a break of resistance and a backtest of that resistance line. Will be watching closely next week for the next candle

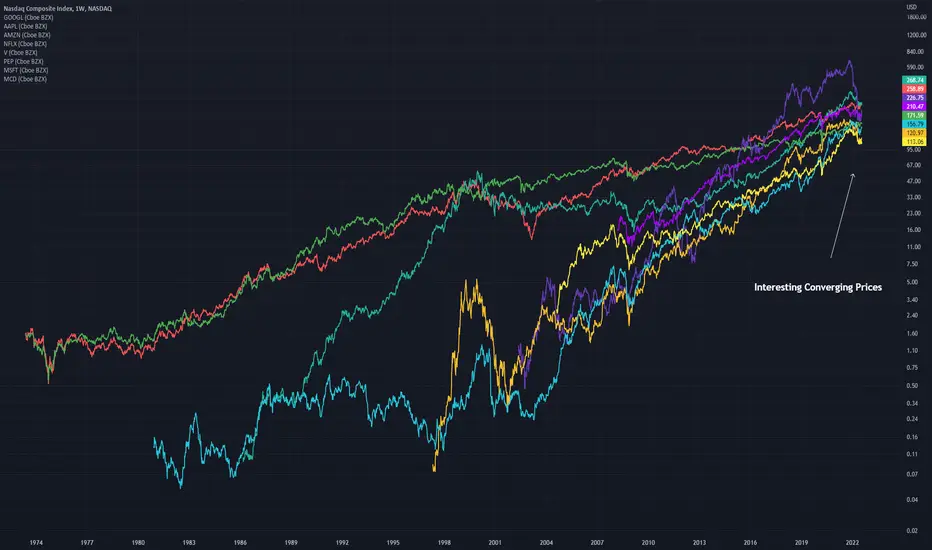
Top Performing Stocks ConvergenceAn Idea showing some of the best performing stocks
GOOGL
AAPL
AMZN
NFLX
V
PEP
MSFT
MCD
I find it interesting how they are all converging to the same point. Do you find this observation to be bearish or bullish? Or nothing at all?
The Global Reset will crash economy for digital dollar If you haven't figured it out yet. The markets are bought up by the US government. They are the largest shareholder with trillions of fake money pumped into markets. There is an actual government organization called the PPT that was put into place to keep markets from crashing.
The organization has evolved to basically buy stocks all day to keep inflating stock market to inflate consumer confidence. This is basically an unnatural market. The scam works like this. The government prints fake money to buy stocks and when these are sold by investors the fake money becomes real money and makes an impact in the economy as a large portion of it is recirculated into economy.
That being said. A major event is likely planned by the government to crash stock market as an attempt to mandate a digital dollar currency. Bitcoin is likely an experiment of the US government as well.
Long story short. Either the governments plan will work or God will reak havoc and end the manipulation before this happens. Even if we go digital God will have the last laugh. Even though he wouldn't laugh if you know what I mean.
Markets can get irrational even more and go way beyond the thick red line even into 17k territory but let's hope this ends quicker then that


Nasdaq Composite Summary - Week of 7/15/2022Summary of weekly price and volume action, as well as net new highs and lows, on the Nasdaq Composite for the week of 7/15/2022.
Click on the chart below to view the details:

Nasdaq Downside continues 15 July 2022Looks like this downwards trend range, is dominating the market.
It looks like the price will head on up on thin volume, before it makes its next down wave...
What do you think?
Trade well, live free.
Timon
Founder, MATI Trader

Head and Shoulders on NASDAQ ChartHead and Shoulders on NASDAQ chart (mirrors Inverse H&S on DYX chart).

bull market can make you money , bear market make you richthere are 3 occasions since 1975 when rsi went below 39. the present scenario indicates that history can be repeated.
even if rsi goes below 39 level and remains there for some time, it will bounce back . one can start accumulating good value stocks in a small amount .

Daily Market Update for 7/8Summary: Employment data on Friday showed a better-than-expect labor market with Payrolls far exceeding the forecast. The strong labor market opens the door for the Fed to continue its aggressive rate hikes to control inflation.
Notes
Ideas always welcome in the comments. Errors will be amended as comments on TradingView or corrected inline in my blog.
-=x=-=x=-=x=-=x=-=x=-=x=-=x=-
Friday, July 8, 2022
Facts: +0.12%, Volume lower, Closing Range: 74%, Body: 63% Green
Good: Higher high, higher low, good closing range
Bad: Lower volume on gain
Highs/Lows: Higher high, Higher low
Candle: Medium green body with long upper wick, tiny lower wick
Advance/Decline: 0.96, slightly more declining stocks than advancing stocks
Indexes: SPX (-0.08%), DJI (-0.15%), RUT (-0.01%), VIX (-5.52%)
Sector List: Health (XLV +0.30%) and Technology (XLK +0.05%) at the top. Communications (XLC -0.47%) and Materials (XLB -0.98%) at the bottom.
-=x=-=x=-=x=-=x=-=x=-=x=-=x=-
Market Overview
Employment data on Friday showed a better-than-expect labor market with Payrolls far exceeding the forecast. The strong labor market opens the door for the Fed to continue its aggressive rate hikes to control inflation.
The Nasdaq rose by +0.12% while the other major indexes fell. The candle has a 63% green body underneath a long upper wick resulting in a 74% closing range. Volume was lower than the previous day. There were slightly more declining stocks than advancing stocks.
The Dow Jones Industrial Average (DJI) declined by -0.15%. The S&P 500 (SPX) fell by -0.08%. The Russell 2000 (RUT) closed the day flat, declining just -0.01%.
Only three of the eleven S&P sectors gained. Health (XLV +0.30%) and Technology (XLK +0.05%) were the best two sectors for the day. Communications (XLC -0.47%) and Materials (XLB -0.98%) had the biggest losses.
Nonfarm Payrolls for June grew by 372,000 compared to the consensus forecast of 268,000. The Unemployment Rate remained at 3.6%.
The US Dollar Index (DXY) fell by -0.13%. US 30y, 10y, and 2y Treasury Yields rose. High Yield (HYG) Corporate Bond prices gained while Investment Grade (LQD) Corporate Bond prices followed Treasuries lower. Brent Oil rose to $105 a barrel.
The VIX Volatility Index (VIX) fell by -5.52%. The put/call ratio (PCCE) rose to 0.768. The CNN Fear & Greed Index inched further from Extreme Fear, but is still in the Fear range, far from Neutral.
Three of the big six mega-caps gained. Tesla (TSLA) had the best gain, advancing by +2.54%. The stock had further gains after hours as news hit that Elon Musk pulled out of the Twitter purchase. Meta (FB) had the biggest decline of the six, falling by -0.76%. Five of the six closed above their 21d EMA and 50d MA.
Tesla also topped the broader mega-cap list. Alibaba (BABA) was at the bottom of that list with a -1.22% decline.
Enphase Energy (ENPH) was the best stock in the Daily Update Growth List, gaining by +4.65% Friday. Twitter (TWTR) was at the bottom of the list, declining by -5.10%. Twitter moved lower after hours for the same reason Tesla moved higher.
-=x=-=x=-=x=-=x=-=x=-=x=-=x=-
Looking ahead
There are no significant economic news or earnings reports scheduled for Monday.
-=x=-=x=-=x=-=x=-=x=-=x=-=x=-
Trends, Support, and Resistance
The Nasdaq briefly rose above the 50d moving average but closed below the line.
If the five-day trend line continues into Monday, that would mean a +2.29% gain.
A continuation of the one-day trend line points to a +0.54% gain.
Returning to the trend line from the 6/16 low would result in a -1.15% decline to start the week.
-=x=-=x=-=x=-=x=-=x=-=x=-=x=-
Wrap-up
Analysts are needing to reconsider again what actions the Fed might take considering a much stronger labor market than they initially expected. Despite news of big tech hiring freezes, payrolls grew in June as other sectors continue to hire.
Stay healthy and trade safe!

Nasdaq Composite Summary - Week of 7/8/2022Summary of weekly price and volume action, as well as net new highs and lows, on the Nasdaq Composite for the week of 7/8/2022.
Click on the chart below to view the details:
Big picture view of the Nasdaq Composite:
