Daily Market Update for 5/24Summary: Snap Inc. sent an ominous signal to the market by reducing guidance, causing tech and growth stocks to sell off heavily in the morning before recovering some of the losses.
Notes
Ideas always welcome in the comments. Errors will be amended as comments on TradingView or corrected inline in my blog.
-=x=-=x=-=x=-=x=-=x=-=x=-=x=-
Tuesday, May 24, 2022
Facts: -2.35%, Volume lower, Closing Range: 66%, Body: 24% Red
Good: Good closing range over long lower wick
Bad: Lower high, lower low, higher volume on decline
Highs/Lows: Lower high, Lower low
Candle: Thin red body in upper part of candle, longer lower wick
Advance/Decline: 0.3, More than three declining stocks for every advancing stock
Indexes: SPX (-0.81%), DJI (+0.15%), RUT (-1.56%), VIX (+3.41%)
Sector List: Utilities (XLU +2.00%) and Consumer Staples (XLP +1.64%) at the top. Consumer Discretionary (XLY -2.57%) and Communications (XLC -3.55%) at the bottom.
-=x=-=x=-=x=-=x=-=x=-=x=-=x=-
Market Overview
Snap Inc. sent an ominous signal to the market by reducing guidance, causing tech and growth stocks to sell off heavily in the morning before recovering some of the losses.
The Nasdaq fell by -2.35% on higher volume than the previous day. The long lower wick was created at open as key economic metrics missed the forecast. However, the index recovered some of the loss and closed with a 66% closing range. The 24% red body sits at the top of the candle. There were more than three declining stocks for every advancing stock.
The Dow Jones Industrial Average (DJI) was able to finish the day with a gain, advancing +0.15%. The S&P 500 (SPX) declined by -0.81%. The Russell 2000 (RUT) declined by -1.56%. The VIX Volatility Index increased by +3.41%.
Five of the eleven S&P 500 sectors gained, led by defensive sectors. Utilities (XLU +2.00%) and Consumer Staples (XLP +1.64%) were at the top of the list. Consumer Discretionary (XLY -2.57%) and Communications (XLC -3.55%) were at the bottom, with the former being impacted by Snap's news.
Manufacturing PMI data for May met the forecast of 57.5 but the Services PMI fell short, coming in at 53.5 compared to the forecast of 5.2. The PMI data is a signal of economic activity within these two sectors.
New Home Sales for April also came in lower than expected. There were only 591,000 new home sales compared to the forecast of 750,000. The previous month was 709,000. The new number shows a significant slowdown.
API Weekly Crude Oil Stock was higher than expected.
The US Dollar Index (DXY) continued to decline, dropping by -0.32% today. US 30y, 10y, and 2y yields were all lower. High Yield (HYG) and Investment Grade (LQD) Corporate Bond prices were higher, tracking with treasury prices.
The put/call ratio (PCCE) rose to 0.903. The CNN Fear & Greed Index remained in the Extreme Fear range.
All of the big six mega-caps declined, with Facebook (FB) dropping the most, losing -7.62% today. Microsoft (MSFT) held up the best, declining only -0.40%.
Verizon (VZ) was the top mega-cap for the day, gaining +2.03%. Consumer Staples and Health mega-caps dominated the rest of the top ten. Facebook was at the bottom of the list, followed by Tesla (TSLA) which fell by -6.93%.
There was only one gainer in the Daily Update Growth List. Zoom Video (ZM) climbed by +5.61% as its earnings report showed continued growth despite the winding down of the pandemic. After Zoom Video, all the stocks on the growth list fell by more than 2%. Five stocks on the list fell more than 10%, led by Snap Inc (SNAP) which dropped by a huge -43.08%.
-=x=-=x=-=x=-=x=-=x=-=x=-=x=-
Looking ahead
Wednesday will kick off with the Core Durable Goods Orders data for April. After the market opens we will get the Crude Oil Inventories.
The FOMC Meeting Minutes from the early May meeting will be available in the afternoon.
Nvidia (NVDA), Trip.com (TCOM), and Box Inc (BOX) are a few of the earnings reports for Wednesday. I mistakenly
-=x=-=x=-=x=-=x=-=x=-=x=-=x=-
Trends, Support, and Resistance
The Nasdaq continued its downtrend but held above Friday's low.
After the dip in the morning, the index trended higher the rest of the day. If the one-day trend line continues into Wednesday, we can expect a +0.69% gain.
The five-day trend line points to a -1.07% decline.
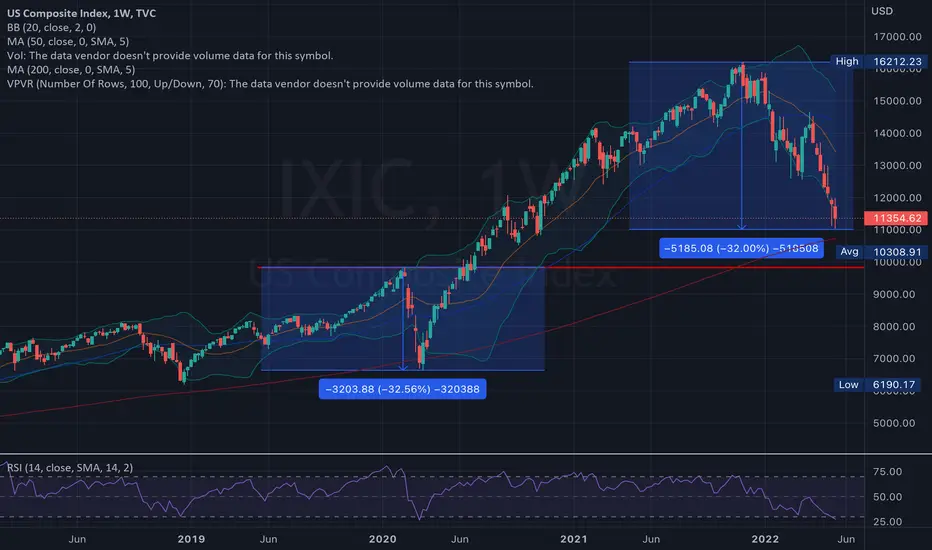
If the index returns to the trend line from the 3/29 high, that would mean a -2.56% decline.
-=x=-=x=-=x=-=x=-=x=-=x=-=x=-
Wrap-up
Snap's message of lower guidance due to economic disruptions drove even more fear among investors in tech and growth stocks, resulting in today's sell-off. The bleeding continues, and the only question is when will it stop. Perhaps we will continue to bounce around at this level, or maybe we will move lower.
If we can start to see indications of a top to inflation, that will help build more support for gains. Inflation needs to come under control without massive interest rate hikes that will further slow down growth.
Stay healthy and trade safe!
IXIC trade ideas

Daily Market Update for 5/23Summary: Stocks rallied on Monday thanks to a stronger Euro after the European Central Bank said rate hikes would come later this year.
Notes
I've been traveling for the past two weeks and have not been able to write the Daily Market Update. I'm back at home and will continue covering the markets as often as I can.
Ideas always welcome in the comments. Errors will be amended as comments on TradingView or corrected inline in my blog.
-=x=-=x=-=x=-=x=-=x=-=x=-=x=-
Monday, May 23, 2022
Facts: +1.59%, Volume lower, Closing Range: 93%, Body: 56% Green
Good: High closing range
Bad: Lower volume on gain, lower high than previous day
Highs/Lows: Lower high, Higher low
Candle: Inside day, upper half green body, lower half wick
Advance/Decline: 1.07, about the same number of advancing and declining stocks
Indexes: SPX (+1.86%), DJI (+1.98%), RUT (+1.10%), VIX (-3.23%)
Sector List: Financials (XLF +3.25%) and Energy (XLE +2.64%) at the top. Health (XLV +0.88%) and Consumer Discretionary (XLY +0.75%) at the bottom.
-=x=-=x=-=x=-=x=-=x=-=x=-=x=-
Market Overview
Stocks rallied on Monday thanks to a stronger Euro after the European Central Bank said rate hikes would come later this year.
The Nasdaq rose by +1.59% for the day, but it was not enough to reach the previous day's high. The inside day came with lower volume, but the closing range of 93% and 56% green body in the upper half of the candle is positive. There was a nearly equal number of advancing and declining stocks.
The Dow Jones Industrial Average (DJI) outperformed the other indexes, gaining by +1.98% while the S&P 500 (SPX) advanced by +1.86%. The Russel 2000 (RUT) climbed by +1.10%. The VIX Volatility Index declined by -3.23% but remained elevated as it has been since the beginning of May.
All eleven S&P 500 sectors gained. Financials (XLF +3.25%) and Energy (XLE +2.64%) were the best two sectors for today. Health (XLV +0.88%) and Consumer Discretionary (XLY +0.75%) were at the bottom of the sector list.
The US Dollar Index (DXY) dropped by -0.91% and is down 2.5% from its peak in early May. US 30y, 10y, and 2y Treasury Yields all rose. High Yield (HYG) Corporate Bond prices moved higher while Investment Grade (LQD) Corporate Bond prices declined. Copper and Aluminum Futures continued to rise.
The put/call ratio (PCCE) dropped to 0.829. The CNN Fear & Greed index is in the Extreme Fear range.
Five of the big six mega-caps advanced. Amazon (AMZN) was the only one to decline but fell just -0.03%. Apple (AAPL) had the biggest gain, advancing +4.01%, followed by Microsoft which moved up by +3.20%. All six have work to do before getting back to their key moving average lines.
Financial stocks topped the broader mega-cap list. JP Morgan (JPM) and Bank of America (BAC) were the top gainers, advancing +6.19% and +5.94% respectively. Broadcom (AVGO) was at the bottom of the list, declining by -3.10%. There were only four mega-caps that declined.
The Daily Update Growth List had some gainers, but overall more than half of the list declined. DoorDash (DASH) topped the list with a +2.39% gain. Peloton (PTON) had the biggest loss, declining by -6.13%.
-=x=-=x=-=x=-=x=-=x=-=x=-=x=-
Looking ahead
Purchasing Manager Index data for May will be available after the market opens tomorrow. That includes Manufacturing, Services, and Composite measurements. We will also get New Home Sales data for April.
Nvidia (NVDA), Trip.com (TCOM), and Box Inc (BOX) are a few of the earnings reports for Tuesday.
-=x=-=x=-=x=-=x=-=x=-=x=-=x=-
Trends, Support, and Resistance
Although the day ended with positive gains, the lower high means the index is still in a down trend.
If the one-day trend continues, that would mean a +1.33% gain for Tuesday.
If the index returns to the five-day trend line and or the trend line from the 3/29 high, that would result in a -3.86% decline.
-=x=-=x=-=x=-=x=-=x=-=x=-=x=-
Wrap-up
It's been a wild few weeks. Part of me is happy I was on break and didn't report daily. Part of me thinks there was much to learn from the market data and could have benefited.
Let's hope for some new highs throughout this week and some gains on higher volume, shared broadly across the market.
Stay healthy and trade safe!

time for reversal?nasdaq looking ripe for a bounce now. last bear market of march 2020 showed a 32% drop, we're currently at that level now. rsi ~27 is also around the same level as march 2020. let's see if a reversal is in the works
Nasdaq Support HoldsThis is a follow up to my 05/14/22 post "Nasdaq Bottoms at Important Support" .
Point & Figure charts objectively define support/resistance. They can also help to filter out false breakouts.
On 05/12/22 IXIC made a bottom in its decline from the all-time high made in November 2021.
On 05/20/22 IXIC went marginally below its 05/12/22. Could this be the start of a new down phase? Unlikely, because
there was no break below the Point & Figure support.
There's a high probability that IXIC could have a multi-week rally at least up to the important resistance area illustrated
on the chart.
Mark

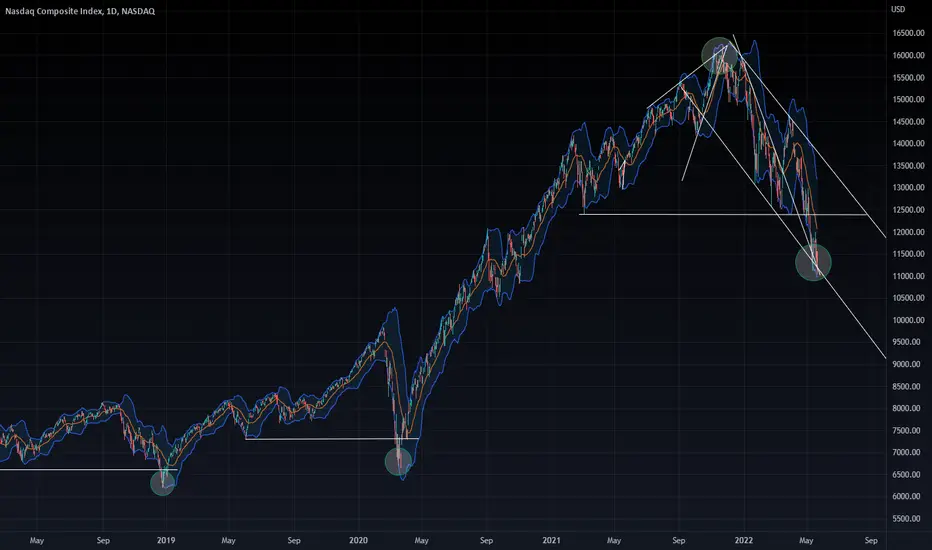
NASDAQNASDAQ
Falling wedge
Double Bottom
Lower channel
Opinion: Bullish short term buy within a bear market. Looking for a move up from here to the 12,700 - 13,000 area.
Nasdaq Extremely OversoldThis is a side-by-side comparison of the Nasdaq daily chart from March 2009 with today (May 2022). The charts are looking very similar to one another. The heatmap on the daily chart has not been this cold since the bottom of the Great Recession. The daily plot is nearing a record low. While this daily chart cannot make long term predictions, it suggests that we are at a bottom right now and the Nasdaq is about to move back up for the coming weeks to months.

Nasdaq Composite Overview for OtosanThis long term trend for Nasdaq is consistent through it's history. This line has acted as the bottom for both the 1990, 2000 and 2020 crashes. The only time Nasdaq went below the line was the 2008 financial crisis. From 2008-2017 the line acted as resistance (top).
Here are the two scenarios (Long Term - Years)
Bullish: Just like the 3 major crashes - Nasdaq will test this support which shows to be around $10,000. This would be the ultimate time to buy and statistically is the more likely option. In this scenario NASDAQ will pass it's prior high in 2024 or before (50% return).
Bearish: If the $10,000 line is broken, there is no trendline and will be near impossible to predict a bottom. If we use 2007-2008 as an example, the market first dropped 20% initially (July 2007 - March 2008) and almost touched the line - the line then failed to support later that year in August. Once this line breaks after a second test or third test, all major investors dump shares as the bottom can no longer be predicted. This is why the market lost 40% from August 2008 - Feb 2009 (or a total of roughly 52% between 2007-2009). Once this happens, people should only reinvest once an uptrend starts to form. To translate this to today's market, the NASDAQ would have lost 30%+ from the tops to reach the $10,000-10,500 line, and would likely have a sharper decline to follow if the trend is broken.
Summary
Ultimately the tradeoff is either a 50% return in less than 4 years followed by a likely bull run. From strictly a statistic likely hood this is the more likely scenario. However, if NASDAQ breaks the support line, the most commonly used tool to predict bottoms (Fibonacci), the low is estimated to be around $2,875 or an additional 70% drop from $10,000 (80% drop from market high). This may seem exaggerated, but the same tool would have predicted a drop of price of the 2007-2009 bottom at $1,550 which is actually higher than the actual low of around $1,350.
Personal Conclusion
Strictly looking at chart analysis, the upside is good with the market returning to it's prior high within 4 years. However, as the recent gains were extremely fast and the following downturn was very sharp, there is also a potential of one of the greatest losses in value historically. Now if we look at the current timing and global political climate, from rising interest, supply chain disruptions to a war in Europe the risks are significantly higher than the past recessions of breaking the support line. Some of these factors can be countered by investing in companies that may counter the market for a more balanced portfolio. In short, the first priority would be to set aside enough cash (factoring for long term inflation) for the next 10-20 years outside of investment assets so that even if there is a major downturn or further inflation, you can live comfortably and stress free.

Comparing the Nasdaq, S&P, and the M2 money supplyThe current drawdown in the stock market may not appear like much when looking at a monthly chart, however when comparing to the money supply it tells a different story. From the peak of the dot com bubble the entire market is still down significantly when adjusted for all the money printing the fed has done.

Nasdaq Composite Index divided by M1 and M2 money supply The current drawdown in the Nasdaq may not appear like much when looking at a monthly chart for example, however when comparing to the money supply it tells a different story. Compared to M2 we are at the same level seen in early 2020, however compared to M1 we are at levels not seen since 1991.

NASDAQ: normalization outlook, zoomed outHi,
In my previous post about NASDAQ I shared my points why I removed my share holdings in October 2021, and what targets I'm looking at before taking US tech positions again (not sooner than H2 2022).
Here's a zoomed out view, with some important long-term averages and a trend line I'm looking at. I'm not sure about Target 3, but that level is also possible to reach. My best bet would be that it will reach to target 2.
The previous explanation.
Be safe out there.
Cheers,
Antonio

NASDAQ - LongThe index has most probably completed either the whole or the first phase of a correction. A daily close above 12275/570 is needed to give more credit for a recovery towards 13020 and 13640.Only a daily close above 15115 would eliminate additional losses for now and open the door to new highs.
On the other hand, a daily close below 11015 would revive a downward extension to 10125 and 9580.
We recommend building small long positions at market with a stop loss at 11020.

NASDAQ Corrective WaveNasdaq is currently on corrective WAVE 3 on it's way to finish WAVE 4.
Looks like it's making a Zig Zag ABC correction and if it's true, then we could see a rebound from the "BLUE zone" to close several gap there before continue it's journey to WAVE 5.
Last correction area is the "YELLOW line".
Wave 4 invalid if price's touching the "RED line".

Nasdaq will drop more U.S. NASDAQ has lost its 200 days SMA.
according its price action , I think the correction will be finished when it drops at least more than 18% to reach its 200 weeks SMA , or it will be in a squeezing range situation for a long time , then 200 weeks SMA will come up to the price pattern.
in this moment , I will be cash or invest very tiny.

NASDAQ INDEX TREND AND WAVE ANALYSISBe sure to stick to Stop Lost and TAkE Profit. This is an idea and not a bargain offer
This is just idea, not trading advice, use at own risk.
reasons:
It is recommended to buy in this price limit
It is mandatory to pay attention to the stop loss and the target marked on the chart
Do not be greedy and adhere to the specified principles. I hope you will be profitable
Note that there is no 100% analysis and it is possible to stop flirting
This is a personal analysis and you should not enter into a transaction without review
If you know this, make a purchase
Be sure to adhere to the principles of capital management and do not invest more than 2% of your capital in each transaction.
High-risk individuals can enter a maximum of 5% of risk capital in this transaction by accepting risk-taking.
This analysis has been analyzed with the classic Elliott topics and neo wave style. Also, the principles of price action have been used.

2000 vs 2022Some similarities between 2000 vs 2022
1. Before reaching ATH the index did a very sharp decline of 33%
2. It took the index 17 bars to reach an ATH vs 20 now
3. Found support on 40SMA after 9 months from ATH vs 7 now
4. Mass retail participation
5. .com mania vs crypto mania? (did luna just popped the bubble?)
6. Interest rates were falling back in 2000 vs rising now (tradingeconomics.com)
7. Inflation was not even close back then to what is is now (tradingeconomics.com)
What to wait for
1. Holding or not 40SMA!!!
2. Where RSI, MACD & DMI will head towards next months
3. The index went -18.35% lower than the previous big decline which equals Nasdaq declining just above where the previous wave ended
4. It took the index 23 months by the time it touched for the first time the 40SMA to bottom which means April 2024 just 6 months before the elections
When the bubble burst in 2000 nobody really blamed the "system" like in 09 simply because everybody participated in it. It's like blaming yourself! How many people have the courage to do that? Could the same be told about the current situation? Yes, governments printed trillion of money but they did not put a gun in your head telling you, it's either you invest in crypto/stock market or you are done. We participated because our friends and family did, we participated because we were greedy, we participated because we believed in a fairytale and we participated because we wanted an"exit" from the system but all we did was feed the system!
I cannot really find any really strong arguments to support that the same will not happen again in the not-so-distant future. I am only thinking that if it is that obvious maybe the markets can stay irrational longer than we can stay solvent!
I stand by the Tradinview's motto LOOK FIRST/THEN LEAP

Nasdaq Elliot Wave. Long against LogicI usually trade off just price action, but I find this Elliot Wave on the Daily Timeframe, too close to textbook not to be curious whether it's really a thing.
The proportions of the Waves are pretty spot on with the typical standards.
Despite being bearish for awhile, and in the medium term like 6-12 months out, I think we get a nice run up for awhile.
There seems to be a lot of scared cash on the sidelines, if you look up the Data like the Managers Funds index etc. Could be a nice little FOMO in.
We shall see, if it rips, how eager people will be to sell the Rips,...or if the sentiment changes and it's "let it ride." Humans have such bad short term memories, we can go bearish to bullish in the same given day, I know I do sometimes :)

NASDAQ200 Monthly EMA has marked 3 previous bottoms.
Still have 50% - 55% to go.
Monthly MACD suggests a lot more downside to come.
6000-6500 is likely the bottom

Nasdaq Bottoms at Important SupportOn 05/12/22 the Nasdaq Composite (IXIC) bottomed at important Point & Figure Support. Note five - column support in the 11086 area.
Important seven - column resistance in the area of 13322.
Mark

working out some kinksthe large gap at 11,187 finally filled with a bounce! good sign that the destruction in the nasdaq stocks could be nearing a turning point. real company earnings are doing quite well and most stocks have been absolutely crushed. the nasdaq 100 has held up more likely bc megacap tech has taken a beating last which likely to continue some more. good news for stocks that have been overly punished -40% or more with great fundamentals, bottoming is a process as they say!

1995-1998 fractalI have placed the fractal from 1995-1998 over 2016-2022 and there are very strong similarities in the price action. During the majority of the 1990s bull market the nasdaq comp made very aggressive moves up followed by very sharp 20-30% corrections. This is very similar to market we are in now with multiple corrections like this that have happened. With the Nasdaq Comp down 30% and testing the 150wma we could expect a very sharp recovery soon.

identical scenario could trigger a significant relief rallyHello trading family:
After long time of being on the sidelines i decided to start preparing my shopping list for the next possible relief rally. I don't want to call it a " bull run " like we had back in march 2020 since we have a much complicated macro economic and geopolitical scenarios. we have a sky rocket inflation and a very hawkish fed , we have the war in ukraine and the lockdowns in china. take a look at the nasdaq chart. we went down about 33% during the covid crash , and we are 30% down now since the last peak in nov 2021. we can see on the chart that we about to meet again with the 200 ma. last time that happened , we enjoyed a very strong rally. lets hope we will get some green consecutive days.

Nasd - line in the sand?Nasd currently at the 50% fib and very close to the 200 week ma.
Support failure here drops price to the fib golden pocket around 10k.
This is what progressive police does to a country.
Just a heads up...Careful!

IXIC US Composite Nasdaq Corrects 50% from swing of 2020! Over? IXIC US Composite Nasdaq Corrects 50% from swing of 2020! Over?
#IXIC #NASDAQ #US30 #RUT #SPX500
NASDAQ:IXIC corrects 50% from the swing of 2020 bottoms.
Is it over? Economic fundamentals claim it has not bottomed out yet.
Most of the IT stocks gave the way for this correction. #TSLA #AMZN #FB #NFLX and so on to name.
Is it time for investment? Yes, for a long term holder who is not bothered with a small dips of 5-7% further fall, should start investing.
Are you salaried class person with a constant earning coming every month end? Or u have a business with a strong mindset of risk management and risk handling?
Be prepared with your investment plans! Personal Finances and Taxation. Earnings and Expenses. Savings and Return on Investment All are to be aligned in this latest world of increased necessities and demands with scarcity of resources.
As we have always read, this is actually happening in front of us.
Are we prepared?
Inflation and Unemployment will tame our greed and carelessness towards resources.
Investment opportunities? Ample of opportunities, waiting for appropriate investment entry.
Start investing start trading. Tradingview !
#tradingview.
