☘️ NASDAQ - 14500 a Doable Target 🎬🍿History is Bullish on Nasdaq:
The Nasdaq-100 index is home to 100 of the largest technology companies listed on the Nasdaq stock exchange. It had a miserable year in 2022, declining by 33% as investors trimmed their bets on the high-growth tech sector.
But based on the annual returns of the Nasdaq-100 dating back to 1986, consecutive down years are incredibly rare. In fact, the index has only fallen two years in a row on one occasion -- during the dot-com crash between 2000 and 2002.
While the current environment poses its own unique challenges like red-hot inflation and rapidly rising interest rates, there's a likelihood that, based on history alone, the Nasdaq could be set for a bumper 2023.
That's because the index has delivered an average return of 51% in the first positive year following a loss, and given the rarity of consecutive declines, the odds suggest 2023 is likely to be green. But investors will need to see economic headwinds subside, and there are already some early signs that's happening.
US economy is doing just great and fears of economic troubles in China and Europe are shrinking by the day, despite the ongoing war in Ukraine.
Technology keeps becoming more dominant in every day life and AI is offering possibilities to everyone..especially the big Nasdaq Giants.
Optimistic and Bullish here, despite the Rate hikes (another 2-maybe 3 small ones)
One Love,
The FXPROFESSOR
How i called the ATHs:
IXIC trade ideas

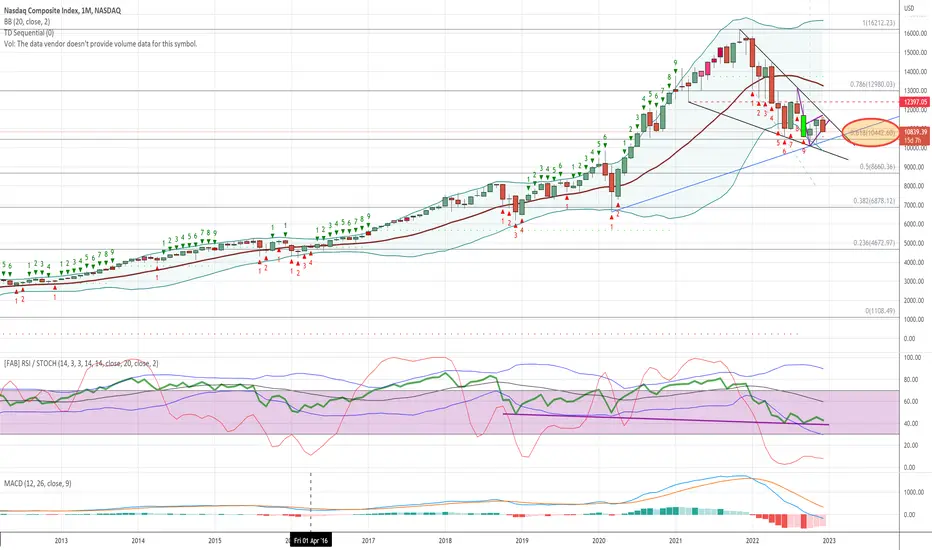
Nasdaq is painting a once-in-decades scenario.Nasdaq (IXIC) is currently painting a red TD count 12 con monthly timeframe.
It happened only once, back in july 1984 and marked a reversal.
That's almost 40 years ago.
Moreover it's still close to FIB 0.618 of a 2 decade long uptrend dating back to 2002.
We have a falling wedge, a bullish divergence on RSI (Dec '18, March '20).
A bounce from this general area may potentially hint an upcoming generational opportunity.
Closely watch for test of rising support and/or wedge breakout.
As usual DYOR, mind the risk.
Prettified chart:
Consider the Long-Term ChartI'm not going to call if the bottom is in or "not so fast" but just want to point out that we may only be halfway through a significant long-term downturn. It's concerning to me that RSI has broken significantly below 50 for the first time since the market recovered from the lows in early 2009. It's also concerning that price looks like it wants to retest the 50-mo. EMA after seemingly finding support a couple months ago. There's still considerable downside risk to the 200-mo. EMA where it has found long-term support in the past and it also happens to currently line up with a double bottom with the covid panic low from early 2020. Will it go down to the 200-mo EMA now? I'm not sure, I'm just saying that it could and you need to be prepared for that. I do know that if it continues to drop it would be a blood bath down at those levels and also a great long-term buying opportunity in my opinion (it could find support above, at or below the 200-mo EMA and an interesting level would be the top from the tech bubble around 2000 which lines up with a period of sideways consolidation from 2015-2016.


NAS - ShortNo change, deflation and declining commodities coupled with Rate Increases and Hawkish Policy makes for rocky roads ahead. Growth slowing, profits slowing, layoffs ongoing, trend continuing, we are near the higher bound of. daily range based on price and volatility and the chart aligns. Nuff Said.

False breakout or just consolidation at resistance?IXIC facing resistance. It tried to break through but got a pushback. Will this be a false breakout or just consolidation before going higher? Looks like we will get answer after the Fed meeting.

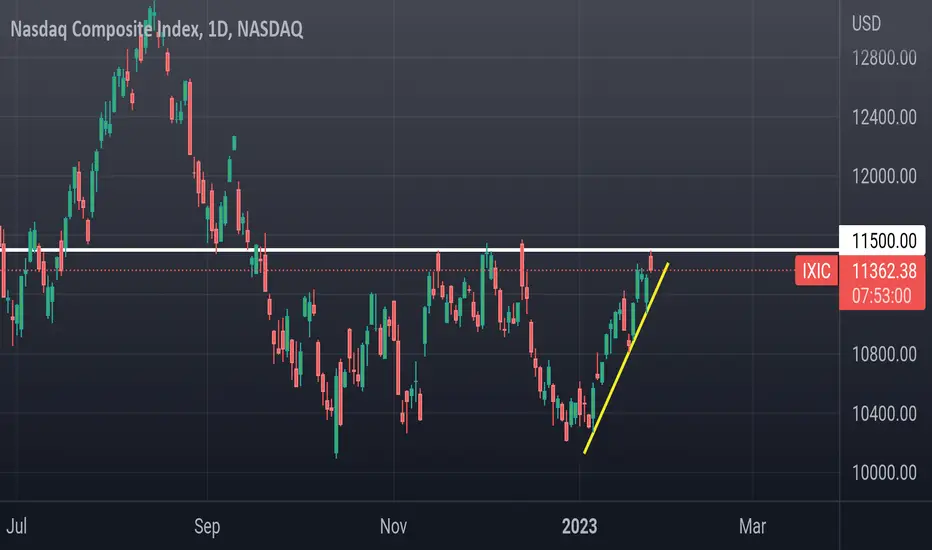
Nasdaq (IXIC)I usually do QQQ charts which only follows 100 non Financials .
This Nasdaq composite charts cover 3700 . Also this is the ticker you see when you watch CNBC!
11,500 has been resistance since last Sept and has been an area of strong price action dating back to fall of 2020.
Also now in this area is QQQ Daily 200sma which Nasdaq has traded under for most of 2022..
If we break over 11500 and hold after fed meeting next week then there is a high chance we close gap at 13k. If things go south and we break yellow uptrend then we revisit 10k
IXIC Potential For Bullish ContinuationLooking at the H4 chart, my overall bias for IXIC is bullish due to the current price being above the Ichimoku cloud, indicating a bullish market. Looking for a pullback buy entry at 10753.57, where the 38.2% Fibonacci line is. Stop loss will be at 10207.47, where the recent swing low is. Take profit will be at 11521.97, where the 50% Fibonacci line is.
Please be advised that the information presented on TradingView is provided to Vantage (‘Vantage Global Limited’, ‘we’) by a third-party provider (‘Everest Fortune Group’). Please be reminded that you are solely responsible for the trading decisions on your account. There is a very high degree of risk involved in trading. Any information and/or content is intended entirely for research, educational and informational purposes only and does not constitute investment or consultation advice or investment strategy. The information is not tailored to the investment needs of any specific person and therefore does not involve a consideration of any of the investment objectives, financial situation or needs of any viewer that may receive it. Kindly also note that past performance is not a reliable indicator of future results. Actual results may differ materially from those anticipated in forward-looking or past performance statements. We assume no liability as to the accuracy or completeness of any of the information and/or content provided herein and the Company cannot be held responsible for any omission, mistake nor for any loss or damage including without limitation to any loss of profit which may arise from reliance on any information supplied by Everest Fortune Group.

NASDAQ INDEX ANG BULLISH SIGNSInstrument: COMP
Optimal technical indicator: Momentum 140
Current signal of optimal tech indicator: LONG
Optimal technical indicator win-rate: 58%
Days for backtesting: 2221
Timeframe for backtesting: 1D
Price at the time of forecast: 11 079,1570
Enter point (market): on chart
Take-profit (model data): on chart
Current stop-loss: on chart
Multiple for stop-loss strategy ATR(14) x 1,2
Average trades per month with optimum technical indicator: 1
Average time for 1 trade with optimum technical indicator: 16
Average profit per 1 trade: 1,96%
Projected annual return w/o leverage: 24,6%
Technical analysis applicability for 3325 technical strategies: 100%
Technical analysis recommendations:
Long: 50%
Short: 44%
Neutral: 6%
Comments: Although the situation is still 50/50, the chart shows signs of a bullish trend
Stable long-term profit for FOREX, CRYPTO, Equity based on backtesting optimization algorithm. Instant analysis of 3.3K technical strategies

2022 crash or 2024 crash?I'm personally believe there is a possibility of a correction this year, but I am very often two years off in my predictions, so I have mocked up a little blow off top and a crash in 2024, hopefully this gives young people a few years to accumulate a large amount of stocks, as before 2034, if all goes well, stocks and the markets will go very well for everyone for a long period of time. a scenario in which there is a market crash in 2024 is actually very good for our children, and will help to reset the valuations of commodities for them and help to give them an abundant life over the next 60 years, so if your old, put all of that wealth into safe, inflation hedged place and watch the drama play out without any greed or fear. for now I am personally taking low risk actions and playing the long high probability game of long term investing, but I am ready for anything.
Remember always, that money is rigged to be worth less over time, so despite this prediction, money is still not a smart thing to have too much of, maybe a two years supply or a maximum of 20% of your wealth, but money is what money does, and money is fools gold, you can't take it with you and life is the accumulation of experiences, a wealth of experiences if you will. Live your life and let your wealth give you the ability to live your best life, you only get one shot at today, live your best day every day.
If you live away from geopolitical issues, don't try and predict their outcome, but keep taking the smart, high probability path and win, if you take risks, always protect the downside and learn from every mistake.

IXICHello, dear friends. I am in the view of a downward movement in the current situation, and whenever it happens, I will announce a definitive opinion about the second upward movement.

IXIC Long (01-09-23)Looking for a drop test, bounce and follow through to upper arrow. View my NQ1 daily post's for full day price action calls / forecasts.


Pocket of GoldNASD has reached and and has bounced from the Fib golden pocket.
Several bullish divergences have presented themselves.
Makes sense to position long with stops just underneath the bottom of the pocket at 9975.
Big money is aware. You should be too.

NASDAQ has long way from now on to go up!|Hello dears
After a while I'm back and I found that there isn't any good signal in Nasdaq going up.
Its according to monthly analysis .

Moment of truth (NASDAQ)This is a long-term trendline on the NASDAQ log chart (1M). It seems like we've finally reached a decisive point in the ongoing Fed vs Inflation saga. It's going to be interesting to see what happens next. If we break the trendline like we did in 2008, we're likely to take the elevator down and then spend the next few years catching up to the trendline again.
Bulls will want to see a bounce off this zone however and if we do, believe it or not, we're likely to continue trending higher and go on another bull run until the next crisis hits.
All eyes on the charts!


A potential continuation of technical downtrends on display
Nasdaq Composite Index(IXIC); A strong continuation of technical downtrends on display in the daily time frame.
Two technical patterns need to be observed in the daily chart. The bearish flag pattern outlined in blue and the long-term price channel developed during the Covid-19 pandemic both aligned with the 10353 support line, which could trigger a sell-off.
The index survived the previous pullback to the 10353 support line but will it survive this time? 10353 and 10038 estimates are considered critical support levels according to the technical indicator. 10038 is the last line of defence; fail at this level, and the index could fall to 9518 and 8486.
Not financial advice; the analysis is based on my technical indicator for educational purposes only.
You can follow my work for future updates on the stock market as we continue to navigate through market volatility.

NASDAQ MORE DOWNSIDE!I still see downside in 2023, the chart is showing a similar pattern to the DOTCOM BUBBLE.
I just see bear market rallies and some considerable time until we see a major trend reversal.
We have just finished the 2nd BUBBLE which was led by the creation of BITCOIN which was born out of the Financial Crash in 2008. The age of low interest rates are also over and the time of making easy money is over.
This is just for my own trading journey and pure speculation, if you enjoy please like and comment below.
Thanks

Interpretation of cryptocurrency market on Dec 16 2022After the announcement of the 50 basis point rate hike last night, the market responded with a decline. The 50 basis point rate hike had been expected. The focus was on the follow-up speech by Powell. After the announcement of the rate hike data, the market started to rally at 3:35 am. Powell made some optimistic remarks during the period, such as a "welcome decline" in inflation. At the same time, the economy has maintained moderate growth. But the market was also reminded that the lesson of history is not to relax policy too soon. There are at least 50 basis points to be added next year, and they will be maintained for some time. Next year's rates will also be the peak of the current round of rate hikes.
Overall, the events that took place last night, including the speeches, were almost exactly what the market expected. Whether it was a 50 basis point hike or continued hawkishness, it was all expected. And even though the remarks were hawkish, what was revealed was all positive. For example, the Fed increase in interest rates at the beginning of a sharp, the market generally expected recession and inflation needed to choose one of two. But a year down the road, it temporarily achieved both control inflation economy and continues improving the situation. Because of the lag of monetary policy, the subsequent inflation may see an accelerated decline. A peak next year means the same as telling the market that interest rate increases will stop next year. And the median interest rate of 5.1% next year also determines that the space for rate hikes next year is only 50-100 basis points. Combined with the current situation, the probability is 50%. Stay hawkish just because it's not time to celebrate yet. The Fed will continue to do its job.
The suspense is still left until the first quarter of next year, but the overall trend is already obvious.

Nasdaq Composite is super weakIXIC is the weakest index adding gravity to the rest of indexes. Since 13 weeks it's not able to jump up above (W)MA200. The longer you stay below (W)MA200 the less chances you have to jump above it. Last sustained break of IXIC below (W)MA200 was September 2008

IXIC resistance lines to watchThe points in the chart show a bearish outlook for the US COMPOSITE INDEX. This trend may reverse if the price rises above the 1D Cosmic Gravity support channel.

BKEX Institute Annual Strategy Report(2022–2023)In 2022, the world experienced an epidemic, war, and sanctions against China and Russia from Europe and the U.S. Many factors have pushed up commodity prices, especially energy. Epidemics and wars have also impacted supply chains, leading to imbalances in supply and demand. On top of that, global central banks release massive amounts of liquidity to rescue the economy during the epidemic. This has shown that the composition of this inflation problem is relatively complex.
qr61.cn
As far as the data is concerned, inflation is concentrated in the two main categories of food (10.9%) and energy (17.6%), as well as the breakdown of automobiles (8.4%) and transportation services (15.2%). It can be seen that rising commodity and energy prices are the leading cause of inflation problems.
qr61.cn
Inflation in food comes mainly from poultry, eggs, cereals, and cereal products. Poultry and eggs are mainly due to the more serious avian influenza outbreaks in producing countries this year, resulting in lower production. The avian flu is still severe, and output has not recovered. Russia and Ukraine make and export wheat in cereal, accounting for 20% and 28% of the world’s production, respectively. There are no signs of the conflict cooling down. Therefore, it should be difficult for this part of inflation to fall quickly. But there is relative optimism: the prices of alternatives such as pork, beef, and dairy products have already declined in the October data. And inflation on food is not a significant problem as long as it remains stable and does not increase significantly.
qr61.cn
The primary sources of energy inflation are gasoline (17.5%), fuel oil (68.5%), electricity (14.1%), and natural gas (20%). Of these, fuel oil rose 68.5%. However, there is a clear seasonality in demand for fuel. After the end of the heating season in January next year, it will naturally decline significantly.
qr61.cn
Also, combine this with the sharp decline in U.S. oil reserves when oil prices were high this year. Events such as the bizarre bombing of the Nord Stream pipeline during the Russia-Ukraine conflict and the massive U.S. exports of high-priced natural gas to Europe make it easy to conclude that energy prices have been under control.
On top of that, we can see that commodity and energy price indices are already falling. This part of the decline is not reflected in the last CPI data for October, which is the consumer side of the price response, while the PPI is the production side, which can be interpreted as a leading index. Therefore, we can remain optimistic about future inflation data.
For the original text, please open BKEX.COM and go to the Help Center — to view it.
